It works locally. It works in staging. It breaks in production.
And you have no idea why.
✓ Instrumented in < 4 minutes ✓ 1-command installation ✓ Free for student & indie hackers
Password
Note: Any edits you make will be reset after a few hours. Feel free to explore all features!
Featured on
You know the drill.
You need to see what a variable was at the exact moment something broke. So you:
1 Add a log statement
2 Push to Git
3 Wait 15 minutes for CI/CD
4 Cross your fingers it reproduces
5 Realize you logged the wrong thing
6 Repeat
Hours wasted. Customer still waiting. And you’re thinking: *"There h…
It works locally. It works in staging. It breaks in production.
And you have no idea why.
✓ Instrumented in < 4 minutes ✓ 1-command installation ✓ Free for student & indie hackers
Password
Note: Any edits you make will be reset after a few hours. Feel free to explore all features!
Featured on
You know the drill.
You need to see what a variable was at the exact moment something broke. So you:
1 Add a log statement
2 Push to Git
3 Wait 15 minutes for CI/CD
4 Cross your fingers it reproduces
5 Realize you logged the wrong thing
6 Repeat
Hours wasted. Customer still waiting. And you’re thinking: "There has to be a better way."
Maybe you’ve looked at Datadog or New Relic. $500+/month. Enterprise sales calls. Dashboards built for teams of 50, not teams of 1.
Here’s what happened to Alex.
Alex runs a subscription SaaS. Solo founder, Node.js stack, just started getting real customers.
📧
One morning, a customer emails: "My payment failed but I have money in my account."
The logs show the Stripe webhook hit the server. Status 200. But the subscription didn’t activate. For some customers it works. For this one, it doesn’t.
Can’t reproduce it locally. Stripe’s test webhooks work fine. The bug only happens in production, with real data, at random.
"
I spent two days adding logs, redeploying, waiting. Every time I thought I had it, I’d realize I needed to log something else. I was losing subscriptions.
Then they tried something different.
🎯
Instead of adding another log and redeploying, Alex added a capture point using the TraceKit SDK — one line of code at the suspicious webhook handler. From the dashboard, they enabled capturing and waited.
The next time a webhook failed, the SDK automatically captured the exact request payload, headers, and variable state at that moment. Alex inspected everything from the dashboard — no redeploy needed.
Root Cause Found
A race condition with an async database write. The log statement ran before the failure happened — that’s why it never showed anything useful.
Time to find the bug: 10 minutes
Fixed in one deploy. No more lost subscriptions.
What made it possible?
TraceKit
Debug production without redeploying.
Add capture points with our SDK. Control them from the dashboard. Inspect variable state at any moment. See the full journey of every request. No redeploy to debug. No guessing.
🎯
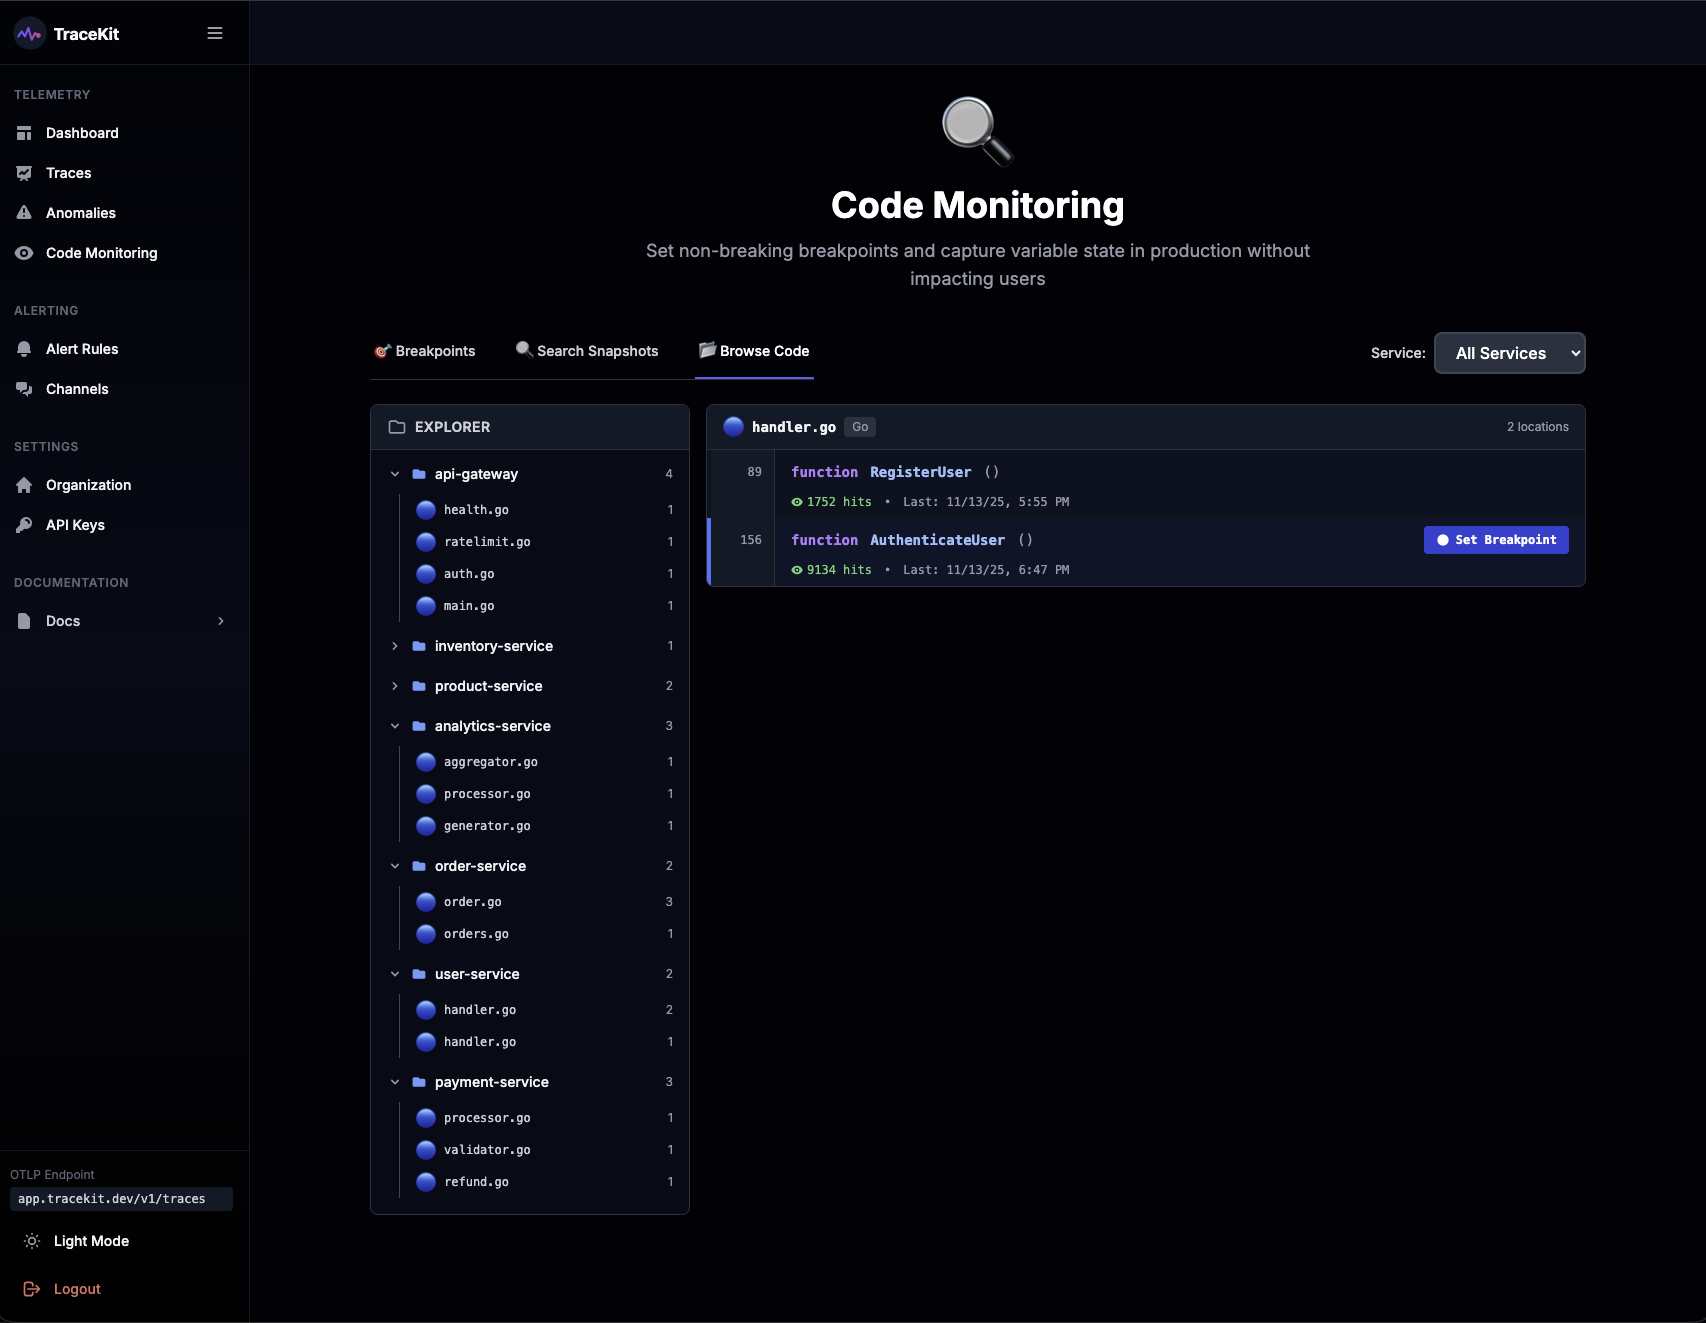
Live Production Breakpoints
Set capture points in your code via our SDK. When issues occur, inspect variables, check state, and trace the exact path - all without stopping your app or deploying new code. Control everything from your dashboard.
🔍
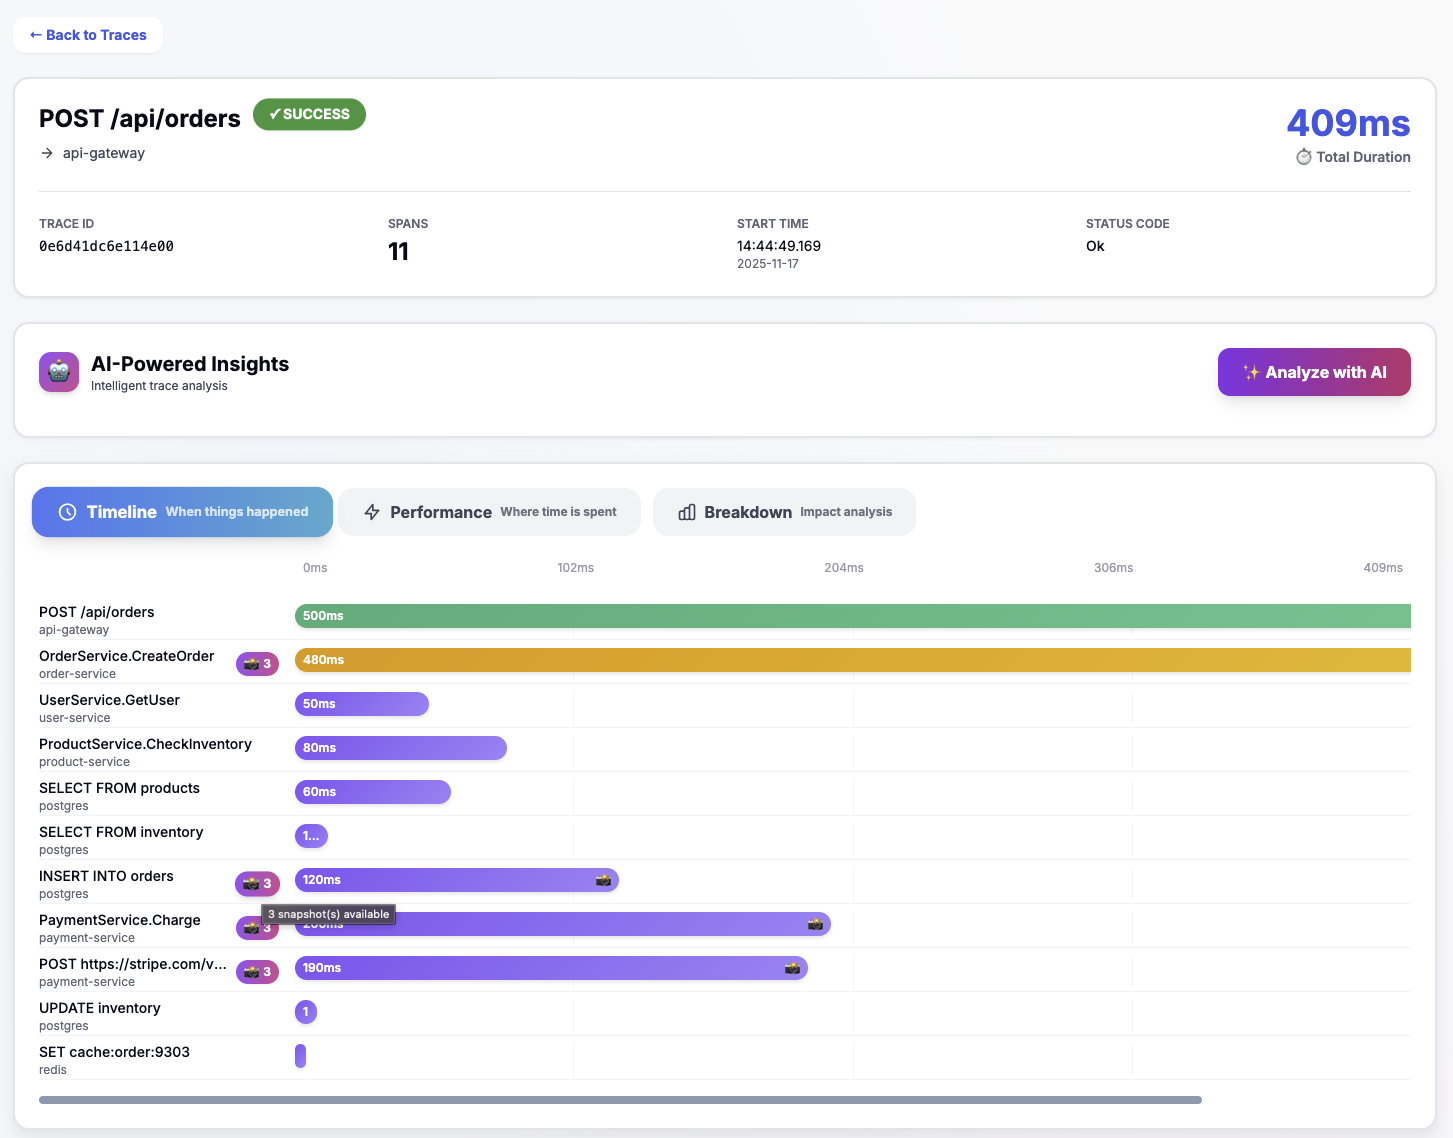
Request Lifecycle Replay
Replay any request as a sequence diagram. See exactly what happened: which services were called, in what order, how long each took, and where it failed. Like a DVR for your distributed system.
⚡
Instant Context, Not Log Diving
Stop spending 30-90 minutes correlating logs across services. Click the trace. See everything. Fix it.
💰
Multi-Framework Support
Works with Go (including Gin, Echo), PHP (Gemvc, Laravel, Symfony), Python, and more. One SDK, consistent experience across your entire stack.
🔔
Smart Alerting
Push alerts to Slack, Telegram, or any webhook endpoint. Health check failures, error spikes, anomaly detection - delivered where you already work.
🚀
Embeddable Widgets
Status badges, metrics dashboards, and alerts that embed directly into your apps or status pages. Keep your users informed with real-time system health.
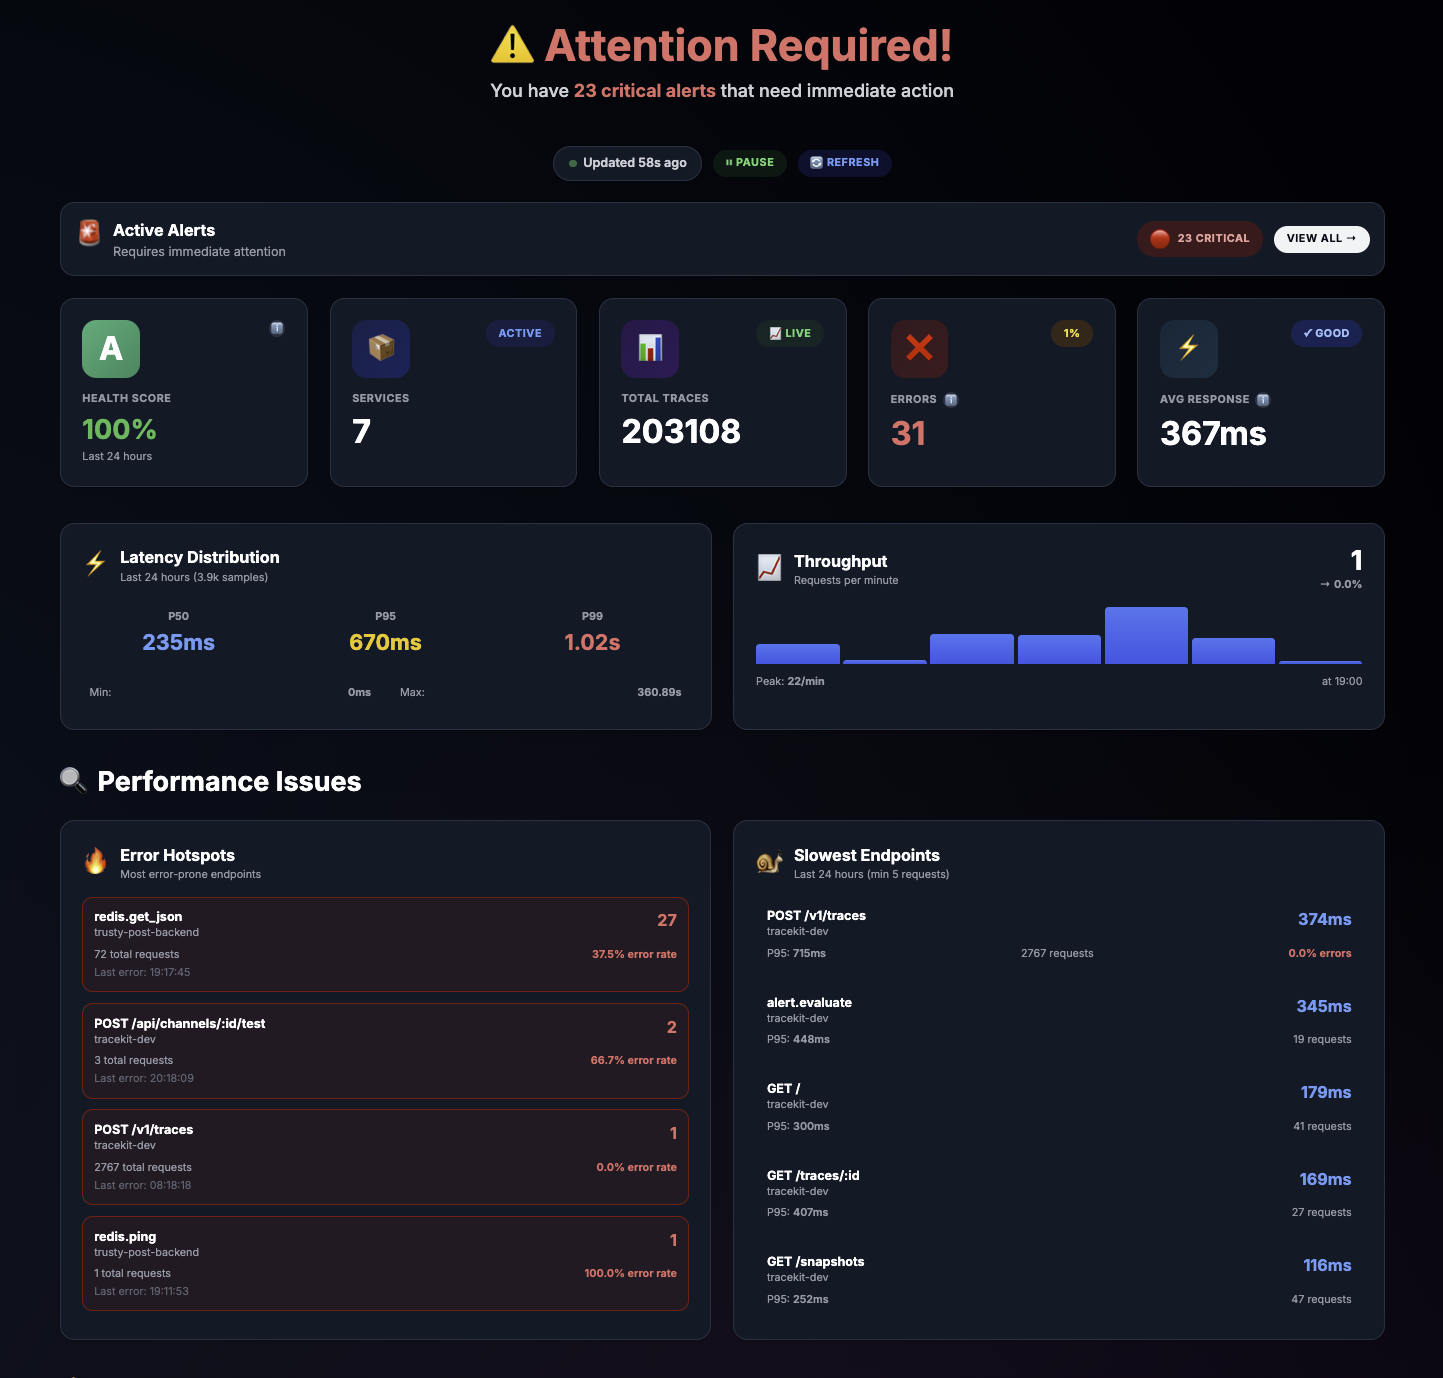
See TraceKit in Action
Real-time simulation of production monitoring. This is what your dashboard could look like.
One Command Does Everything
Zero-friction setup. Create an account, get an API key, and start monitoring in under 60 seconds.
🍺 Homebrew
⚡ Quick Install
$ brew install Tracekit-Dev/tap/tracekit
✓ tracekit installed successfully
$ tracekit init
Detecting framework...
✓ Detected: Gemvc (PHP)
Enter code: 847291
✓ Email verified
✓ Account created
✓ API key saved to .env
✓ Test trace sent successfully
┌───────────────────────────────────────────┐
│  🎉 TraceKit Ready!                       │
├───────────────────────────────────────────┤
│  Dashboard:  https://app.tracekit.dev     │
│  Plan:       Hacker (Free - 200k/month)   │
│  Service:    my-gemvc-app                 │
└───────────────────────────────────────────┘
🔍
Auto-Detect Framework
Gemvc, Laravel, Symfony, Express, Django, Gin, and 10+ more
🔑
Instant API Key
Creates account, generates key, saves to .env automatically
📦
SDK Installation
Optionally installs OpenTelemetry SDK for your language
💓
Health Monitoring
Configure push or pull-based health checks in seconds
Don’t take our word for it.
"
TraceKit helped me find performance issues before I released the new version of my framework. I was able to fine-tune everything and fix problems before they hit users.
Ali Khorsandfard
Creator of Gemvc PHP Framework
Ali is now building a native TraceKit integration into Gemvc — one-click monitoring for every framework user.
Transparent Pricing. No Surprises.
Datadog: $500+/month
New Relic: $500+/month
TraceKit: Starting at $29/month
FREE FOREVER
Free
0 /forever
200k traces/month for students and indie hackers with zero revenue
- ✓ 200k traces/month
- ✓ All core features included
- ✓ Live breakpoints included
- ✓ Health check monitoring
- ✓ Webhooks included
- ✓ Embeddable widgets
- ✓ Full API access
- ✓ Email support
- ✓ No credit card required
- ✓ No time limits
Starter
$ 29 /month
Perfect for solo developers and side projects
- ✓ 1M traces/month
- ✓ 30-day retention
- ✓ Unlimited team members
- ✓ Unlimited services
- ✓ Unlimited metrics
- ✓ Live breakpoints included
- ✓ Health check monitoring
- ✓ Webhooks included
- ✓ Embeddable widgets
- ✓ Full API access
- ✓ Priority support
⭐ MOST POPULAR
Growth
$ 99 /month
For small teams shipping fast
- ✓ 10M traces/month
- ✓ 30-day retention
- ✓ Unlimited team members
- ✓ Unlimited services
- ✓ Unlimited metrics
- ✓ Live breakpoints included
- ✓ Health check monitoring
- ✓ Webhooks included
- ✓ Embeddable widgets
- ✓ Full API access
- ✓ Priority support
Pro
$ 299 /month
For growing startups with multiple services
- ✓ 50M traces/month
- ✓ 180-day retention
- ✓ Unlimited team members
- ✓ Unlimited services
- ✓ Unlimited metrics
- ✓ Live breakpoints included
- ✓ Health check monitoring
- ✓ Webhooks included
- ✓ Embeddable widgets
- ✓ Full API access
- ✓ Dedicated support
Stop guessing. Start seeing.
The next time production breaks, you’ll know exactly what went wrong — in minutes, not hours.
✓ Instrumented in < 4 minutes ✓ Fix your first bug in 24 hours or don’t pay ✓ Cancel anytime
Frequently Asked Questions
Yes. TraceKit is designed for production from day one. Less than 5% performance overhead. Capture points work asynchronously — they don’t pause your application.
PHP (including Gemvc, Laravel, Symphony, etc.), Python, Node.js, Go, Java, and Ruby. Built on OpenTelemetry, so you’re not locked in.
Sentry shows you errors after they happen. TraceKit lets you capture variable state at any point in your code — including the moments before an error, or for bugs that don’t throw exceptions at all.
Yes. Set up webhooks to push alerts to Slack, Telegram, or any endpoint. Health check failures, error spikes, anomaly detection — all delivered where you already work.
TraceKit offers embeddable widgets including status badges, metrics dashboards, and alerts that can be embedded directly into your apps or status pages. Perfect for showing uptime, response times, and service health to your users.
Email [email protected]. Real humans, fast responses. We’re developers too — we get it.