Every sales organization depends on understanding which distributors perform best and which items drive the most volume. Yet in many analytics teams, this information remains trapped in spreadsheets, requiring manual cleanup, complex formulas, pivot tables, and hours of repetitive effort every month.
In this project, I automated that entire workflow using n8n, an open-source workflow automation platform. What started as a simple Excel export containing distributor names, item details, and monthly sales was transformed into a fully automated KPI engine that calculates aggregates, ranks top performers, and generates clean, structured outputs for downstream reporting or AI-driven analysis.
Beyond eliminating manual work, this approach demonstrates how low-code ...
Every sales organization depends on understanding which distributors perform best and which items drive the most volume. Yet in many analytics teams, this information remains trapped in spreadsheets, requiring manual cleanup, complex formulas, pivot tables, and hours of repetitive effort every month.
In this project, I automated that entire workflow using n8n, an open-source workflow automation platform. What started as a simple Excel export containing distributor names, item details, and monthly sales was transformed into a fully automated KPI engine that calculates aggregates, ranks top performers, and generates clean, structured outputs for downstream reporting or AI-driven analysis.
Beyond eliminating manual work, this approach demonstrates how low-code automation can bridge the gap between raw operational data and scalable analytics — without relying on brittle Excel logic or heavy custom scripting.
Situation we are dealing with:
Our sales team received a recurring Excel export from the ERP system. The data structure was simple:
- Distributor
- Item name
- Monthly Sales in the dollowing columns
every month, Analyst has to process the data to give the repetitive metrics.
My goal was to design an automation that:
- Ingests the ERP Excel file automatically
- Processes each row into structured JSON
- Aggregates sales across distributors and items
- Generates formatted summaries
- Outputs clean KPI data for dashboards or AI agents

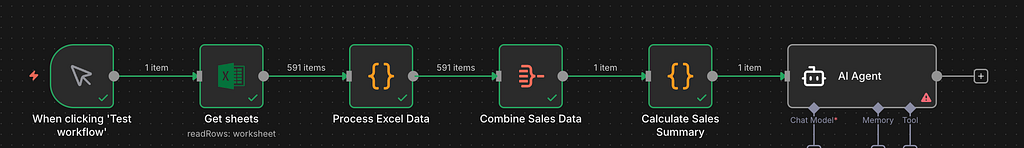
I built a multi-step n8n workflow that mirrored the work of a human analyst, but at machine speed.
1. Manual or Scheduled Trigger
This starts the workflow with each new ERP export.
2. Read Excel
The file is converted into structured JSON rows.
3. Process Excel Data
A JavaScript block extracts:
- Distributor
- Item name
- Aug, Sep, Oct values
This logic dynamically detects column types rather than depending on header names, which makes it resilient to column order changes.
Example structured Row
{ "distributor": "Cascade Beverage Supply", "itemname": "Tropical Breeze 12/19.2 oz Can", "aug": 1286.27, "sep": 1481.60, "oct": 1451.47 }Final output looks like below
Sales by Distributor Distributor | Aug | Sep | Oct ---------------------------------------------- Cascade Beverage Supply | 7547.87 | 7815.34 | 8734.12 GreenPeak Distribution | 3642.43 | 3654.56 | 4286.23 Harborline Craft Distributors | 931.99 | 965.83 | 911.07 RueNorth Liquid Logistics | 46.09 | 9.24 | 85.13
Sales by Item Item Name | Total Sales ----------------------------------- Tropical Breeze 12 oz | 4219.33 Citrus Spark 16 oz | 4689.54 Berry Burst 12 oz | 2876.67 Mango Wave 8 oz | 4902.50 Ginger Zest 16 oz | 2574.00 Pineapple Rush 12 oz | 2095.07 Guava Mist 12 oz | 743.50 Summer Blosson 16 oz | 1996.72
The workflow outputs:
- A human readable summary
- Distributor-level breakdowns
- Item-level totals
- Total number of monthly records
This structured output becomes the foundation for our Sales AI Agent in Part Two.
The outcome was immediate and measurable
- Monthly sales data processing time dropped from 2 hours to 10 seconds
- Leadership receives structured KPI insights instantly
- Distributor and item performance comparisons became fully automated
- Accuracy increased because the system no longer relies on manual formulas
- The sales team now uses the standardized output across forecasting, inventory decisions, and distributor performance reviews
Most importantly, the business gained a new metric.
Time to Insight Reduced by 99 Percent
By automating the sales KPI workflow with n8n, a process that previously took hours of manual effort was reduced to seconds. Monthly reporting no longer depends on spreadsheet cleanup or repeated formulas, allowing insights to be generated consistently and on demand.
Beyond the time savings, the automation improved reliability. KPI logic is now centralized, repeatable, and independent of individual spreadsheets, making the outputs easier to reuse across dashboards, reports, and downstream analytics.
While this example focuses on sales KPIs, the same approach can be applied anywhere repetitive data preparation slows decision-making. Workflow automation offers a practical way to move from manual reporting to scalable analytics without overengineering.
How I Automated Sales KPI Reporting with n8n and Cut 99% of Manual Work was originally published in Towards AI on Medium, where people are continuing the conversation by highlighting and responding to this story.