Published on December 24, 2025 9:03 PM GMT
Epistemic status: This is a quick analysis that might have major mistakes. I currently think there is something real and important here. I’m sharing to elicit feedback and update others insofar as an update is in order, and to learn that I am wrong insofar as that’s the case.
Summary
The canonical paper about Algorithmic Progress is by Ho et al. (2024) who find that, historically, the pre-training compute used to reach a particular level of AI capabilities decreases by about 3× each year. Their data covers 2012-2023 and is focused on pre-training.
In this post I look at AI models from 2023-2025 and find that, based on what I think is the most intuitive analysis, …
Published on December 24, 2025 9:03 PM GMT
Epistemic status: This is a quick analysis that might have major mistakes. I currently think there is something real and important here. I’m sharing to elicit feedback and update others insofar as an update is in order, and to learn that I am wrong insofar as that’s the case.
Summary
The canonical paper about Algorithmic Progress is by Ho et al. (2024) who find that, historically, the pre-training compute used to reach a particular level of AI capabilities decreases by about 3× each year. Their data covers 2012-2023 and is focused on pre-training.
In this post I look at AI models from 2023-2025 and find that, based on what I think is the most intuitive analysis, catch-up algorithmic progress (including post-training) over this period is something like 16×–60× each year.
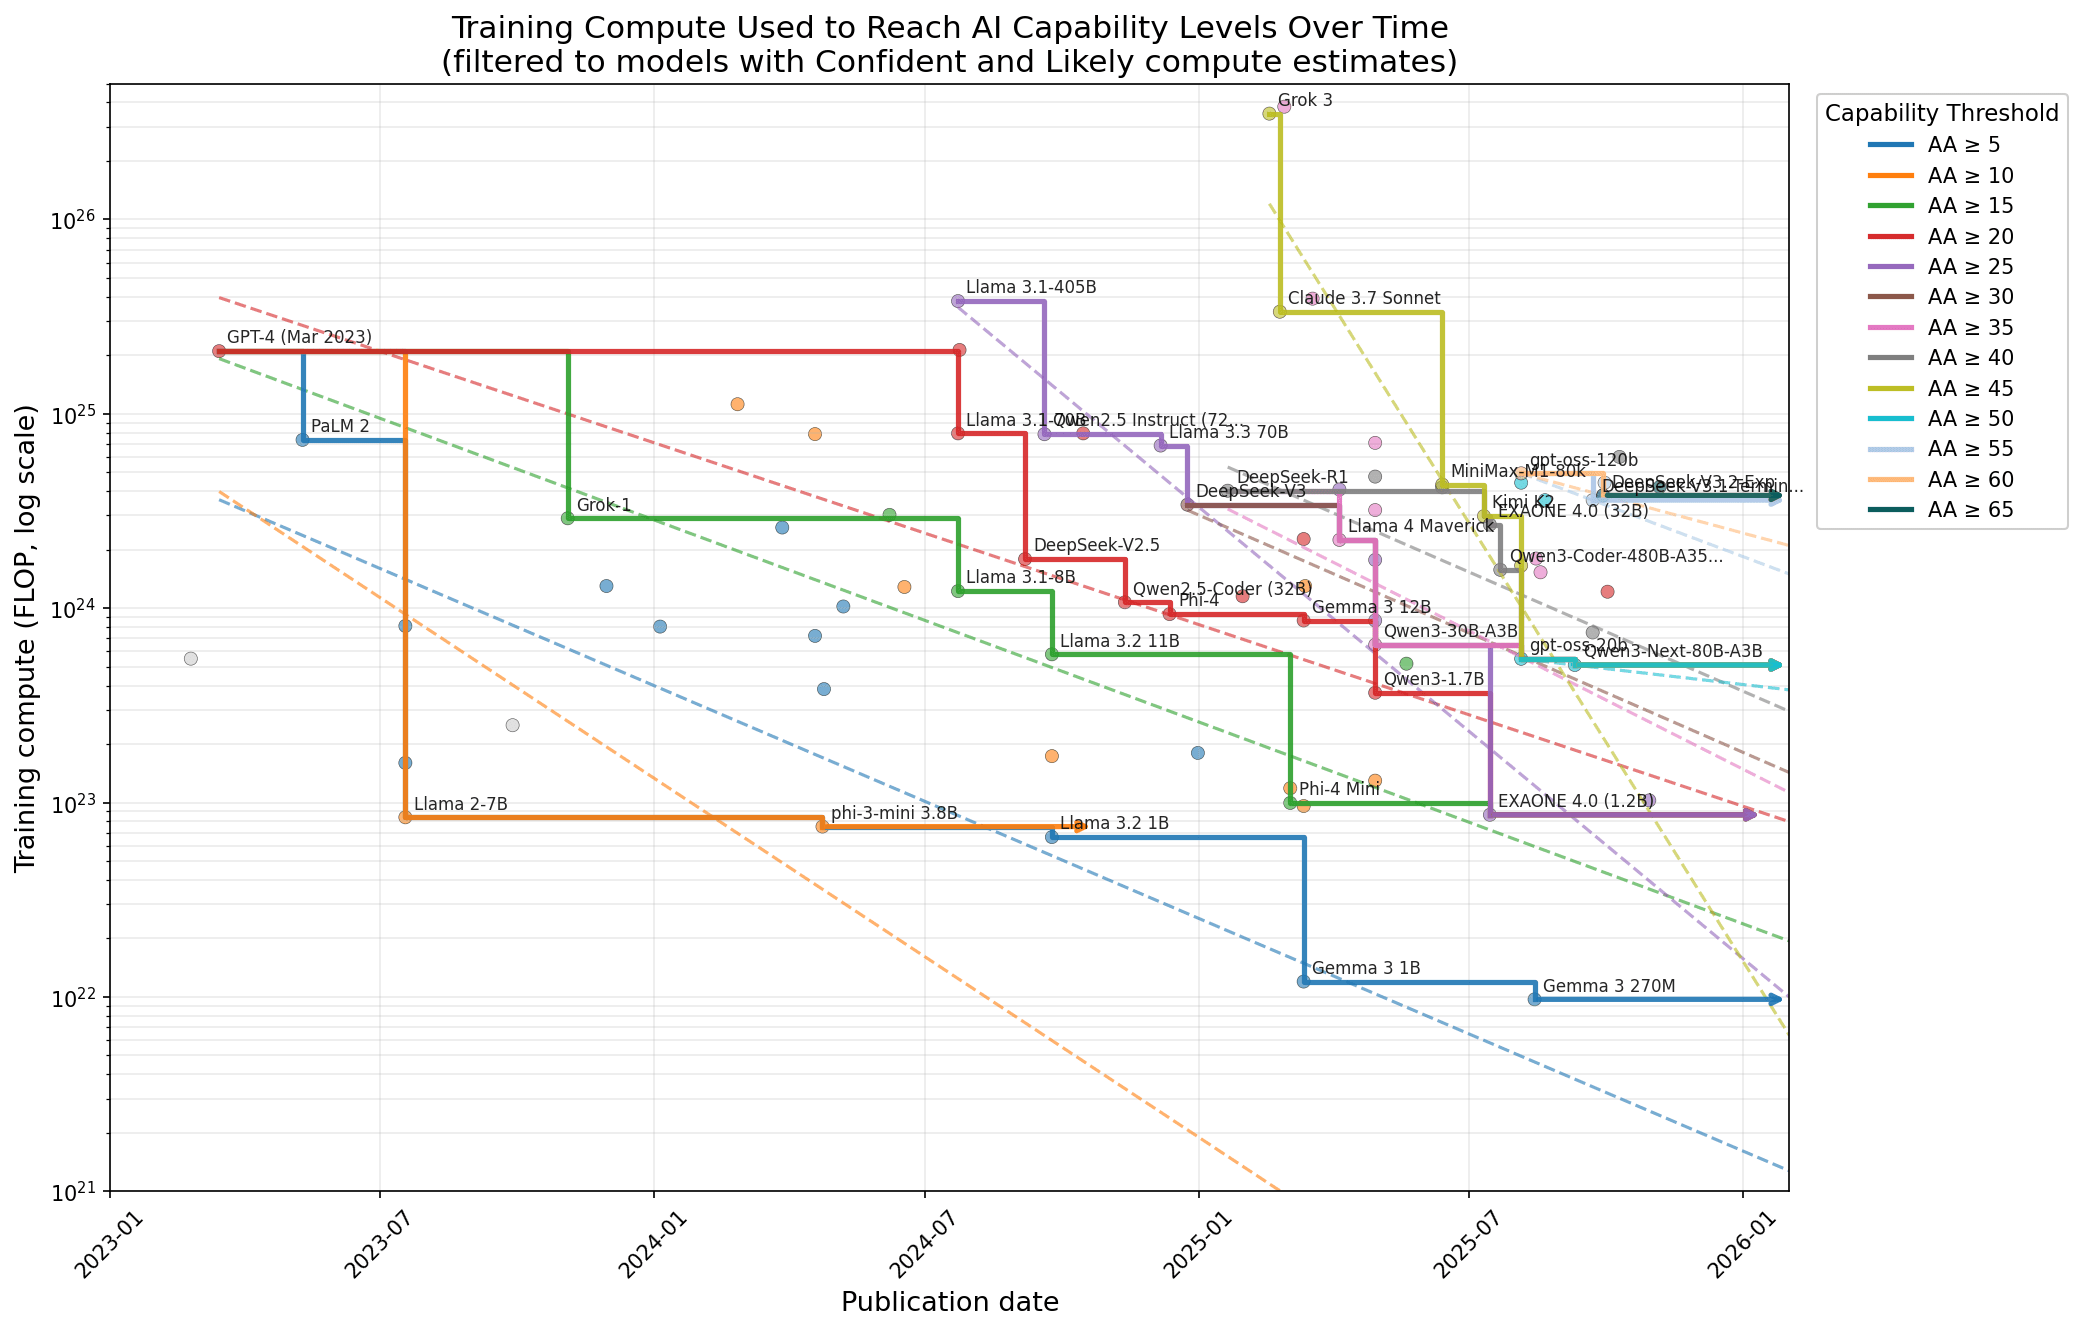
This intuitive analysis involves drawing the best-fit line through models that are on the frontier of training-compute efficiency over time, i.e., those that use the least training compute of any model yet to reach or exceed some capability level. I combine Epoch AI’s estimates of training compute with model capability scores from Artificial Analysis’s Intelligence Index. Each capability level thus yields a slope from its fit line, and these slopes can be aggregated in various ways to determine an overall rate of progress. One way to do this aggregation is to assign subjective weights to each capability level and take a weighted mean of the capability level slopes (in log-compute), yielding an overall estimate of algorithmic progress: 1.76 orders of magnitude per year, or a ~60× improvement in compute efficiency, or a 2 month halving time in the training compute needed to reach a particular capability level. Looking at the median of the slopes yields 16× or a halving time of 2.9 months.
Based on this evidence and existing literature, my overall expectation of catch-up algorithmic progress in the next year is maybe 20× with an 80% confidence interval of [2×–200×], considerably higher than I initially thought.
The body of this post explains catch-up vs. frontier algorithmic progress, discusses the data analysis and results, compares two Qwen models as a sanity check, discusses existing estimates of algorithmic progress, and covers several related topics in the appendices.
What do I mean by ‘algorithmic progress’?
First, let me differentiate between two distinct things people care about when they discuss “algorithmic progress”: the rate of catch-up, and algorithmic efficiency improvement at the frontier.
Catch-up: when a capability is first reached using X amount of compute, how long does it take until that capability can be reached with [some amount less than X] compute? Conveniently, catch-up is directly measurable using relatively simple measures: release date, benchmark scores, and an estimate of training compute. Catch-up rates affect the proliferation/diffusion of AI capabilities and indirectly reflect the second kind of algorithmic progress.
Algorithmic progress at the frontier is less clearly defined. It asks: for a given set of assumptions about compute growth, how quickly will the frontier of AI capabilities improve due to better algorithms? Frontier efficiency or “effective compute” informs predictions about the automation of AI research or an intelligence explosion; if compute remains constant while the amount of research effort surges, how much will capabilities improve?
Hernandez & Brown define effective compute as follows:
The conception we find most useful is if we imagine how much more efficient it is to train models of interest in 2018 in terms of floating-point operations than it would have been to “scale up” training of 2012 models until they got to current capability levels. By “scale up,” we mean more compute, the additional parameters that come with that increased compute, the additional data required to avoid overfitting, and some tuning, but nothing more clever than that.
Unfortunately, this is not easily measured. It invokes a counterfactual in which somebody in 2012 massively scales up training compute. (If they had actually done that, then, looking back, we would be measuring catch-up instead!) The common workaround is empirical scaling laws: train a family of models in 2012 using different amounts of compute but the same dataset and algorithms, and compare their training compute and performance, extrapolating to estimate how they would likely perform with more training compute.
Several factors affect the relative speed of these two measures. Catch-up might be faster due to distillation or synthetic data: once an AI model reaches a given capability level, it can be used to generate high-quality data for smaller models. Catch-up has a fast-follower or proof-of-concept effect: one company or project achieving a new frontier of intelligence lets everybody else know that this is possible and inspires efforts to follow suit (and the specific methods used might also be disseminated). On the other hand, the returns to performance from compute might diminish rapidly at the frontier. Without better algorithms, capabilities progress at the frontier may require vast compute budgets, rendering algorithmic efficiency a particularly large progress multiplier. However, it’s not clear to me how strongly these returns diminish on downstream tasks (vs. language modeling loss where they diminish steeply). See e.g., Owen 2024, Pimpale 2025, or the Llama-3.1 paper.
This post is about catch-up algorithmic progress, not algorithmic progress at the frontier.
Methods and Results
The intuitive way to measure catch-up algorithmic progress is to look at how much compute was used to train models of similar capability, over time, and then look at the slope of the compute frontier. That is, look at how fast “smallest amount of compute needed to reach this capability level” has changed over time, for different capability levels.
So I did that, with substantial help from Claude[1]. I use Epoch’s database of AI models for compute estimates (though I make a few edits to fix what I believe to be errors), and for capabilities, I use Artificial Analysis’s Intelligence Index, an average of 10 widely used benchmarks. Here’s the most important graph:
And the accompanying table:
Results table
| Capability_threshold | slope_log10_yr | efficiency_factor_yr | multiplier_yr | subjective_weight | n_models | n_models_on_frontier | first_date | last_date |
5 | 1.20 | 15.72 | 0.064 | 5 | 80 | 7 | 2023-03-15 | 2025-08-14 |
10 | 1.85 | 70.02 | 0.014 | 5 | 67 | 3 | 2023-03-15 | 2024-04-23 |
15 | 1.04 | 10.92 | 0.092 | 8 | 57 | 6 | 2023-03-15 | 2025-07-15 |
20 | 0.93 | 8.60 | 0.116 | 9 | 51 | 8 | 2023-03-15 | 2025-07-15 |
25 | 2.32 | 210.24 | 0.005 | 9 | 39 | 7 | 2024-07-23 | 2025-07-15 |
30 | 1.22 | 16.61 | 0.060 | 8 | 31 | 5 | 2024-12-24 | 2025-09-10 |
35 | 1.41 | 25.91 | 0.039 | 8 | 30 | 5 | 2025-01-20 | 2025-09-10 |
40 | 1.22 | 16.50 | 0.061 | 8 | 22 | 6 | 2025-01-20 | 2025-09-10 |
45 | 4.48 | 29984.61 | 0.000 | 8 | 15 | 6 | 2025-02-17 | 2025-09-10 |
50 | 0.32 | 2.11 | 0.473 | 0 | 10 | 2 | 2025-08-05 | 2025-09-10 |
55 | 1.05 | 11.25 | 0.089 | 0 | 6 | 2 | 2025-08-05 | 2025-09-22 |
60 | 0.754 | 5.68 | 0.176 | 0 | 3 | 2 | 2025-08-05 | 2025-09-29 |
65 | 0 | 2 | 1 | 2025-09-29 | 2025-09-29 | |||
| Mean | 1.48 | 2531.51 | 0.099 | |||||
| Weighted | 1.76 | 3571.10 | 0.051 | 68 | ||||
| Weighted log conversion | 1.76 | 57.10 | 0.018 | |||||
| Median | 1.21 | 16.10 | 0.062 |
The headline result: By a reasonable analysis, catch-up algorithmic progress is 57× (call it 60×) per year in the last two years. By another reasonable analysis, it’s merely 16×.
These correspond to compute halving times of 2 months and 2.9 months.
There were only three capability levels in this dataset that experienced less than one order of magnitude per year of catch-up.
There are a bunch of reasonable ways to filter/clean the data. For example, I choose to focus only on models with “Confident” or “Likely” compute estimates. Historically, I’ve found the methodology for compute estimates shaky in general, and less confident compute estimates seem pretty poor. To aggregate across the different capability bins, I put down some subjective weightings.[2]
Other ways of looking at the data, such as considering all models with compute estimates or only those with Confident estimates, produce catch-up rates mostly in the range of 10×–100× per year. I’ve put various other analyses in this Appendix.
Sanity check: Qwen2.5-72B vs. Qwen3-30B-A3B
As a sanity check, let’s look at progress between Qwen2.5 and Qwen3. For simplicity, I’ll just look at the comparison between Qwen2.5-72B-Instruct and Qwen3-30B-A3B (thinking)[3]. I picked these models because they’re both very capable models that were near the frontier of compute efficiency at their release, among other reasons[4]. I manually calculated the approximate training compute for both of these models[5].
| Model | Qwen2.5-72B-Instruct | Qwen3-30B-A3B (thinking) |
|---|---|---|
| Release date | September 18 2024 | April 29 2025 |
| Training compute (FLOP) | 8.6e24 | 7.8e23 |
| Artificial Analysis Intelligence Index | 29 | 36.7 |
| Approximate cost of running AAII ($)[6] | 3.4 | 38 |
So these models were released about 7.5 months apart, the latter is trained with an order of magnitude less compute, and it exceeds the former’s capabilities—for full eval results see this Appendix. The 60×/yr trend given above would imply that reaching the capabilities of Qwen2.5-72B-Instruct with 7.8e23 FLOP would take 7.1 months[7]. Meanwhile, Qwen3-30B-A3B (thinking) exceeded this capability after 7.5 months. (I’m not going to attempt to answer whether the amount of capability-improvement over 2.5 is consistent with the trend.) So the sanity check passes: from Qwen2.5 to Qwen3 we have seen training compute efficiency improve significantly. (I’m not going to analyze the inference cost differences, though it is interesting that the smaller model is more expensive due to costing a similar amount per token and using many more tokens in its answers!)
Discussion
How does this compare to the recent analysis in A Rosetta Stone for AI Benchmarks?
There are a bunch of existing estimates of algorithmic progress. One of the most recent and relevant is that from Ho et al. 2025, who use the Epoch Capabilities Index (ECI) to estimate algorithmic progress in various ways. I’ll focus on this paper and then briefly discuss other previous estimates in the next section.
Their Appendix C.2 “Directly estimating algorithmic progress” performs basically the same methodology as in this post, but they relegate it to an appendix because they do not consider it to be the most relevant. They write: “This gives us a way of sanity-checking our core results, although we consider these estimates less reliable overall — hence we place them in the appendix rather than in the main paper.” and later “Like the estimates using our primary method in Section 3.2.2, the range of values is very wide. In particular, we find training compute reductions from 2× to 400×! The median estimate across these is around 10× per year, but unfortunately we do not have much data and consider this method quite unreliable.”
I find this reasoning unconvincing because their appendix analysis (like that in this blog post) is based on more AI models than their primary analysis! The primary analysis in the paper relates a model’s capabilities (Cm) to its training compute (Fm) as follows: Cm = k*log(Fm) + b, where b is the algorithmic quality of a model. Then solving for algorithmic progress is a multi-step process, using specific model families[8]to estimate k, and then using k to estimate b for all models. The change in b over time is algorithmic progress. The crucial data bottleneck here is on step one, where you use a particular model family to estimate k. They only have 12 models in the primary analysis, coming from the Llama, Llama 2, and Llama 3.1 families. The overall results are highly sensitive to these models, as they discuss: “Much of this uncertainty comes from the uncertainty in the estimate of k.” I would consider relying on just 3 model families to be a worse case of “we do not have much data”, and thus not a good argument against using the intuitive approach.
There are various other differences between this post and Ho et al. 2025 where I think I have made a better choice.
In their primary analysis of algorithmic progress they exclude “distilled” models. They write “We drop distilled models from the dataset since we are interested in capturing the relationship between model capabilities and training compute for the final training run. This relationship might be heavily influenced by additional compute sources, such as from distillation or substantial quantities of synthetic data generation (Somala, Ho, and Krier 2025).” In an appendix, they correctly explain that publicly available information doesn’t tell us whether many models are distilled, making this difficult to do in practice.
I also think it’s unprincipled. When thinking about catch-up algorithmic progress, it’s totally fine for existing models to influence the training of future models, for instance, via creating synthetic data, being used for logit distillation, or even doing research and engineering to train future AIs more efficiently. I don’t see the principled reason to exclude distilled models, given that existing models simply will, by default, be used to help train future models. But note that this isn’t universally true. For example, it was reported that Anthropic cut off access to Claude for OpenAI employees, and broadly there are many access-levels of AI that would prevent certain kinds of “use of existing models to help train future models”. Interestingly, their appendix results show similar results to the main paper even when including distilled models.
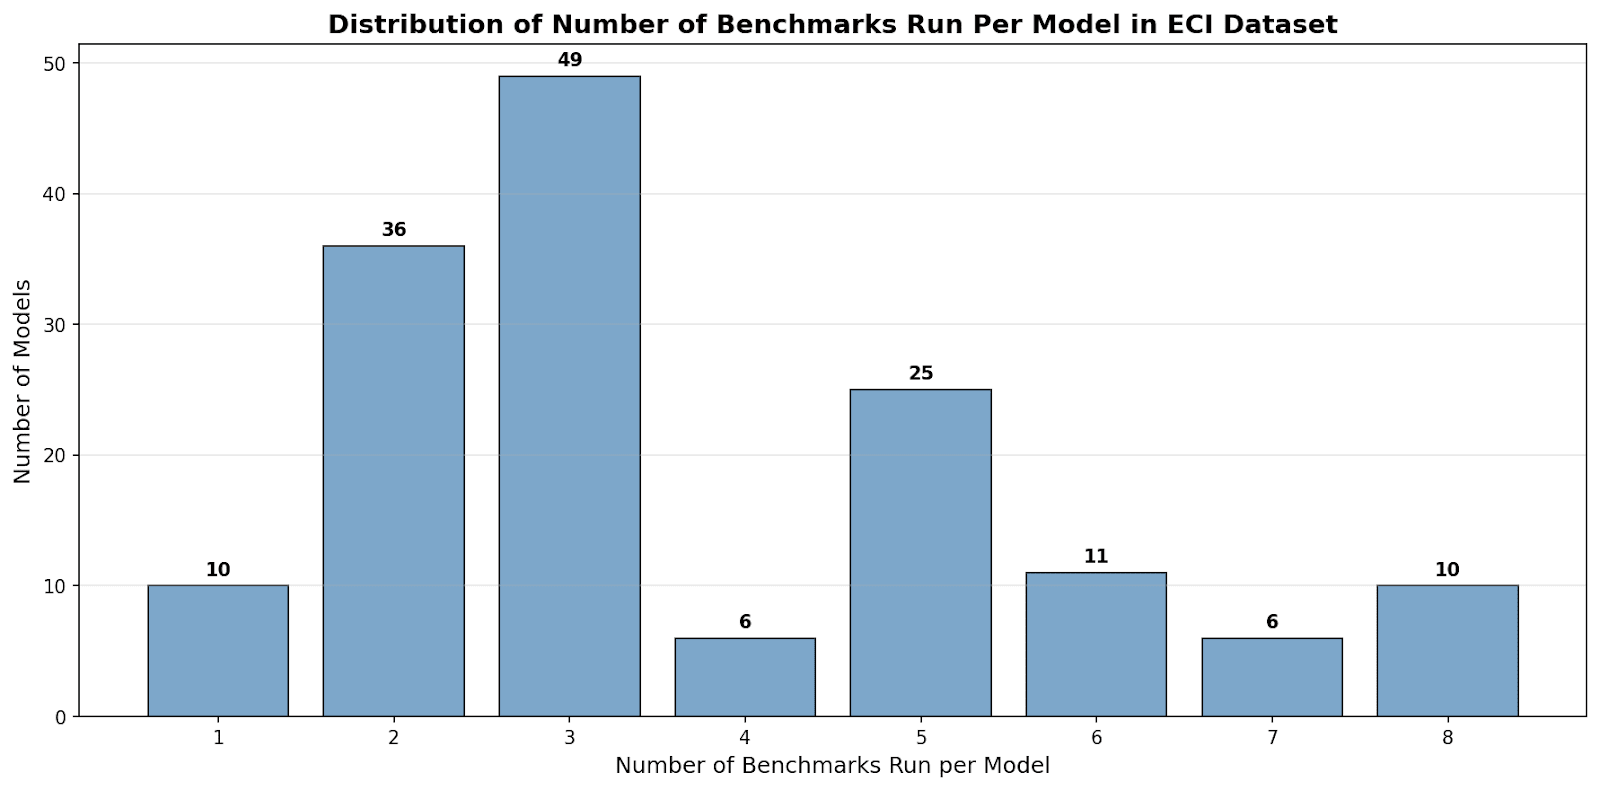
I am also unconvinced that ECI is a better metric to use than AAII. One issue with ECI scores is that they are often calculated using just 2 benchmark scores for a particular model. I expect this introduces significant noise. By comparison, the Artificial Analysis Intelligence Index includes 10 benchmark scores for each model (at least most of the time, see this limitation). As we can see, the ECI score for many models is based on just 2 or 3 different benchmark scores:
How does this compare to other previous estimates of algorithmic progress
For the sake of time, I’m just discussing headline results. I’m not going to discuss the methodological differences between these works or whether they focus on catch-up or algorithmic progress at the frontier. This is more of a pointer to the literature than an actual literature review:
- Hernandez & Brown (2020) find that algorithmic progress in computer vision is 1.7× per year.
- Erdil & Besiroglu (2023) find that algorithmic progress in computer vision is 2.5× per year.
- Ho et al. (2024) find that algorithmic progress in language models is progressing at around 2.7× (often rounded to 3×), 95% CI [1.8×–6.3×], per year.
- Ho et al. (2025) (discussed above) find that algorithmic progress in language models is 6× per year. Other estimates they arrive at with various methods include 5×, 3.5×, 10×, and 20×.
- Gundlach et al. (2025) account for specific algorithmic improvements that net out to around a 2.2× rate of algorithmic progress.
- Whitfill et al. (2025) estimate algorithmic progress in language models at 3.5× per year.
- MacAskill & Moorhouse (2025) combine existing estimates of pre-training algorithmic progress (3× from Ho et al. 2024) with an informal guess at post-training enhancements from Anthropic (3×) to arrive at a combined rate of overall algorithmic progress of around 9× per year.
- In January 2025, Dario Amodei wrote the following: “In 2020, my team published a paper suggesting that the shift in the curve due to algorithmic progress is ~1.68×/year [Hernandez & Brown, 2020]. That has probably sped up significantly since; it also doesn’t take efficiency and hardware into account. I’d guess the number today is maybe ~4×/year.”
As discussed in an Appendix, the rate of inference cost reduction is also relevant to one’s overall estimate of algorithmic progress.
- Gundlach et al. (2025) estimate a rate of algorithmic progress relevant to inference prices at 3× per year, or 5× to 10× before taking hardware efficiency into account.
Other related work includes:
How should we update on this analysis?
I think we should update on this analysis, even though there are various methodological concerns—see this Appendix for limitations. This analysis was about using the most intuitive approach to estimate the rate of catch-up algorithmic progress. As somebody who doesn’t love math, I think intuitive approaches, where they are available, should be preferred to complicated modeling.
How should we update? Well, if you are me and you previously thought that algorithmic progress was 3× per year, you should update toward thinking it is higher, e.g., 60× or 20× or somewhere between your previous view and those numbers. The data from the last 2 years is not consistent with 3× per year algorithmic progress (to be clear and fair to Ho et al. 2024, their work focused on pre-training only). Due to the combination of pre-training improvements and post-training improvements, one probably should have expected overall algorithmic progress to be greater than 3× even before seeing these results. But also remember that catch-up algorithmic progress is not the same as algorithmic progress at the frontier!
Based on this analysis and the existing literature, my current all-things-considered view is that catch-up algorithmic progress in the last couple of years and for the next year is likely 20× with an 80% confidence interval of [2×–200×], considerably higher than I initially thought.
Here is a concrete and falsifiable prediction from that estimate[9]:
DeepSeek-V3.2-Exp is estimated by Epoch to be trained with 3.8e24 FLOP. It reached an AAII index score of 65.9 and was released on September 29, 2025. It is on the compute-efficiency frontier. I predict that by September 29, 2026, the least-compute-used-to-train model that reaches a score of 65 will be trained with around 1.9e23 FLOP, with the 80% CI covering 1.9e22–1.9e24 FLOP.
There are various implications of this update for one’s beliefs about AI governance, but I won’t discuss them for the sake of time.
The analysis here should be largely replicable using this data[10]and this colab notebook[11]. The various tables in this post are available in spreadsheet format here.
Appendices
Appendix: Filtering by different confidence levels of compute estimates
All models
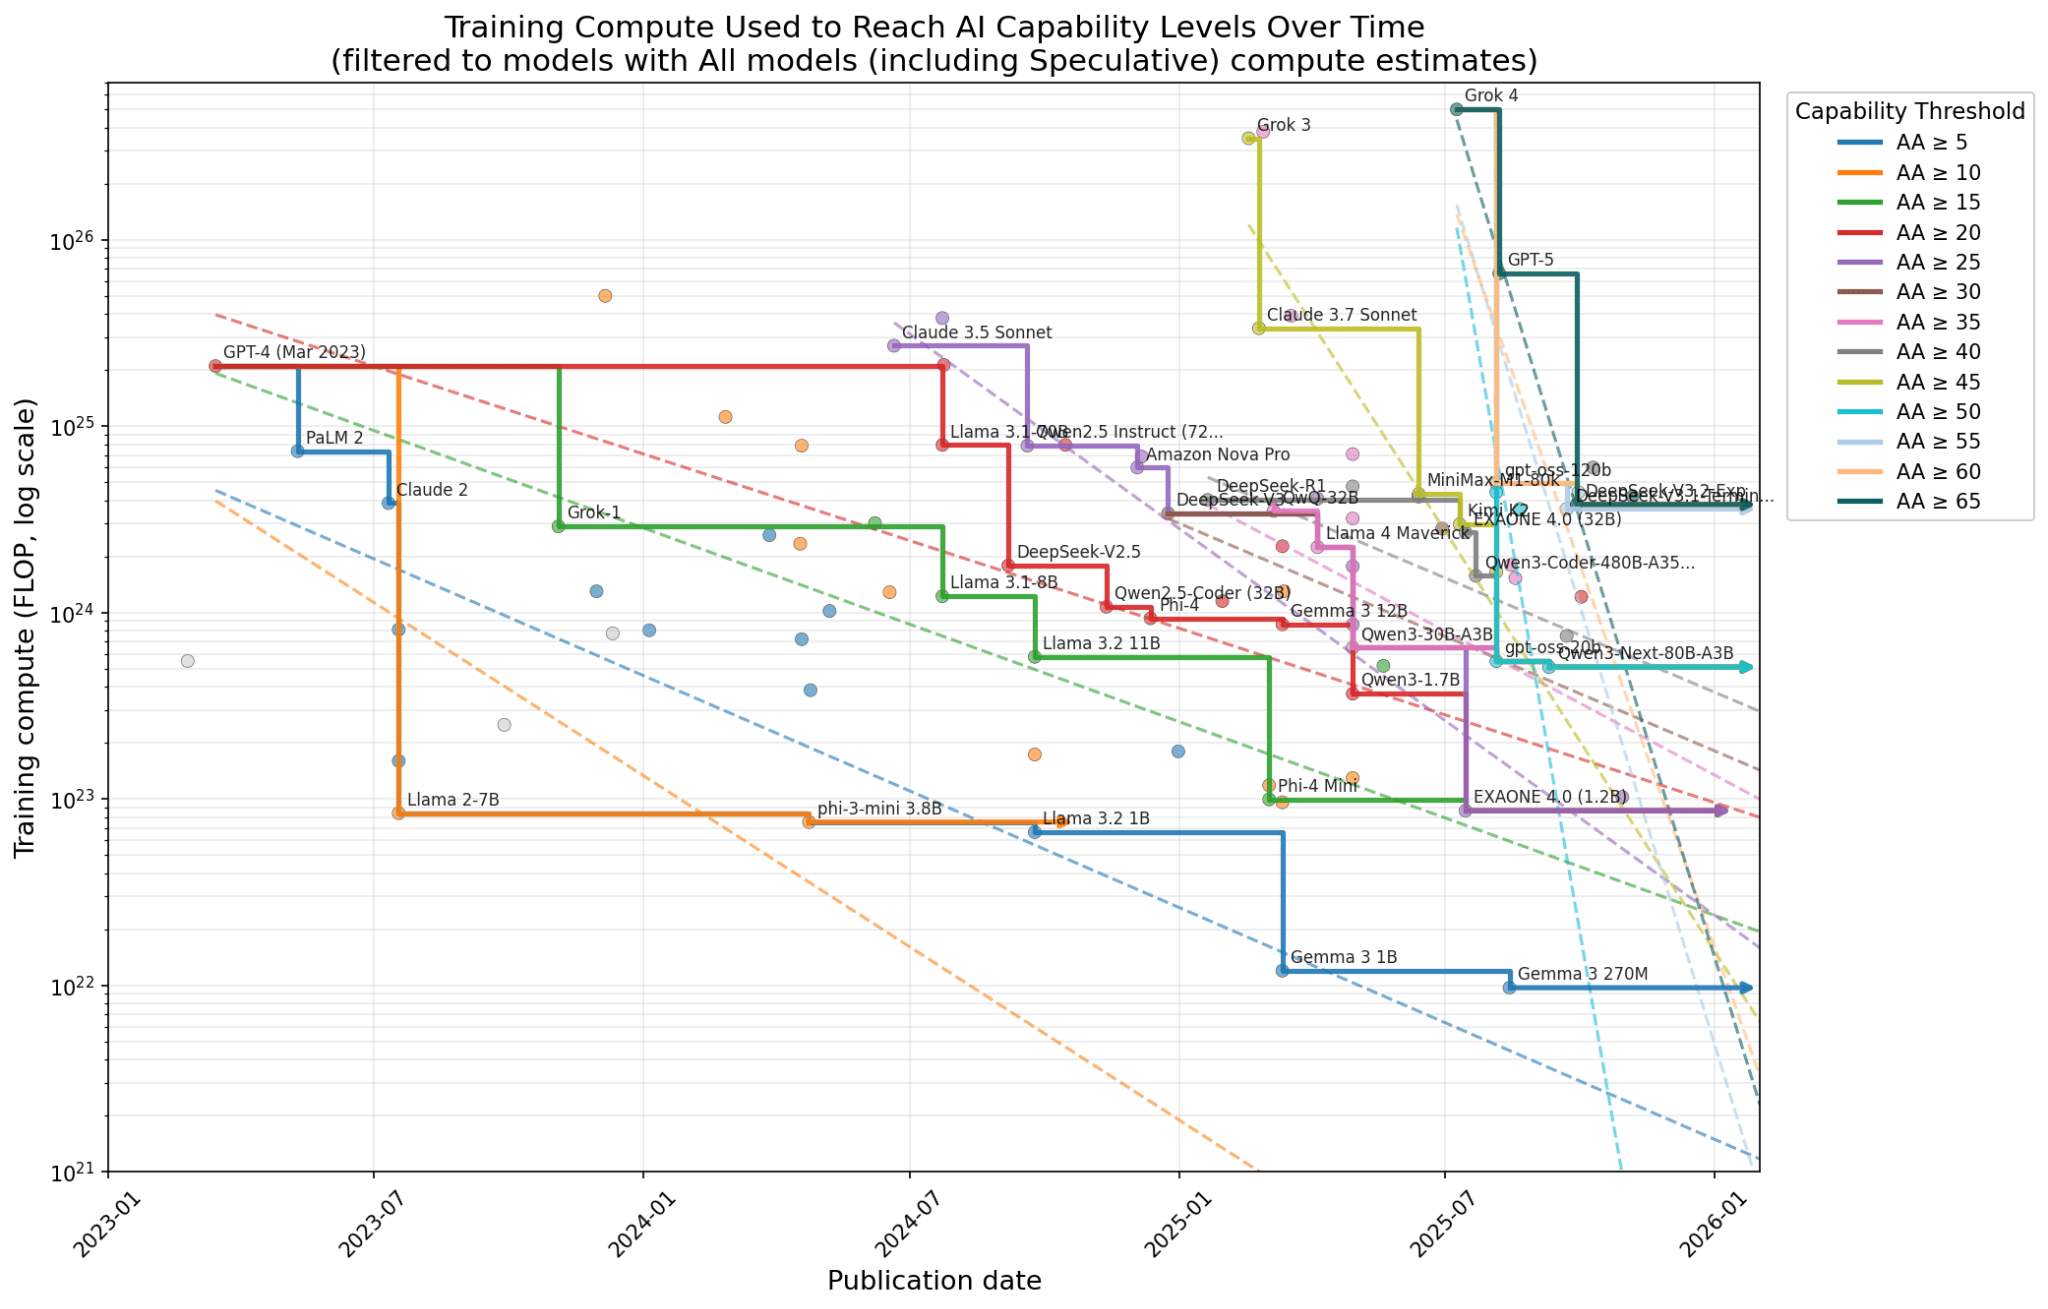
Results table
| Capability_threshold | slope_log10_yr | efficiency_factor_yr | multiplier_yr | subjective_weight | n_models | n_models_on_frontier | first_date | last_date |
5 | 1.242982673 | 17.49776877 | 0.05715014372 | 5 | 89 | 8 | 2023-03-15 | 2025-08-14 |
10 | 1.845247949 | 70.02416666 | 0.01428078402 | 5 | 75 | 3 | 2023-03-15 | 2024-04-23 |
15 | 1.038225438 | 10.9200704 | 0.09157450124 | 8 | 63 | 6 | 2023-03-15 | 2025-07-15 |
20 | 0.9343559857 | 8.597179326 | 0.1163172201 | 9 | 57 | 8 | 2023-03-15 | 2025-07-15 |
25 | 2.073184863 | 118.3545239 | 0.008449191184 | 9 | 45 | 7 | <td style=“border-color:#000000;padding:2pt;vertical-align:top”