From “Works on My Machine” to Production Ready: Your API Load Testing Blueprint
10 min read1 day ago
–
Press enter or click to view image in full size
Photo by Matthijs van Heerikhuize on Unsplash
In the world of modern software architecture, APIs are the critical pipelines that handle everything from user authentication to complex data processing and inference. If these pipelines buckle under pressure, the entire user experience collapses. This is where API resilience, specifically Load Testing, becomes a non-negotiable skill for any serious…
From “Works on My Machine” to Production Ready: Your API Load Testing Blueprint
10 min read1 day ago
–
Press enter or click to view image in full size
Photo by Matthijs van Heerikhuize on Unsplash
In the world of modern software architecture, APIs are the critical pipelines that handle everything from user authentication to complex data processing and inference. If these pipelines buckle under pressure, the entire user experience collapses. This is where API resilience, specifically Load Testing, becomes a non-negotiable skill for any serious API engineer.
API. Source
Functional Testing focuses on the core business logic. It answers the question: “Does the API perform the specific task it was designed for?” (e.g., Does the POST /user endpoint successfully create a user account?)
Non-Functional Testing focuses on operational aspects. It answers the question: “How well does the API perform that task under various conditions?” (e.g., How fast does the API create the user account? Can it create 1,000 accounts concurrently?)
Press enter or click to view image in full size
Functional vs Non-Functional Testing. Source
Load testing is categorized as non-functional testing because it evaluates attributes like performance, reliability, scalability, and efficiency, rather than checking for correctness of the output.
It is the process of simulating concurrent user traffic or requests to an API to determine its behavior and performance under various conditions.
The Primary Goal of load testing is straightforward: to validate that the API meets defined Service Level Agreements (SLAs) under expected peak load.
An SLA might state, for example, that the API must handle 5,000 requests per second (RPS) with a response time of less than 300 milliseconds 99% of the time. Load testing provides the empirical data required to certify that the service lives up to that promise.
Why load testing matters
In slide decks, traffic charts often look like smooth, friendly curves. In reality, production traffic looks more like a heart monitor: calm for a while, then sudden spikes when everyone hits your API at once.
Press enter or click to view image in full size
API Monitoring. Source
Most scaling issues only show themselves under concurrent load:
- A single request is fast, but 200 in parallel saturate your database connections.
- Your application can handle 20 RPS comfortably, but at 60 RPS, the p99 latency quietly explodes.
- A microservice that looks “cheap” at low volume suddenly becomes your main cost driver at scale.
Load testing is how you rehearse these scenarios intentionally, instead of discovering them for the first time during a real incident.
“Works on my machine” vs. “dies in production at 09:03”
Locally you:
- Hit the API a couple of times.
- See a 120 ms response.
- Declare it “fast enough.”
In production, 500 users log in at 9:00, dashboards refresh, background jobs start, and at 9:03:
- p99 latency jumps over your SLO.
- Health checks start failing.
- Your orchestrator restarts perfectly healthy pods that are simply overloaded.
Press enter or click to view image in full size
Works on my machine. Source
Core Concepts: The Language of Performance
Before you run your first load test, you need to understand what you’re actually measuring. These concepts are the vocabulary of performance engineering.
- Throughput
- Latency
- Concurrency vs. Request Rate
- Resource Utilization
- SLOs and SLAs
Throughput
Throughput is simply how many things per second your system is handling.
- RPS/QPS — requests per second / queries per second.
- Events per second — for streaming or message-driven systems.
- Messages per second — for queues, Kafka topics, etc. Throughput.
Raw RPS doesn’t tell the whole story for ML systems. You also need:
- Tokens per second: For LLMs, measures actual generation throughput
- Images per second: For vision models
- Inferences per second: Generic ML metric
- Batched throughput: How many items are processed per batch operation
Throughput tells you your system’s capacity ceiling.
If your product expects 5,000 daily active users, with each making 20 requests per day spread over 12 hours, you need:
5,000 users × 20 requests = 100,000 requests/day100,000 / (12 hours × 3,600 sec) = ~2.3 RPS average
But you’ll need 5–10× that for peak traffic, so target 12–23 RPS sustained throughput with headroom.
Latency
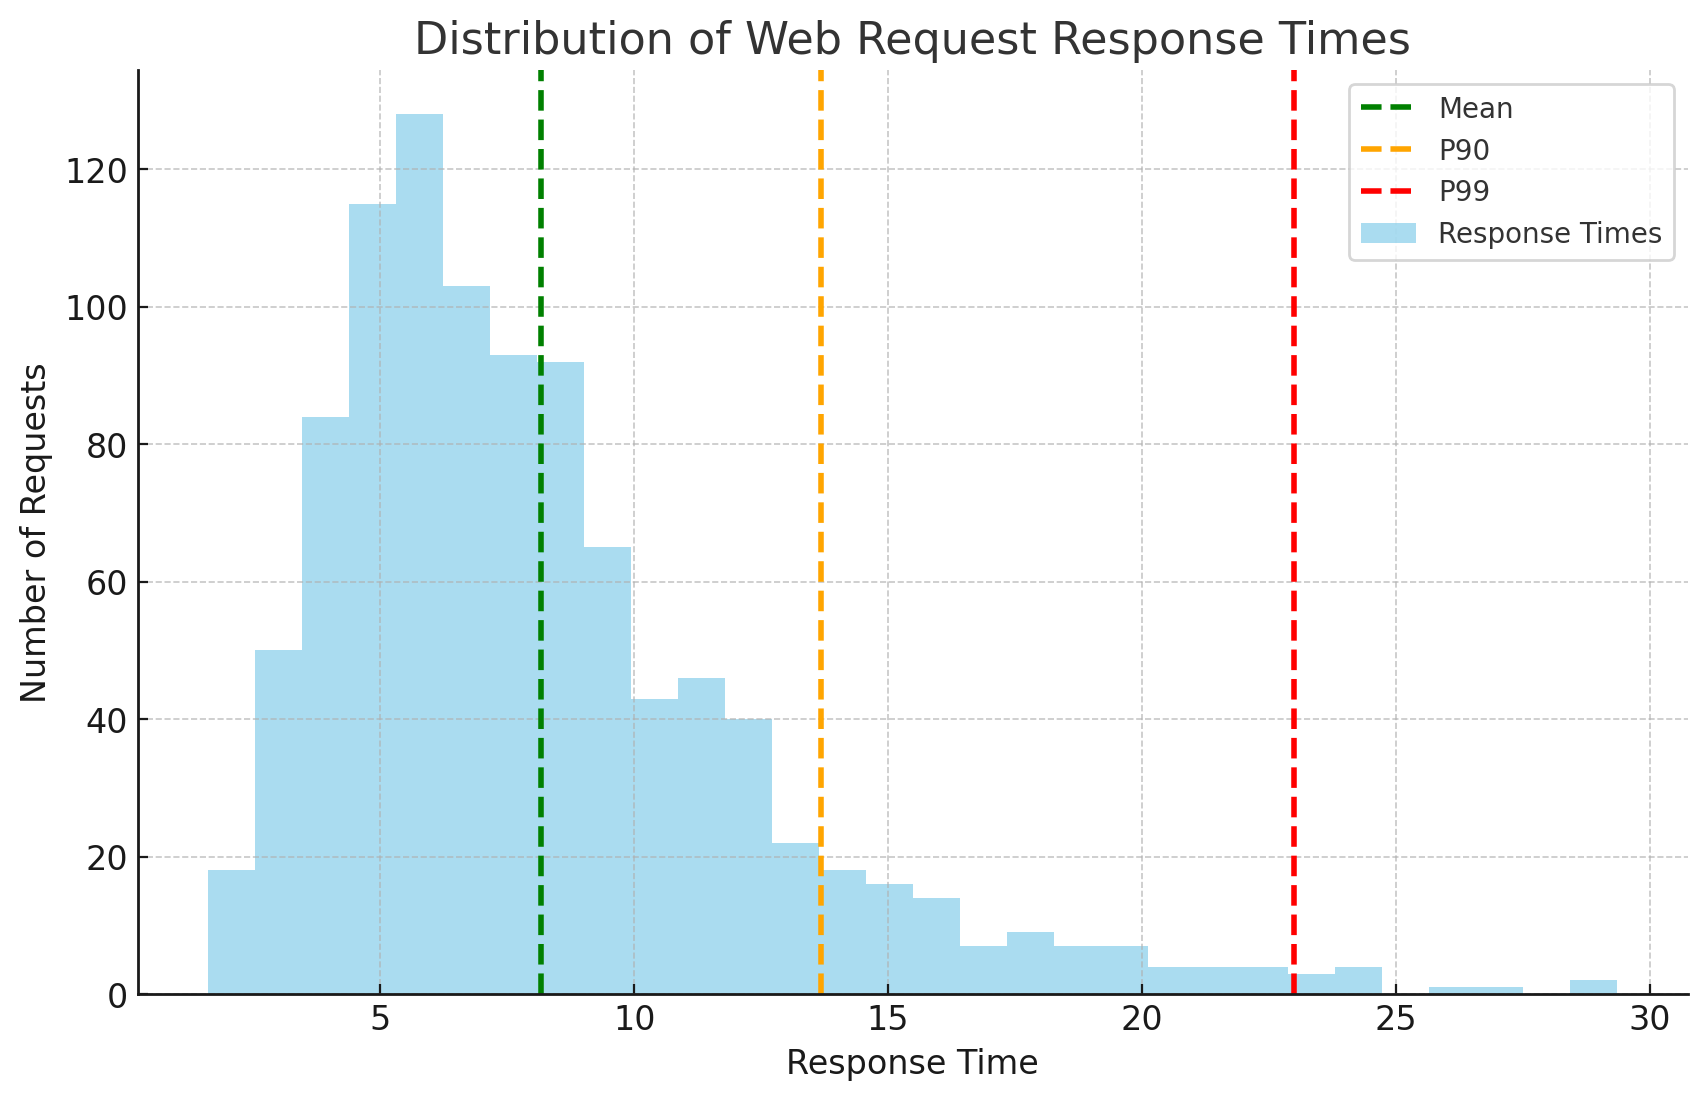
Latency is the time from when a request arrives until the response is complete. But here’s the critical insight: never trust average latency.
Press enter or click to view image in full size
Distribution of Web Request Response Times. Source
Imagine two scenarios, both with 100ms average latency:
Scenario A: All requests take exactly 100ms
Scenario B: 95% take 10ms, 5% take 1,810ms
Same average, wildly different user experience. That’s why we use percentiles.
- p50 (median): 50% of requests are faster than this. Shows “typical” experience
- p95: 95% of requests are faster. 1 in 20 requests is slower
- p99: 99% of requests are faster. 1 in 100 requests is slower
- p99.9: 1 in 1,000 requests is slower
p50: 120ms ← Half your users see this or betterp95: 340ms ← Your "good" experience boundaryp99: 890ms ← Starting to feel slowp99.9: 2.1s ← Unacceptable, but "only" 0.1% of requests
If you serve 1 million requests/day, that p99.9 represents 1,000 frustrated users. Not so rare anymore.
Tail latency refers to those high percentiles (p95 and above).
Press enter or click to view image in full size
Tail latency. Source
In ML systems, common causes include:
- Cold starts: First request after model loads
- Garbage collection pauses: JVM/Python GC freezes
- Batch boundary effects: Last item in a batch waits for the whole batch
- GPU context switching: Switching between models
- Network retries: Failed requests that succeed on retry
Concurrency vs. Request Rate
These terms measure fundamentally different things:
Concurrency — how many requests are in flight at the same time.
Request rate (throughput) — how many requests you complete per unit time.
Press enter or click to view image in full size
Throughput vs Concurrency. Source
- You can have high concurrency, low RPS — e.g., 200 long-running streaming responses.
- Or low concurrency, high RPS — e.g., 10 clients firing short requests very quickly.
Resource Utilization
Throughput and latency tell you that something’s wrong. Resource utilization tells you where.
The usual suspects:
- CPU — pegged at 90–100% → heavy computation, inefficient code, serialization overhead, encryption, compression, etc.
- Memory — high usage or leaks → large in-memory caches, big responses, buffering, poor object lifetime management.
- Network — bandwidth saturated or high retransmits → large payloads, slow clients, noisy neighbors.
- Disk I/O — slow reads/writes → logging too much, synchronous disk access, non-indexed queries spilling to disk.
- GPU load (for ML) — high GPU utilization or out-of-memory errors → too many concurrent inferences, oversized batch sizes, multiple models sharing a single GPU.
Press enter or click to view image in full size
API monitoring. Source
A good load test always pairs external metrics (RPS, latency, errors) with internal resource metrics so you can say things like:
“At 170 RPS, CPU is ~70%, DB is fine, but GPU hits 95% and p99 jumps from 250ms to 800ms.”
Now you have something you can actually fix.
SLOs and SLAs
All the above metrics need context. You tie them to targets.
Press enter or click to view image in full size
SLA — SLO — SLI. Source
SLA (Service Level Agreement): External commitment to customers, often with financial penalties if missed.
Example:
- Free tier: 95% uptime, p95 < 1s, no guarantees
- Standard tier: 99.5% uptime, p95 < 500ms, 10% monthly credit if breached
- Enterprise tier: 99.95% uptime, p99 < 300ms, 25% credit + prioritized support
SLO (Service Level Objective): Internal target your team commits to. It’s your engineering goal.
Examples:
- “99% of inference requests complete in under 300ms at 200 RPS”
- “95% of batch jobs process within 5 minutes with up to 10,000 items”
- “p99 latency stays under 500ms during peak traffic (500 RPS)”
**SLI (Service Level Indicators): **Quantitative data points that indicate the service’s health.
Load testing, in practice, is about comparing reality against these SLOs.
After running a load test, evaluate your results:
Example.
Types of Load Tests
In practice, performance engineers use a spectrum of specialized tests, each designed to answer a different question about system resilience.
- Smoke / Sanity
- Baseline / Capacity Test
- Stress Test
Smoke / Sanity Load Test
Can we even run this test safely?
A quick, low-impact test run to validate that the entire testing setup — the environment, configuration, load generation scripts, and monitoring — is working correctly.
Press enter or click to view image in full size
Smoke vs Sanity. Source
You look for:
- All endpoints return 200s (or expected status codes)
- No authentication/authorization errors
- Response payloads are well-formed
- Basic latency is reasonable (not timing out)
- Any 500 errors, connection refused, DNS failures
Think of this as a “hello world” for your load test setup. If this fails, you fix your test harness or environment before you even talk about performance numbers.
When to run it:
- Before every major load test
- After deployment
- During test development
Baseline / Capacity Test
What can we handle comfortably before we start to hurt?
To gradually ramp up traffic to find the “sweet spot” — the point of maximum stable throughput before latency begins to sharply increase. This is the classic “load test.”
A gradual ramp-up in traffic:
- Start at a safe RPS (e.g., 20 RPS), then increase step by step (50 → 100 → 150 → …).
- Hold each level long enough to reach a steady state.
Users ^ | ╱──────────── Plateau (observe steady state) | ╱ | ╱ | ╱ Ramp (5-10 min) | ╱ |____╱ └────────────────────────> Time
Start low, increase gradually, hold at target to observe stability.
What you’re measuring:
- Maximum stable throughput: Highest RPS where latency stays within SLO
- Saturation point: When adding more load stops increasing throughput
- Resource utilization patterns: Which resources hit limits first
- Baseline latency distribution: Your p50/p95/p99 under normal load
Load: 50 users → 120 RPS, p95=280ms ✓ HealthyLoad: 100 users → 180 RPS, p95=320ms ⚠️ Approaching limitsLoad: 150 users → 185 RPS, p95=850ms ✗ Saturated (not processing more, latency spiking)
When to run:
- Initial capacity planning: “How much traffic can we handle?”
- After optimization work: “Did our changes improve throughput?”
- Before production launch: “Are we ready for the expected load?”
- Quarterly/monthly: Track performance drift over time
Stress Test
How does it break when we push it too far?
Stress tests are not about comfort; they’re about failure behavior.
Press enter or click to view image in full size
Different types of stress testing. Source
You intentionally push the system beyond normal or expected traffic.
The breaking point:
- At what traffic level does the system become unstable?
The failure mode:
- Does latency degrade gradually or suddenly?
- Do services fail with clear, controlled errors or chaotic timeouts?
- Does autoscaling help or make things worse (e.g., thrashing)?
Recovery behavior:
- When you drop the load back to normal, does the system recover on its own?
- Do you need manual intervention (restarts, cache clears, DB fixes)?
A good system doesn’t just perform well; it fails gracefully.
Stress tests show whether your system dies quietly or takes half the company down with it.
Spike Test
What happens if traffic jumps from 0 to 100 right now?
Real traffic is often spiky.
Press enter or click to view image in full size
Load testing — Stress testing — Spike testing. Source
Sudden, sharp increases in load:
- 20 RPS → 200 RPS in a few seconds.
- Drop back down, then spike again.
Autoscaling responsiveness:
- Does your infrastructure spin up new instances fast enough?
- Or do users live in slow p99 hell for minutes?
Startup and warm-up costs:
- Are new pods/containers slow because they’re loading big models/configs?
- Do cold starts stack up and create a queue?
Stability of shared components:
- DBs, caches, queues — do they handle bursts or choke?
Spike tests model “flash events” like flash sales, trending social posts, or scheduled jobs, hitting all at once.
If you never test spikes, your first real one will almost certainly be an incident.
Soak / Endurance Test
Can it keep running like this for hours without silently degrading?
Press enter or click to view image in full size
Load testing — Stress testing — Spike testing — Soak testing. Source
Some problems only show up with time, not with peak RPS.
A long-running test (often several hours, sometimes overnight) at a realistic, steady load.
Memory leaks or gradual growth:
- Memory usage is creeping upwards.
- Connection counts are increasing and never going down.
Resource exhaustion:
- File descriptors, DB connections, thread pools, and GPU memory.
Slow degradation:
- Latency is slowly increasing over time, even though RPS is constant.
- Error rates start near 0% and slowly climb.
Background tasks and rotations:
- Log rotation, backup jobs, and cron tasks run at certain times.
- Daily batch jobs overlap with API traffic.
A soak test answers the question: “If we ran this system under normal weekday load for 8 hours, would it still be healthy at the end, or will it be a slow-motion disaster?”