There’s a comfortable illusion in workflow diagrams. Steps in boxes, arrows between them, swimlanes color-coded by role—it looks like precision. Your org chart maps to process maps; process maps compile into tickets. On paper, it’s clockwork.
The org you actually run has detours, delays, and the occasional bus bridge. A squall rolls in; an inbound steals your platform; the diagram buckles. Dispatch scrambles. Real rail networks plan for these squalls because they’re not edge cases—they’re the weather. External disturbances routinely upend published timetables and force wholesale rescheduling to restore flow.
The timetable is useful until the weather shifts. After that, your map lies.
Workflows assume yesterday’s weather. Your business runs on storms.
We’ve repainted th…
There’s a comfortable illusion in workflow diagrams. Steps in boxes, arrows between them, swimlanes color-coded by role—it looks like precision. Your org chart maps to process maps; process maps compile into tickets. On paper, it’s clockwork.
The org you actually run has detours, delays, and the occasional bus bridge. A squall rolls in; an inbound steals your platform; the diagram buckles. Dispatch scrambles. Real rail networks plan for these squalls because they’re not edge cases—they’re the weather. External disturbances routinely upend published timetables and force wholesale rescheduling to restore flow.
The timetable is useful until the weather shifts. After that, your map lies.
Workflows assume yesterday’s weather. Your business runs on storms.
We’ve repainted the same idea for forty years. In the 1990s–2000s, you diagrammed steps and called it Business Process Re-engineering/Business Process Management (BPR/BPM). In the 2010s, you scripted those steps faster and called it Robotic Process Automation (RPA). In the 2020s, you put a model at the gateway and called it “AI in workflows.” Across waves, the pattern barely changes: shiny pilots; rollouts that stall. The BPM canon itself warns that outcomes hinge on fit between process and environment—precisely where programs collapse in volatile settings. RPA’s early promises met similar reality: Ernest & Young (EY) documented that 30–50% of first RPA projects fail to meet objectives, less about the tool, more about context and misunderstanding.
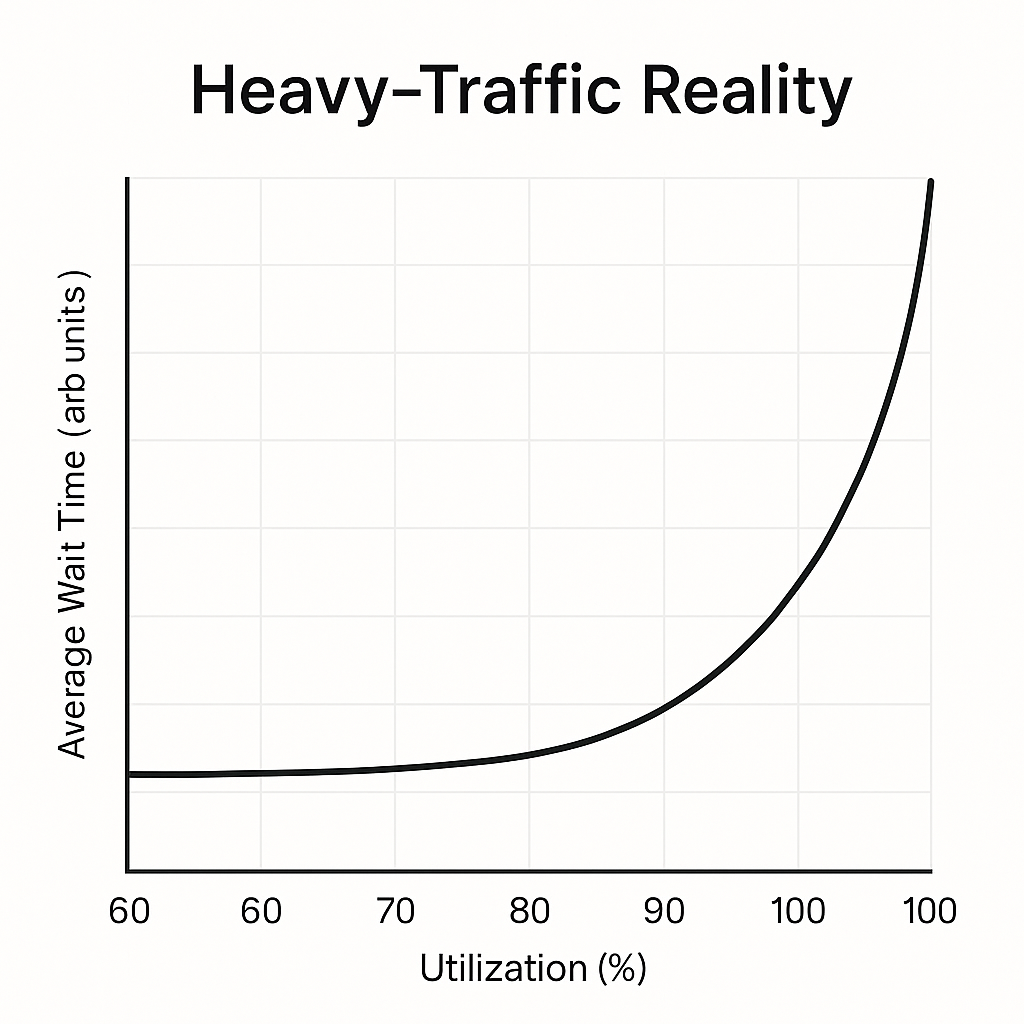
Why does the stall repeat? Because a step-by-step container can’t absorb variance. Push your utilization toward “full” and queues tip into heavy traffic: tiny shocks become long waits; work-in-process hides; buffers vanish; cycle time spikes. That’s the non-linear behavior Kingman formalized and operations teams still validate—Little’s Law linking work in progress (WIP) and cycle time makes the math unambiguous.
So trade the rails for your business. The diagram on your wall assumes stable steps and full information; the platform you stand on runs partial observability and surprise. If your control surface is a fixed sequence of handoffs, you’ll get the operational equivalent of stranded rolling stock: exception queues, ad-hoc diversions, dispatch by Slack. The schedule says “on time.” Your network disagrees. The remedy won’t be a prettier timetable; it starts by admitting you’re operating in weather, not a lab.
The world the diagram assumes—and the one you operate in
Your workflow diagram presumes a tame environment: a single correct route, uniform cases, complete and timely information, and change that waits its turn. Your operating reality is the inverse: conditions flip without notice; several routes can work and the best one depends on context; cases differ in ways that matter; information arrives late or conflicted; change is the default. The BPM literature keeps finding that fit between process and environment outweighs elegance of design in volatile domains. Map doesn’t match terrain.
What is an indeterministic business environment?
An indeterministic business environment is one where conditions change unpredictably, information is partial or delayed, multiple valid paths exist depending on context, and exceptions are routine rather than rare. Unlike deterministic workflows that assume stable, predictable processes, indeterministic environments require systems that can adapt, replan, and absorb variance without breaking.
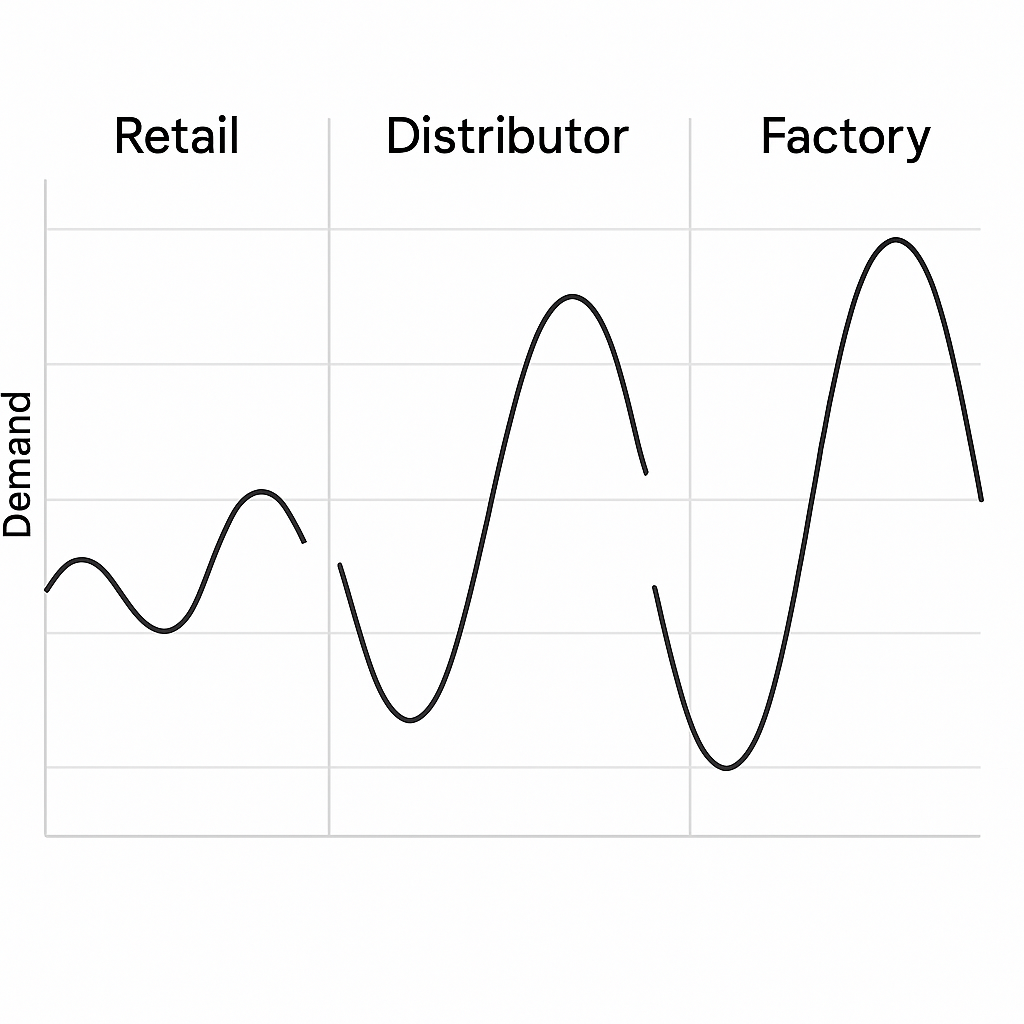
Variance also amplifies as it moves. Supply chains call this the bullwhip effect: tiny demand wiggles at the edge become whip-cracks deep in the network, triggering over-ordering, shortages, and costly corrections. Inside your enterprise, the same dynamic turns a “rare” exception at one node into normal traffic two hops away. Your diagram didn’t change; the distribution did.
When the official path can’t absorb that spread, your people route around it. Shadow systems appear—private trackers, side channels, unsanctioned tools—not because teams are unruly but because your sanctioned route doesn’t fit the work. Recent reports show “shadow IT/AI” is mainstream precisely under these conditions. The signal isn’t non-compliance; it’s misfit.
Finally, much of your real work happens under uncertainty and partial information. If your control surface assumes full visibility, a brittle step chain will collapse at the first missing field or late signal. Designing for uncertainty is table stakes; assuming it away produces the same outcomes every time: brittle execution, exception inflation, and workarounds that harden into the real system.
Five predictable breakdowns
1) Small change, big break
A single field gets added to a form. A vendor bumps an API minor version. Legal nudges a policy. The “happy path” snaps and your day turns into triage. This is the nature of brittle, step-bound systems: they couple to surfaces that change faster than your diagram. You see it most vividly in RPA—bots that bind to a screen or DOM and fail when a label moves or a column appears. EY warned years ago that most of initial RPA projects miss objectives, with brittleness and misunderstanding as prime culprits; practitioners still document how minor interface changes topple entire runs. The outcome isn’t surprising. It’s physics for fragile glue.
2) Exceptions inflate
You model “rare” exceptions. Reality promotes them to the main distribution. What began as a trickle ends up the highway, and your “standard path” becomes the shoulder. Two forces push in the same direction. First, workflow research has long treated exceptions as endemic, not incidental, because real work deviates in ways you can’t fully anticipate up front. Second, variance amplifies as it moves through networks—the bullwhip effect—so small wiggles at the edge become whip-cracks two hops downstream. Result: your exception queue metastasizes into dominant flow.
Take a concrete example: a mid-size SaaS company launches an invoice processing workflow with a “manual review” exception path for amounts over $50K or missing purchase orders. Month one, 8% of invoices hit the exception queue—within tolerance. Month three, suppliers learn that exceptions get faster attention, so they start submitting earlier with incomplete data. Finance adds a new approval tier for international vendors. The $50K threshold catches more cases as contract sizes grow. By month six, 43% of invoices route through “manual review,” your finance team is underwater, and your AP cycle time has doubled. The workflow didn’t break—the distribution shifted underneath it.
3) Context evaporates
Your binary gateways compress judgment into yes/no at exactly the moments you need “it depends.” Information is late or partial; the right call requires inference, not a branch label. Decision science is unambiguous here: in dynamic, uncertain environments, your people lean on heuristics and experience to adapt; forcing those judgments through fixed gateways removes nuance, increases ping-pong between states, and inflates latency. Your lead time doesn’t suffer because people are slow—it suffers because the structure throws away context and then spends cycles trying to recover it.
4) Workarounds harden
When your sanctioned route can’t absorb variance, your people route around it—hot lists, private trackers, quiet backchannels. At first it’s a relief valve. Over time it becomes the real system. We used to call this shadow IT; in 2025 the same behavior shows up as shadow AI. Surveys from large vendors show the pattern at scale—strong majorities of employees use unsanctioned tools because your official stack doesn’t fit the job. That isn’t rebellion; it’s an adaptation signal telling you the map no longer matches your terrain.
5) Firefighting wins (and then loses)
Under pressure, your teams trade prevention for throughput. It “works” in the short run—queues shrink, stakeholders applaud—and then capability erodes, defects rise, and tomorrow’s fires multiply. Repenning and Sterman labeled this the capability trap decades ago: urgency crowds out improvement; your system becomes tuned to emergencies; you attribute the next crisis to “people” and double down on the same choices that created the spiral. You don’t need new heroes; you need a structure that doesn’t manufacture fires.
Why these five recur: a fixed, deterministic script collides with variance, partial observability, and evolving surfaces. The math punishes you in heavy traffic; the network amplifies small wiggles into big swings; human judgment gets flattened into gateways; adaptation migrates to shadows; and the urgent cannibalizes the important. Change the script, and they come back. Change the primitive, and they stop repeating.
There’s a bill you pay for keeping work in a step chain, and it keeps arriving no matter how green your status lights look.
Maintenance treadmill. Your scripts, rules, and bots chase moving targets—UI tweaks, API bumps, policy nudges, org reshuffles. This is why so many early RPA programs miss their ROI: brittleness and misunderstanding create a break-fix loop rather than durable automation.
Exception overhead. When “rare” paths become the highway, escalation becomes your real critical path. Latency piles up where your humans must decide and systems must re-route; in complex distributed stacks, the end-to-end wait time is dominated by the slowest blocking segment—the critical path—rather than average step times. Your average looks fine. Your reality grinds.
Measurement theater. If you optimize to make the dashboard happy, you’ll often get prettier dashboards—not better outcomes. That’s Goodhart’s Law in action: once a measure becomes a target, its usefulness as a measure collapses. In your practice, “throughput up” can coexist with flat or degraded results when the metric is being gamed or simply isn’t the result you need.
Shadow systems. When your sanctioned route can’t absorb variance, work moves. Private trackers, side channels, unsanctioned tools—and now “shadow AI”—become the de facto system of record. Multiple sources put shadow tooling at startling levels: Cisco-cited figures around 80% adoption; recent Microsoft data shows 71% of UK workers using unauthorized AI tools. That signals misfit more than misbehavior. Your governance and data quality degrade; so does trust.
Add it up and the “glow” is an illusion: fixes consume your capacity, escalations dominate cycle time, metrics detach from value, and your real process leaks into tools you don’t control. That’s not a people problem. It’s the predictable tax of forcing indeterministic work through deterministic maps.
Why “AI inside workflows” inherits the same failures
Dropping a probabilistic model into a brittle step chain does one thing reliably: it speeds up brittle moves.
The container mismatch remains. The model can answer a local question, but the route around it still can’t bend. That’s why so many “AI-enhanced” flows light up demos and stall at scale: your surrounding system measures step completion, not business movement. Multiple write-ups of MIT’s 2025 NANDA work converged on the same headline—roughly 95% of enterprise GenAI initiatives showed no measurable P&L impact—pinning the shortfall on weak integration and misplaced use, not on model IQ. Your container is still wrong.
There’s also a method fit problem. Your deterministic checks want code—fast, testable, cheap. LLMs are probabilistic reasoners with non-trivial latency and cost per decision. Even as prices fall, inference still trades off speed and dollars token-by-token; vendors and researchers quantify that economics explicitly. Put differently: using an LLM where an if belongs adds cost and delay exactly where you don’t want them.
And then there’s planning. Many of your workflow gates implicitly require dependable multi-step reasoning under constraints. Current surveys and benchmarks are clear: LLMs can plan in narrow setups, but struggle as tasks require long-horizon consistency, precise resource accounting, and strict constraint compliance—the everyday realities of your enterprise processes. So when you embed an LLM as a gateway, it inherits the chain’s brittleness and adds its own variance at the very point you expected certainty.
Put it together and the pattern makes sense. Local accelerations don’t guarantee outcomes; probabilistic judgment inside a rigid path compounds latency and cost; and long-horizon reliability is still an open research frontier. Smarter gates don’t fix the wrong container.
Seven signals the workflow is the constraint
You don’t need a survey; you need a mirror. If three or more of these are true, your script—not your team—is the bottleneck.
Overrides are normal. North of 10–15% of your runs need manual nudges or policy breaks. That isn’t “non-compliance”; it’s your system confessing the map no longer matches the terrain. BPM research has warned for years that success hinges on process–environment fit—precisely where rigid flows crack in volatile contexts.
Exceptions outpace demand. The “edge case” becomes the distribution. Your exception queues turn into the highway while the “standard path” becomes the shoulder—consistently observed in workflow literature and exception-handling studies.
Private trackers rule. Your teams keep side sheets and backchannels because “the system is never quite right.” In 2025 this shows up as shadow tooling and shadow AI at scale—Microsoft reports 71% of employees using unapproved AI tools, often weekly, precisely because your sanctioned paths don’t fit the work.
Fix backlog is chronic. A quarter of your team capacity disappears into patching rules, screens, and bots.
Escalation wait is the story. Your lead time is dominated by human escalations and exception routing, not the automated bits—classic critical-path behavior in heterogeneous stacks. Average step time is irrelevant if your blocking segment is slow.
Outcomes flatline while activity soars. Your dashboards glow; the business line doesn’t move. That’s the tell of a measurement surface tuned to step throughput rather than goal movement—one reason “AI-enhanced” flows can impress in demos yet show limited P&L signal at your scale.
Pilots sparkle; scale fizzles. It works somewhere, then buckles everywhere. That “pilot purgatory” shape is exactly what you’d expect when your design assumes stability and encounters variance; the broader BPM/automation literature has been circling this failure mode for a decade.
If this sounds familiar, believe the mirror. These aren’t “people problems.” They’re the predictable symptoms of forcing indeterministic work through deterministic maps.
Why this keeps happening (and will keep happening until you change the primitive)
Two findings are worth keeping on your desk.
First, fit beats elegance. BPM succeeds when your process and your environment match; in volatile, high-variance domains, pre-specifying the route is a category error, not a tooling gap. Trkman’s canonical review grounds BPM in contingency and task–technology fit: outcomes hinge primarily on alignment between your business context and process design, not on the beauty of your diagram.
Second, pressure bends systems. Introduce new tools without slack or structural change and you amplify firefighting. Repenning and Sterman’s work shows how urgent work crowds out improvement until capability erodes—the classic “capability trap.” New methods—TQM, lean, CAD, “AI in the flow”—layered onto your overloaded teams raise utilization, push the system past its tipping point, and generate more fires, not fewer.
Or, to borrow the line everyone quotes: “Insanity is doing the same thing over and over again and expecting different results.” It isn’t Einstein—the best-documented trail traces to early-1980s recovery literature and Rita Mae Brown’s 1983 novel Sudden Death. Use the punchline, just don’t misattribute it.
Bottom line: as long as you keep a deterministic script in a nondeterministic world, you’ll recreate the same loop—misfit, firefighting, decay—no matter how modern your tooling looks. Changing vendors won’t change the physics; changing the primitive will.
The Pivot
If conditions won’t hold still, step-by-step control can’t be your anchor. Replace “follow these steps” with “hit this target without breaching safety.” We’ll define the primitive later—name it here, don’t explain it.
References
- MIT NANDA (2025) - The GenAI Divide: State of AI in Business 2025 - Analysis showing ~95% of enterprise GenAI initiatives with no measurable P&L impact
- EY (Ernst & Young) - Five design principles to help build confidence in RPA implementations - Research documenting 30-50% of initial RPA projects fail to meet objectives due to brittleness and misunderstanding
- Kingman, J.F.C. (1961) - Kingman’s formula (VUT relation) - Queueing theory demonstrating relationship between Variability, Utilization, and Time
- Little, J.D.C. - Little’s Law - Fundamental relationship linking Work-in-Process (WIP), throughput, and cycle time
- Forrester, J.W. (1961) / Lee, H.L. et al. (1997) - Bullwhip effect - Variance amplification phenomenon in supply chains and enterprise systems
- Trkman, P. (2010) - The critical success factors of business process management - International Journal of Information Management, 30(2), 125-134
- Repenning, N.P. & Sterman, J.D. (2002) - Capability traps and self-confirming attribution errors in the dynamics of process improvement - Administrative Science Quarterly, 47: 265-295
- Repenning, N.P. & Kieffer, D.C. (2024) - There’s Got to Be a Better Way: How to Deliver Results and Get Rid of the Stuff That Gets in the Way of Real Work - Dynamic work design principles for operational excellence
- Goodhart, C. - Goodhart’s Law: “When a measure becomes a target, it ceases to be a good measure”
- Meadows, D.H. (2008) - Thinking in Systems: A Primer - Framework for leverage points in complex systems, with goals as high-leverage intervention
- Cisco (2016) - The Shadow IT Dilemma - Research finding ~80% of employees using unauthorized cloud applications
- Microsoft (2024-2025) - Work Trend Index: 71% of workers using unapproved AI tools
- Kahneman, D. & Klein, G. (2009) - Conditions for intuitive expertise: A failure to disagree - American Psychologist, 64: 515-526
- NIST (2023) - AI Risk Management Framework (AI RMF 1.0) - Official framework for trustworthy AI governance
- Doerr, J. (2018) - Measure What Matters - OKRs (Objectives and Key Results) methodology for outcome-based goal-setting
- Critical path method (CPM) - Project management literature documenting that end-to-end latency is dominated by slowest blocking segment
- Brown, Rita Mae (1983) - “Sudden Death” - Novel containing “insanity” quote commonly misattributed to Einstein
Next in this series: Mechanical Sympathy for Business—why modern systems need to be designed with the physics of indeterministic environments, not against them, and the principles of adaptive enterprise architecture that make variance an asset instead of a liability.