04 Nov 2025 • 8 min read
 Oodle Logo
Production is down! You open your laptop and start the familiar dance:
An API timeout? Check metrics for the spike, switch to logs for the error, open traces for the slow dependency — three tools, three contexts, one incident. and after all this, pray 🙏
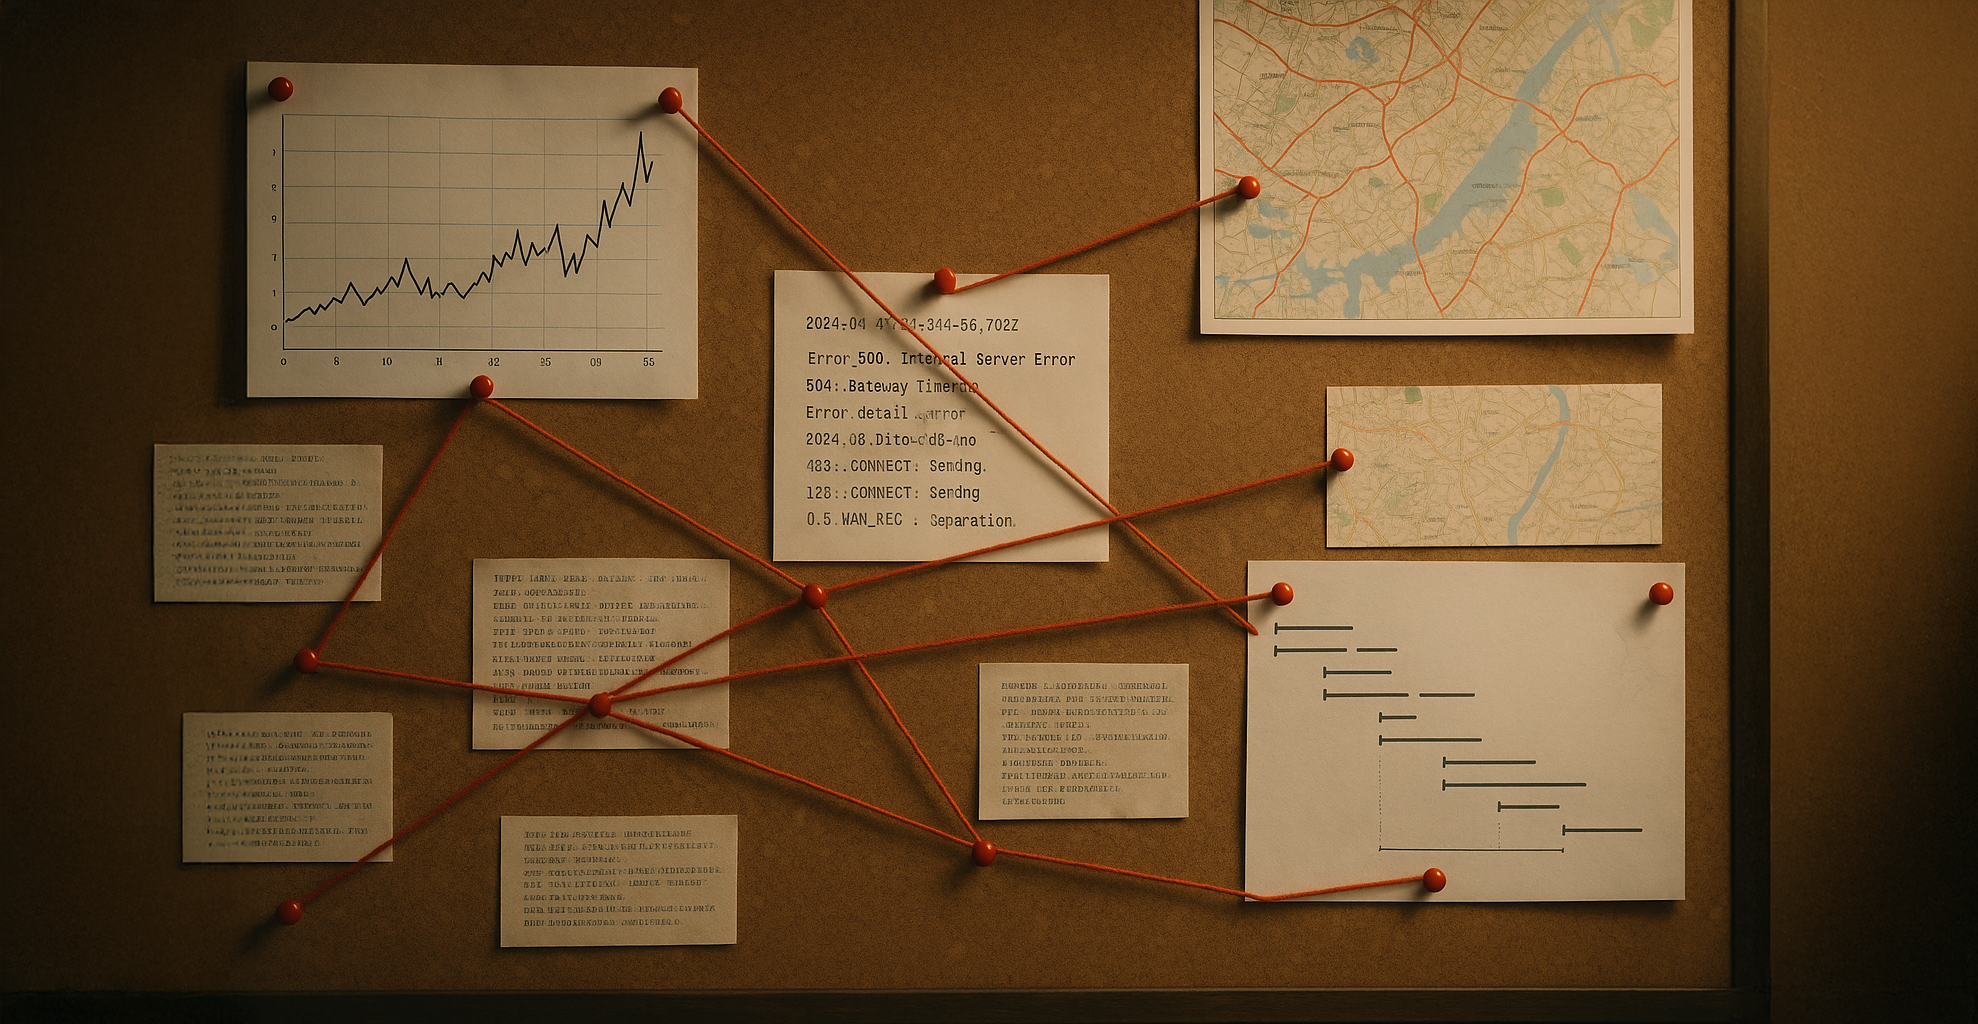
Fragmented Debugging: 3 Tools, 10 Dashboards, One Exhausted Engineer
This isn’t a workflow. It’s whack-a-mole with browser tabs.
The truth is, alert debugging today is broken. It’s fragmented across tools, dashboards, and tribal knowledge. Even when you can afford premium observabi…
04 Nov 2025 • 8 min read
Oodle Logo
Production is down! You open your laptop and start the familiar dance:
An API timeout? Check metrics for the spike, switch to logs for the error, open traces for the slow dependency — three tools, three contexts, one incident. and after all this, pray 🙏
Fragmented Debugging: 3 Tools, 10 Dashboards, One Exhausted Engineer
This isn’t a workflow. It’s whack-a-mole with browser tabs.
The truth is, alert debugging today is broken. It’s fragmented across tools, dashboards, and tribal knowledge. Even when you can afford premium observability tools, debugging an incident means:
- Jumping between separate tools for metrics, logs, and traces
- Manually correlating data across different time ranges and formats
- Hunting through hundreds of services to find the problematic one
- Copy-pasting timestamps, trace IDs, and service names back and forth
- Relying on tribal knowledge requiring senior engineers to jump quite often.
One incident. Three tools. Three contexts. One exhausted engineer burning through error budgets while fighting the tooling instead of the problem.
Where’s the AI When You Need It?
Here’s the irony: We’ve accepted that AI can build entire features or application. Yet when production breaks, we’re still manually correlating metrics, grepping through logs, and squinting at trace waterfalls like it’s 2015.
You can’t ask your observability system a simple question - “Why is checkout latency spiking?” - and have it reason through the data for you.
Instead, only the most experienced engineers can connect the dots. Junior engineers are left staring at charts, guessing, losing hours trying to find the needle in the haystack. Why can’t AI debug? Or at least suggest the possible root cause?
The problem isn’t the data - you’re collecting more telemetry than ever. The problem is that your observability tools weren’t built for the AI era.
Meet Oodle: Unified and AI-Native Observability
Oodle reimagines observability from first principles - both in architecture and experience.
At its foundation is a serverless architecture that separates storage and compute, giving you enterprise-grade observability at the cost of open-source solutions. On top of this foundation sits a unified, AI-native interface that brings together metrics, logs, and traces in one place.
You can ask Oodle questions in plain English - “Which service caused this alert?” Oodle’s AI assistant analyzes metrics, logs, and traces from relevant services, stitches together all signals, and filters them down to the relevant context for your alert. It combines the best of Grafana and OpenSearch across all signals, made possible by our unique architecture.
In this blog post, we’ll use the OpenTelemetry Demo application to show you how easy it is to debug incidents with Oodle across a distributed system - and how the AI does the work just like an experienced SRE would.
Try It Yourself: Setup in Under 5 Minutes
The OpenTelemetry (OTel) demo consists of several interconnected microservices written in multiple languages that simulate an online shopping experience. It can be run in your Kubernetes cluster (or in minikube) or as a Docker Compose application.
Note: We have installed it in our playground cluster if you want to explore it without installing it yourself. If so, You can skip directly to the Your AI Alert Command Center section.
You can install it in your environment by following the steps below:
- Sign up for a free account with Oodle.
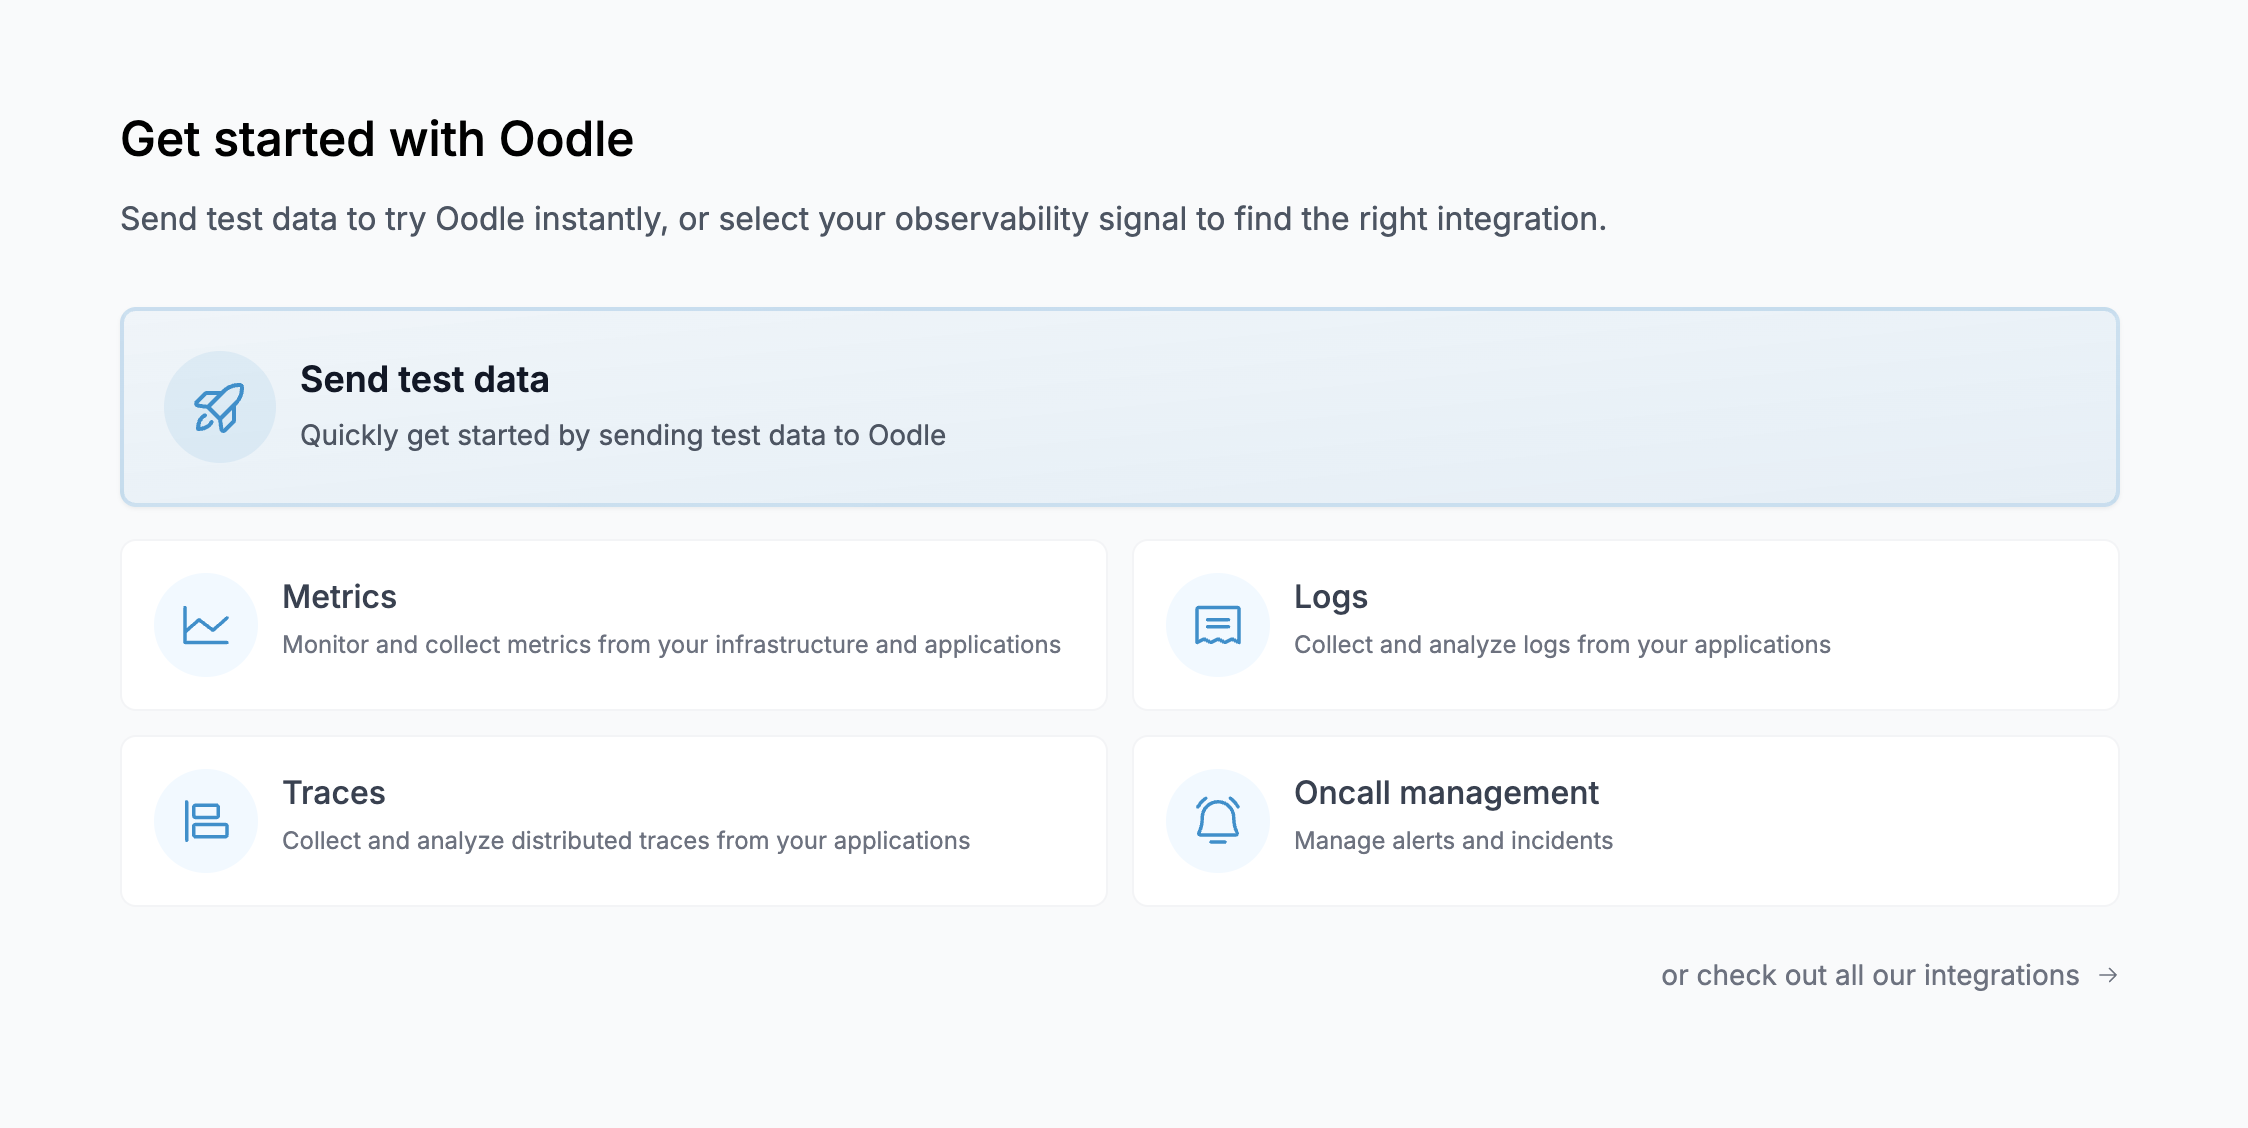
- After creating your account, you will be presented with a Get Started screen. Choose Send test data.
- Follow your preferred deployment method to set up the OTel demo.
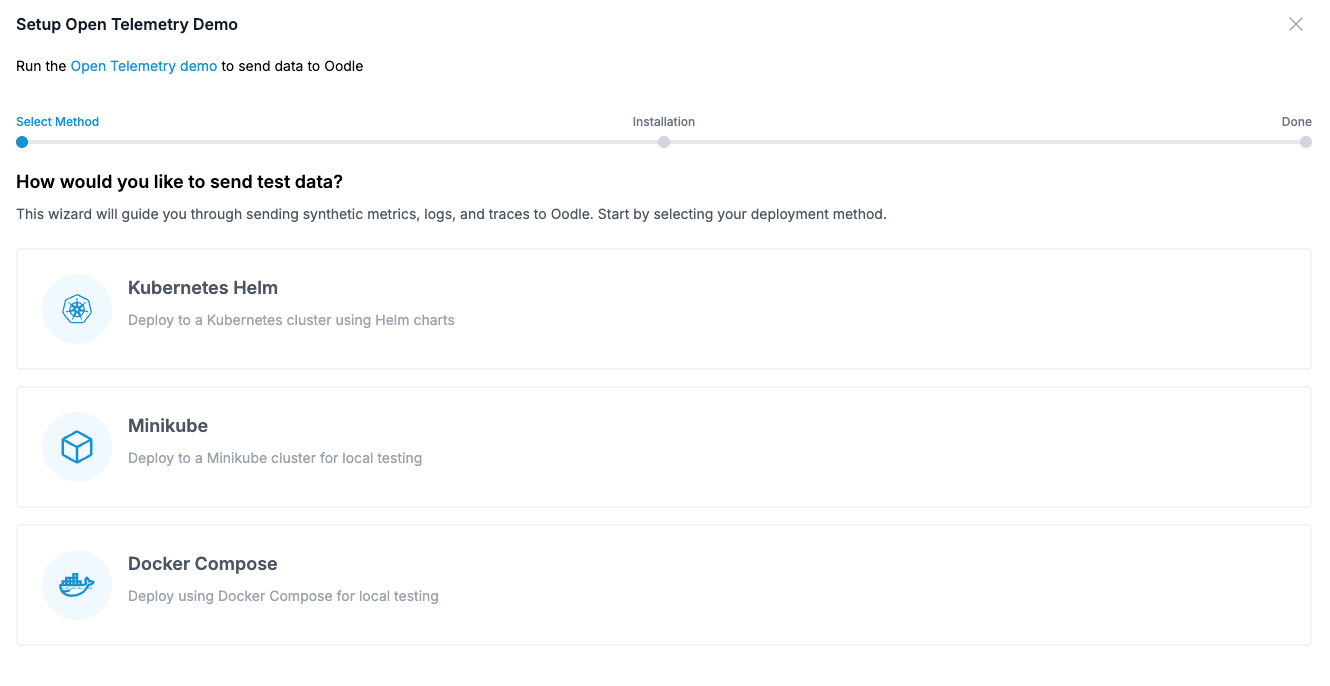
- For this guide, we’ll follow the Kubernetes Helm deployment method as a reference (other methods are equally simple). You can set up the OTel demo on your Kubernetes cluster by running a helm command, which will start sending metrics, logs, and traces from the OTel demo application to your Oodle account.
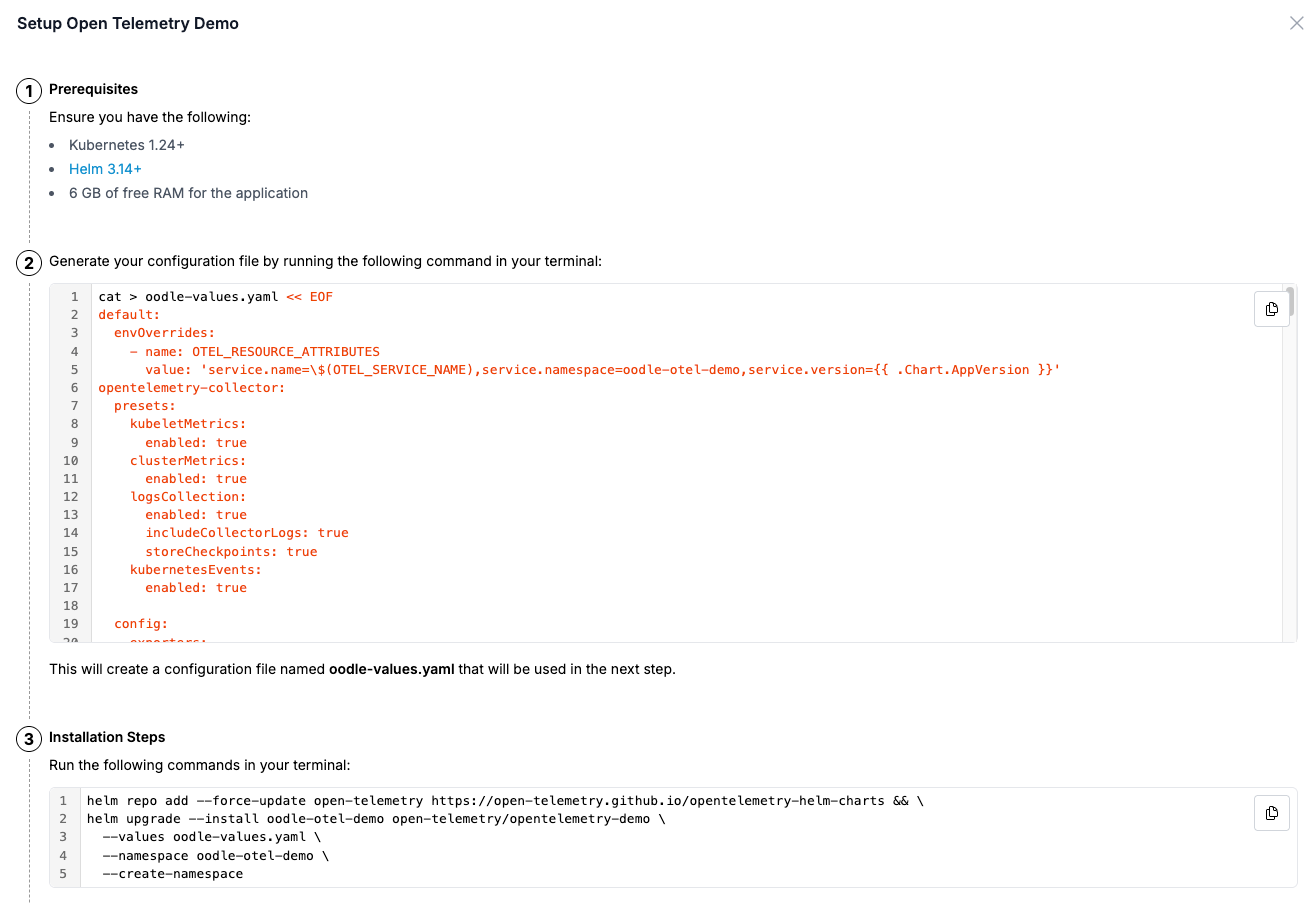
- That’s it! Once data ingestion begins, you will see a green status for all signals.
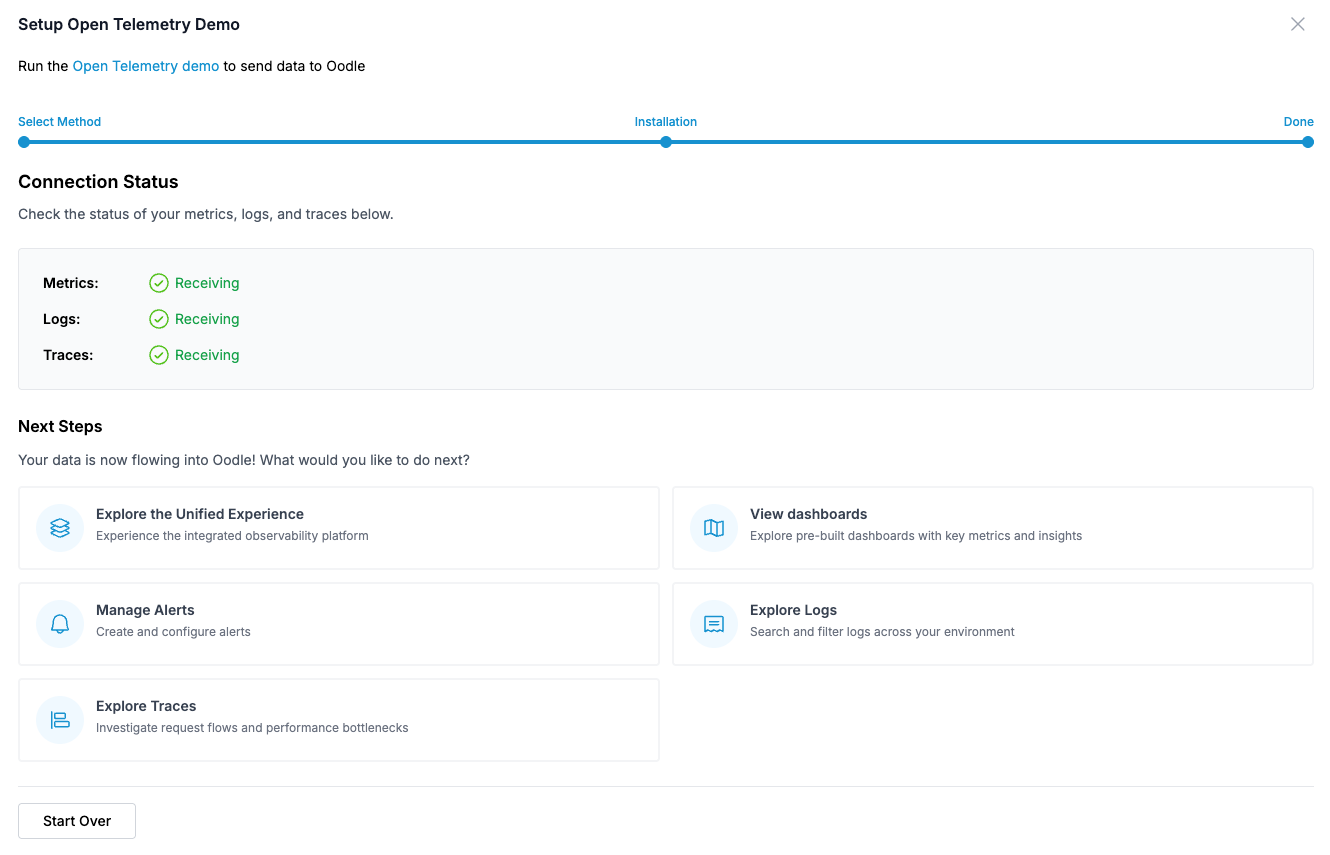
Once data is being ingested, you can explore it through:
- Explore the Unified Experience — Take a guided tour through Oodle’s Unified Debugging Experience, which walks you through exploring multiple signals in the context of an alert.
- View Dashboards — We automatically provision relevant dashboards to help you quickly glance at your metrics. Oodle uses the Grafana UI for metric dashboards and exploration, so you don’t need to learn a vendor-specific interface.
- Explore Logs — Explore your infrastructure and application logs in an intuitive OpenSearch UI. Filter relevant logs at the click of a button and identify patterns and anomalies easily.
- Explore Traces — Explore traces to cut through the distributed mesh of services and find errors and latency bottlenecks quickly.
As part of the above setup, we also provision a few alerts to help you explore the unified debugging experience. Let’s look at that next.
Your AI Alert Command Center
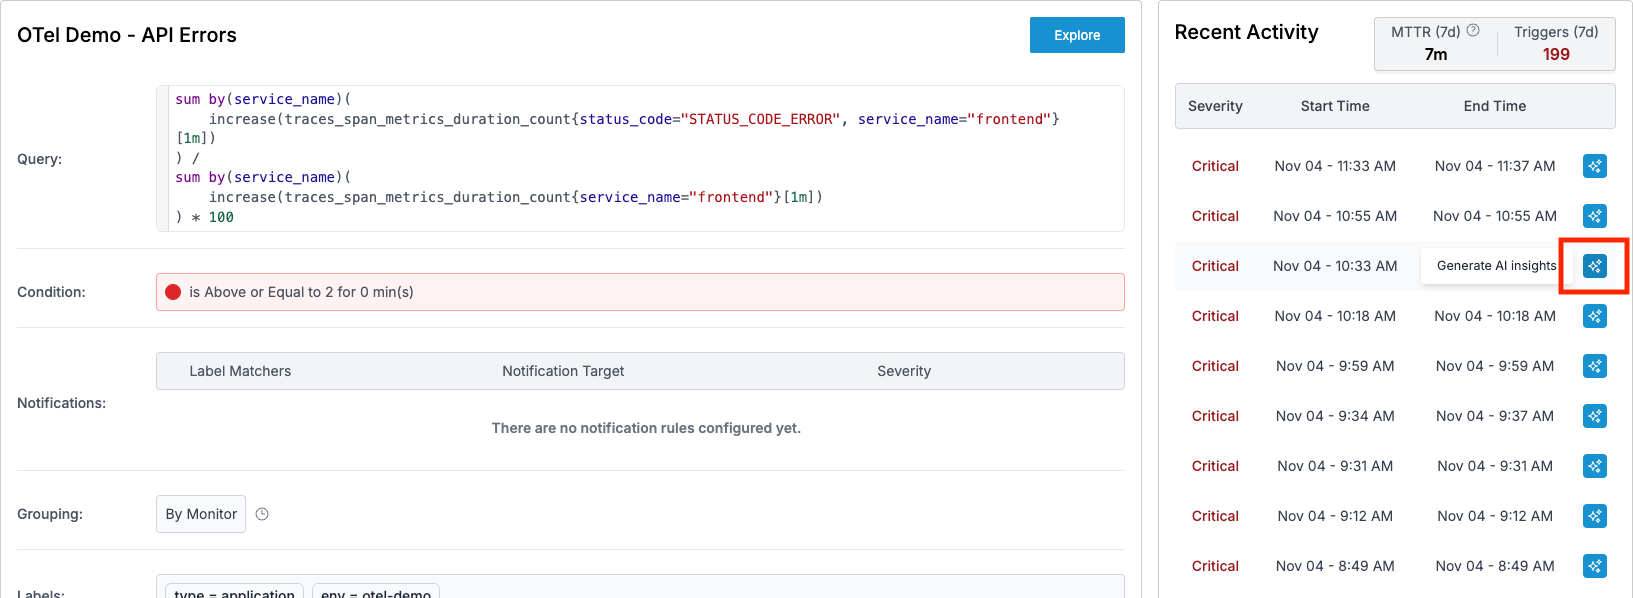
Let’s see Oodle in action with a real alert from the OTel demo running on our playground. We will debug OTel Demo - API Errors in our playground
Instead of the usual tab-hopping marathon, your alert debugging journey starts with a single click on the Insights button. The Insights view launches an agentic AI assistant that automatically troubleshoots the alert — we’ll see how that works later in this blog. First, let’s explore how Oodle’s unified interface makes it easy to manually explore metrics, logs, and traces for relevant services.
Correlation Across Services: Find the Culprit Fast
The OTel demo has 21 services (your real production environment would likely have many more), the first challenge is figuring out which services are even involved in the incident. Oodle’s Service Graph makes this instant - you can see the involved services, how they interact, and their golden signals at a glance.
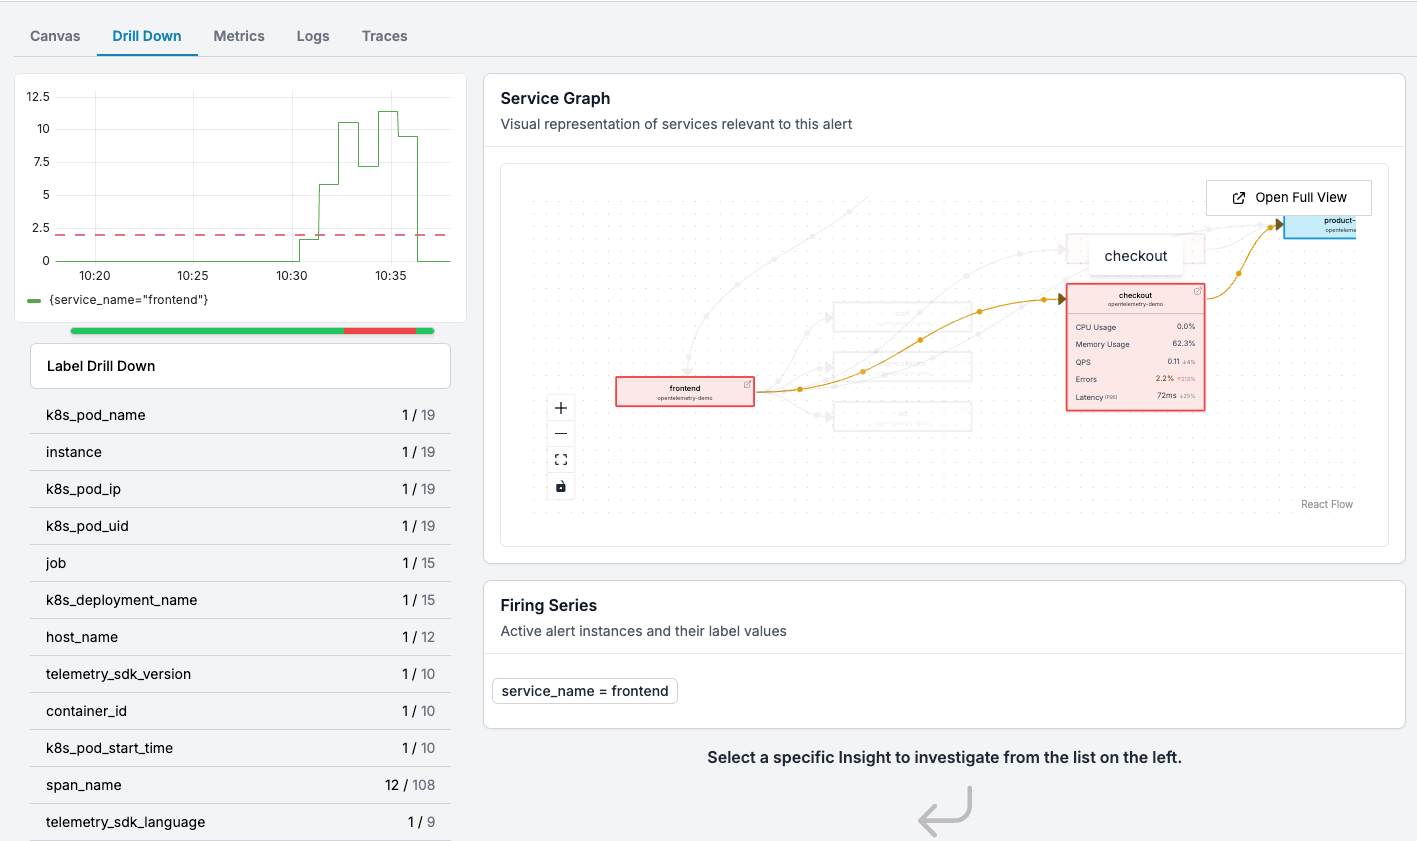
✨ Here, Oodle has identified
frontend,recommendation,checkoutandpaymentservices to be relevant to the alert. You can also see high error rate infrontendto be correlated with high error rate incheckoutservice.
But Oodle goes further. It performs automatic correlation analysis across the dimensions (labels) in your alert metric. This means you can quickly identify whether the issue is isolated to specific regions, customers, pods, or any other dimension — without manually filtering and comparing charts across multiple tools.
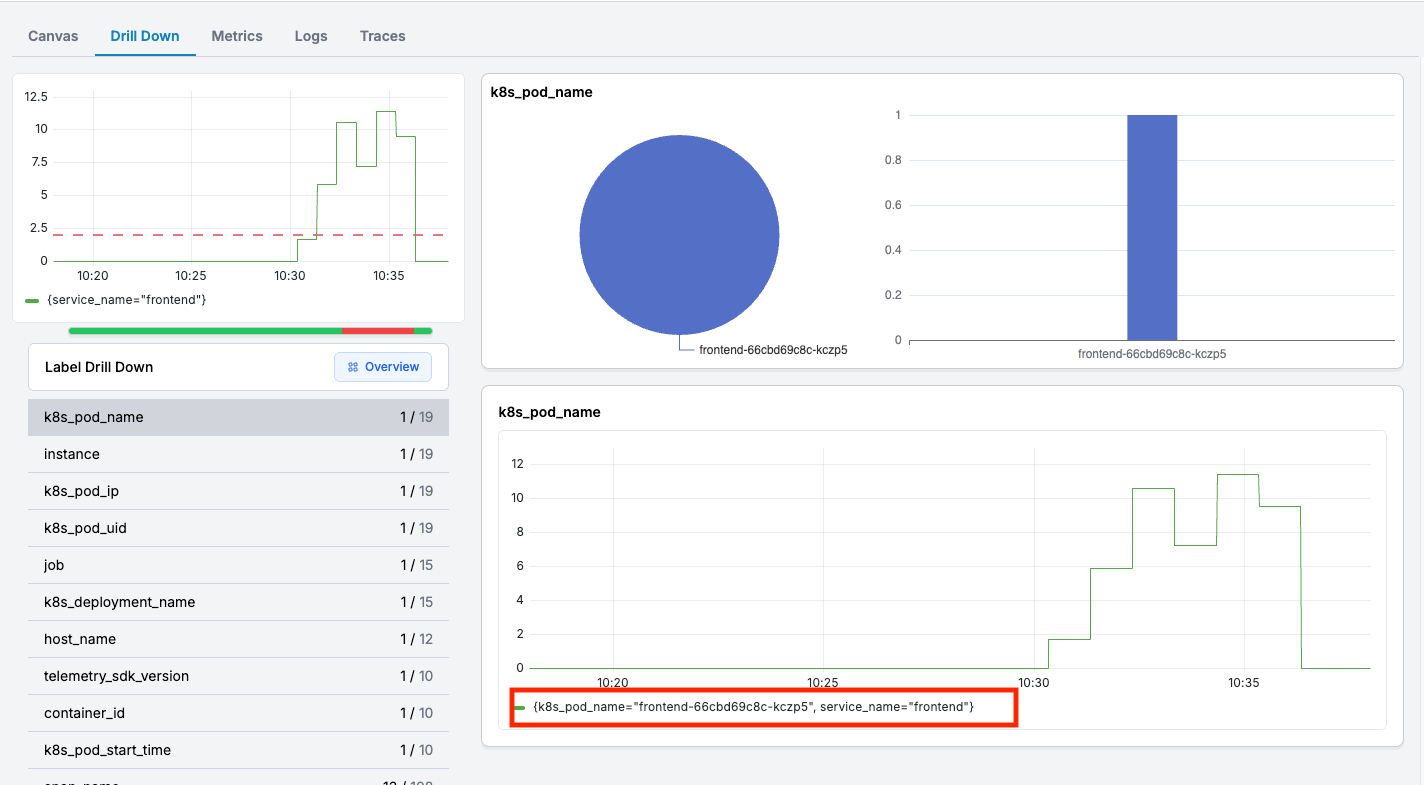
✨ The specific pod which is facing the errors is
frontend-66cbd69c8c-kczp5
Infrastructure Metrics: One Click, No Context Switching
Infrastructure health is often the first data point to examine when debugging an alert. Are services restarting? CPU-starved? Slowly leaking memory?
Instead of opening Grafana, finding the right dashboard, adding service filters, and adjusting time ranges - it’s all already filtered for you. One click shows you infrastructure health for the relevant services in the context of your alert.
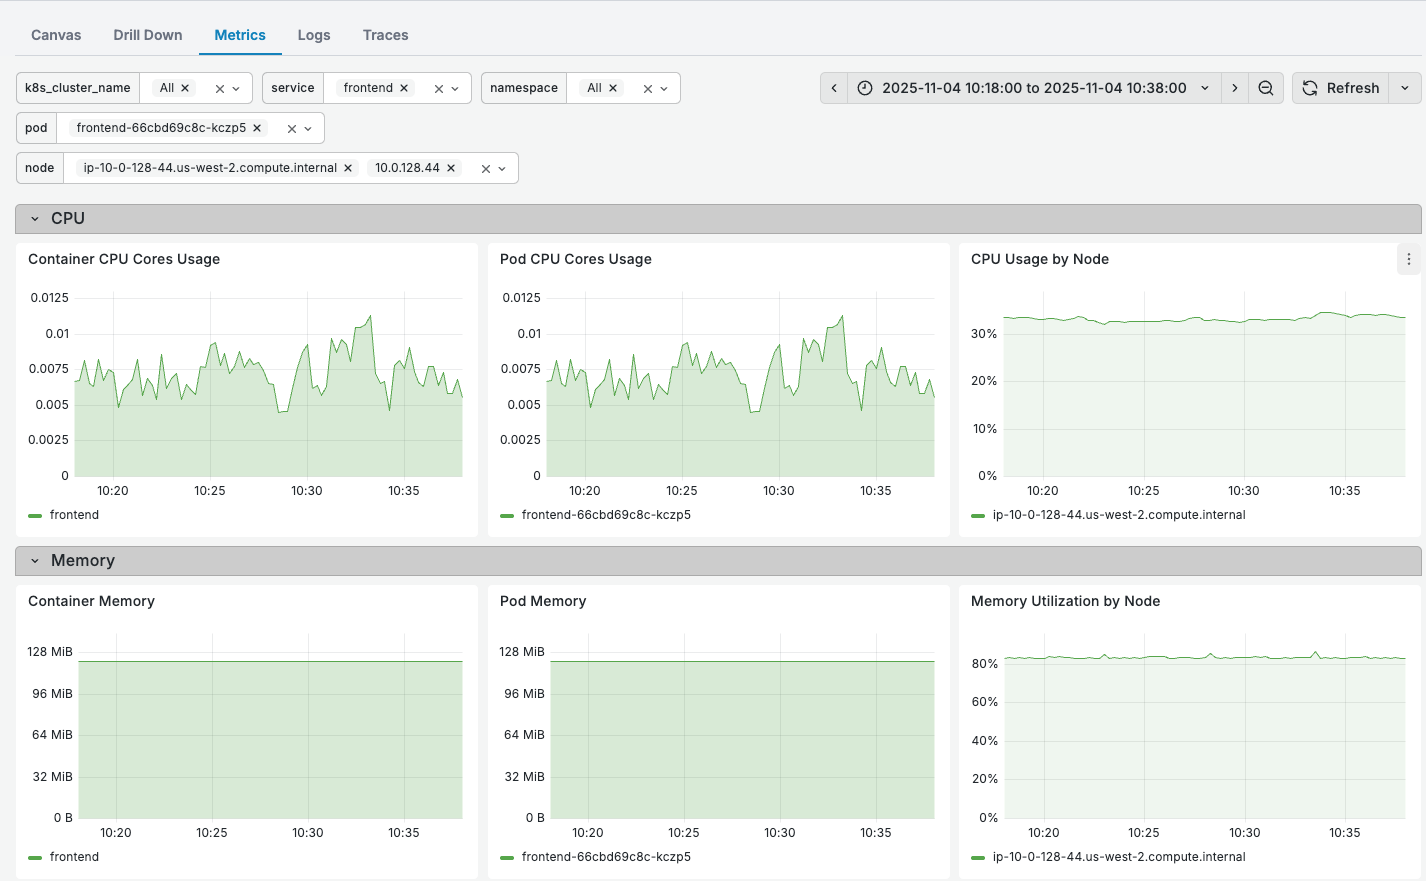
✨ For this alert, CPU and memory seem to be perfectly fine, thus, we can rule out infrastructure issue.
Logs: Pre-Filtered for Your Alert Context
If it’s not an infrastructure issue, application logs usually hold the clues. But searching through logs across multiple services and timestamps is tedious.
Oodle automatically filters logs for the relevant services and time range of your alert. You can spot error patterns and anomalies instantly, without manually crafting complex queries or copy-pasting timestamps.
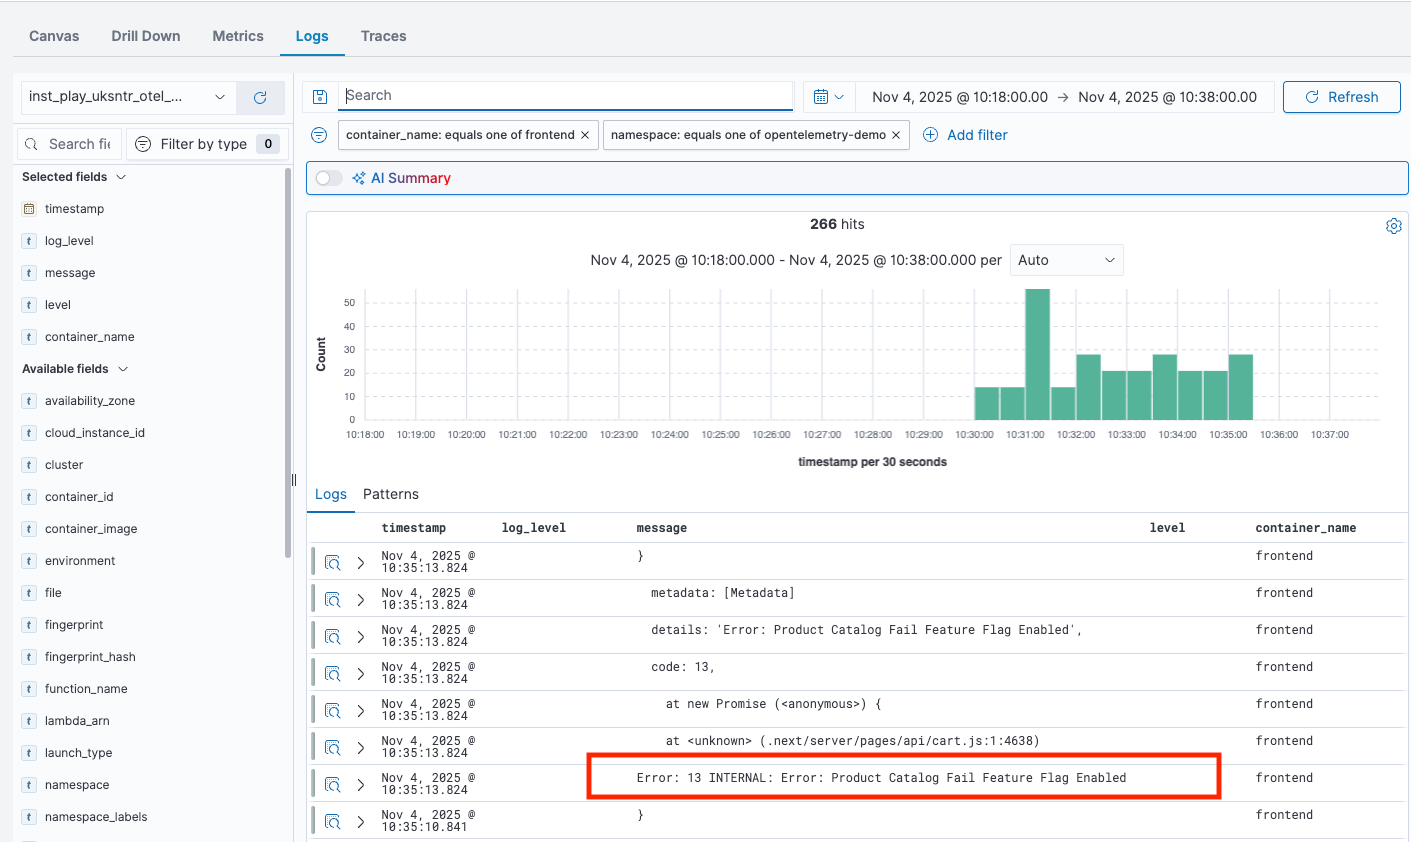
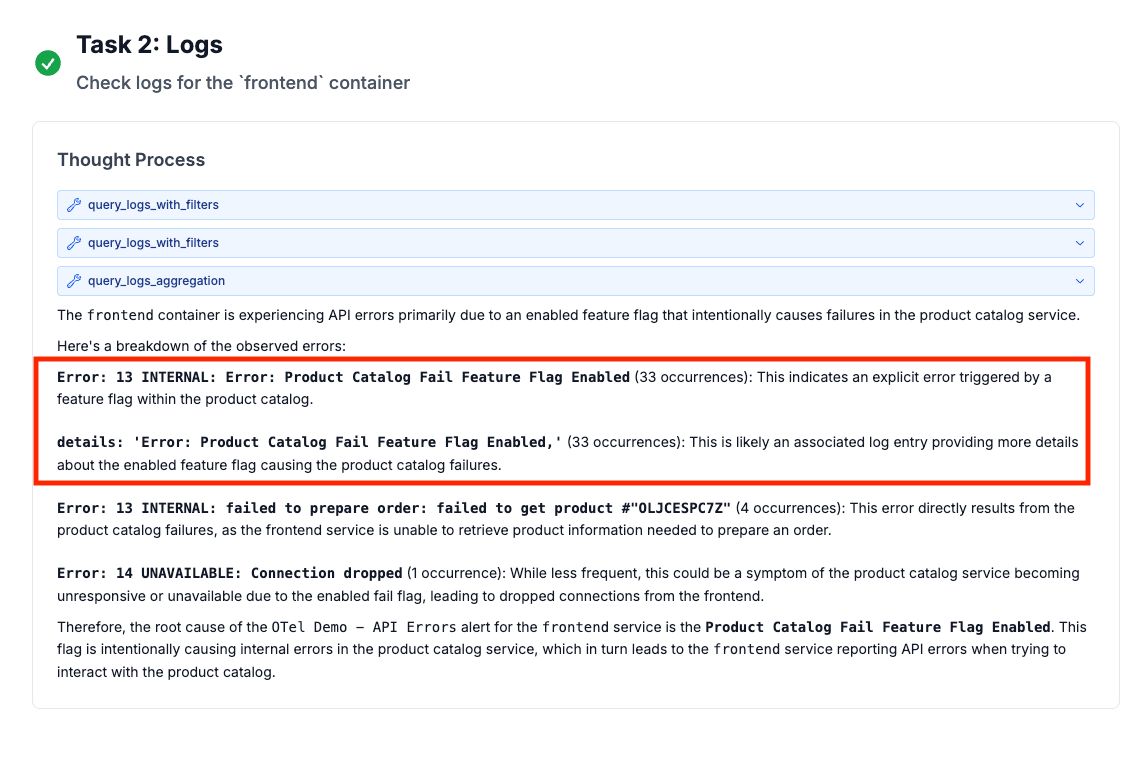
✨ We can see there is an error
Error: 13 INTERNAL: Error: Product Catalog Fail Feature Flag Enabledin thefrontendcontainer logs around the time of the alert.
Traces: Untangle the Distributed Mesh
Is this a one-off alert, or is there a more broader impact due to increased errors or latencies?
Traces filtered to your alert context make this trivial to answer. You can quickly see load, error, latency trends for the relevant services and time range of the alert.
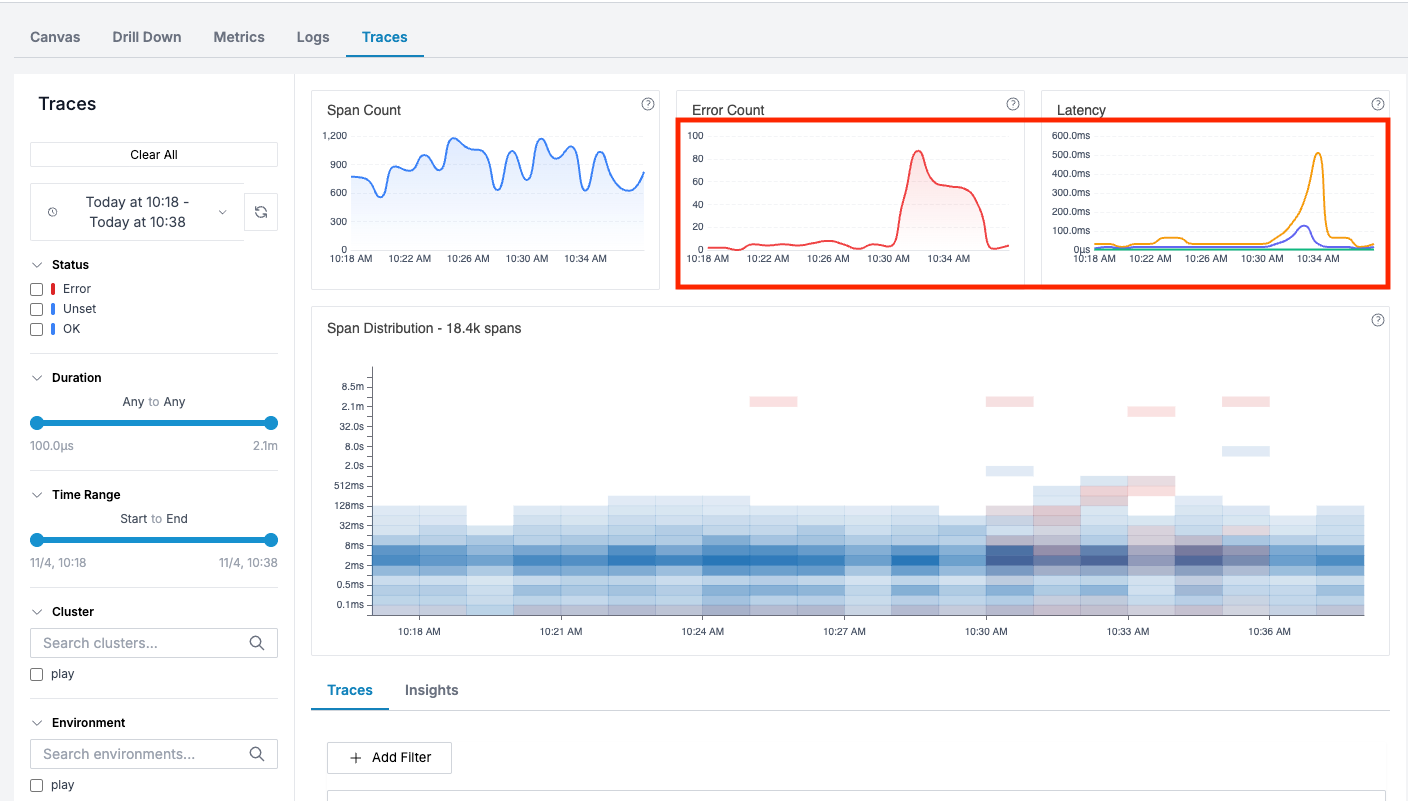
✨ Here, Error and Latency have spiked around the alert time. We can also see a bunch of red spans in the span distribution.
We can drilldown further by selecting a rectangle around the impacted time range of the alert in Span Distribution chart. Oodle performs a correlation analysis across the span attributes in the traces to find what’s different in the selected region versus the rest of the traces.
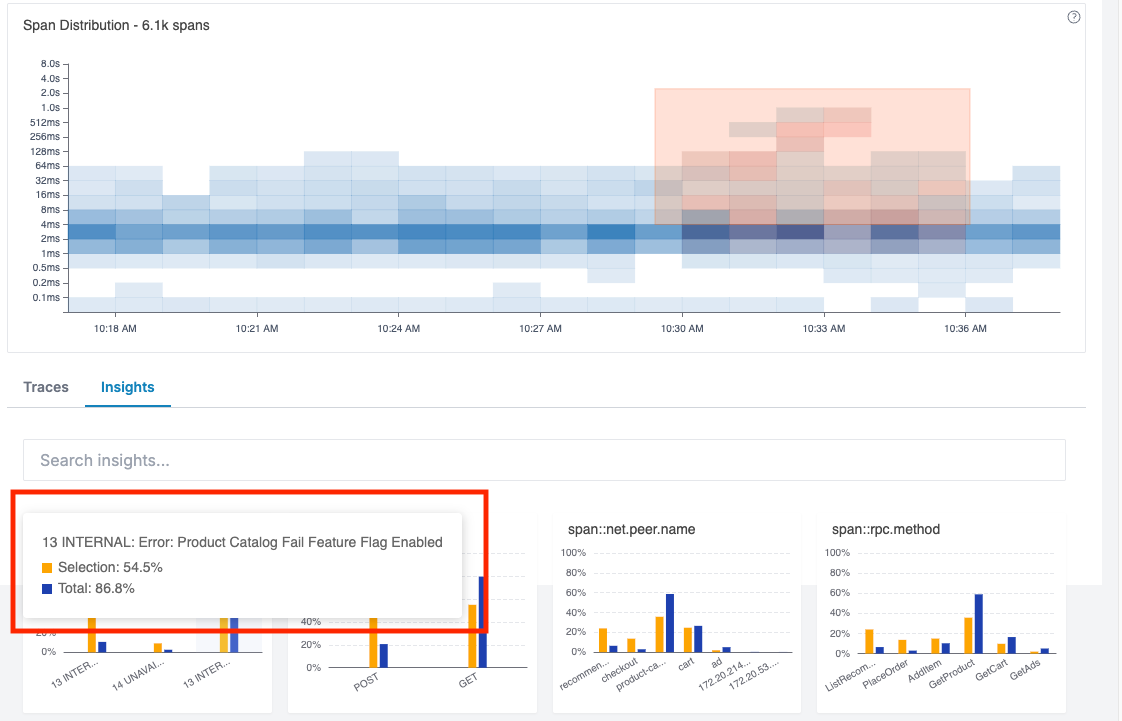
✨ You can quickly see an internal error bubbled up in the insights -
Product Catalog Fail Feature Flag Enabled.
Watch AI Debug Like an SRE
Now, let’s see the magic we mentioned earlier. Oodle’s agentic AI assistant automatically troubleshoots the alert by analyzing metrics, logs, and traces from relevant services in the context of the alert.
Here’s where it gets interesting: The AI reasons through the problem just like an experienced engineer would. It creates a debugging plan, breaks it down into specific tasks (check error rates, analyze latency patterns, correlate with deployments), and executes them all in parallel. You can click on each task to see its thought process and execution results.
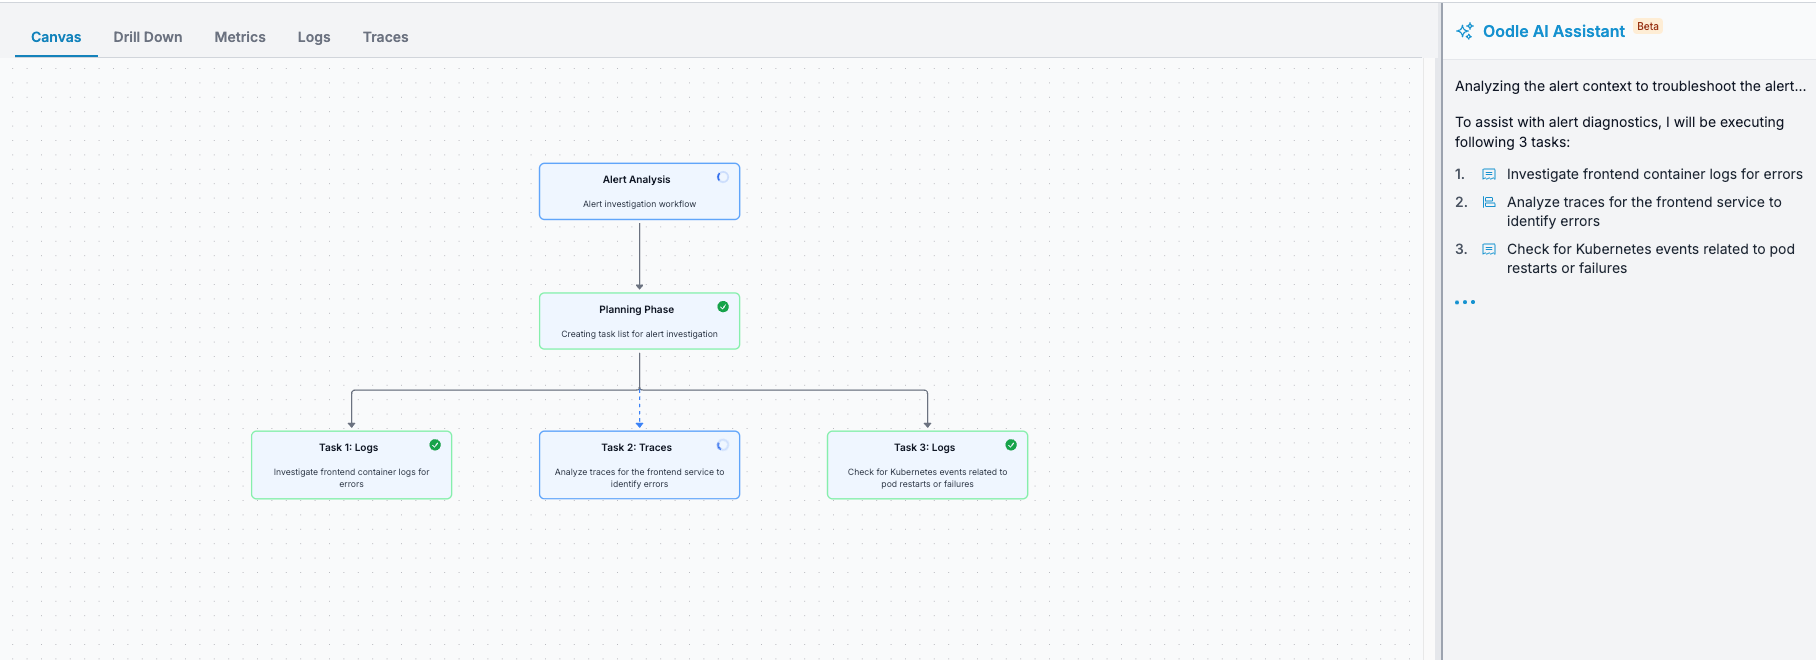
The AI queries your telemetry data intelligently — fetching data for specific services, filtering by errors and latency based on the alert definition, and correlating findings across all signals. At the end, it scores the findings from all tasks and surfaces the most relevant insights.
The result? What would take an engineer 30 minutes of tab-hopping and manual correlation happens in seconds. And you can ask follow-up questions in plain English: “Which deployment caused this?” or “Are other regions affected?”
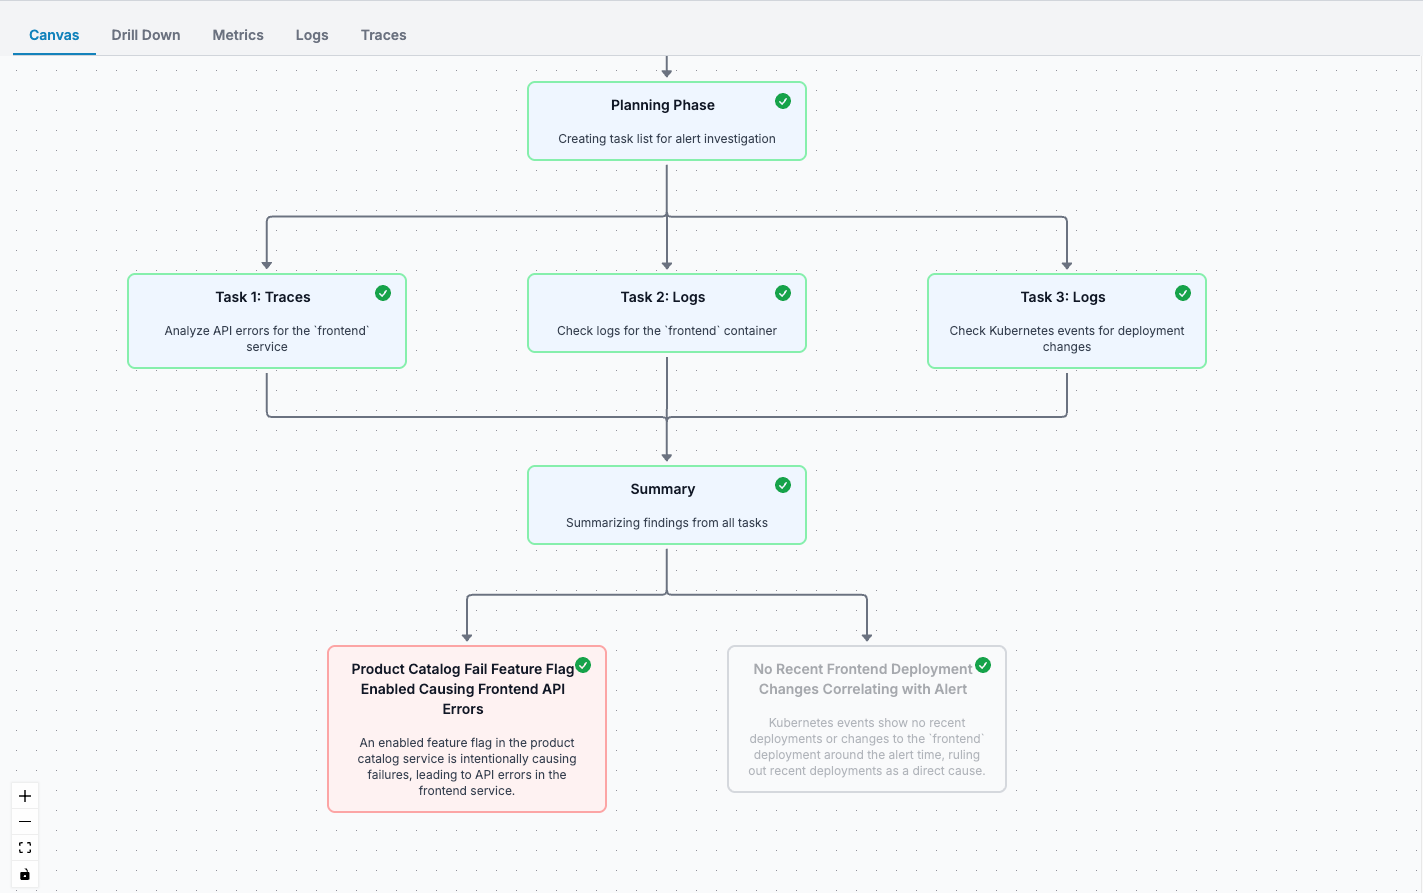
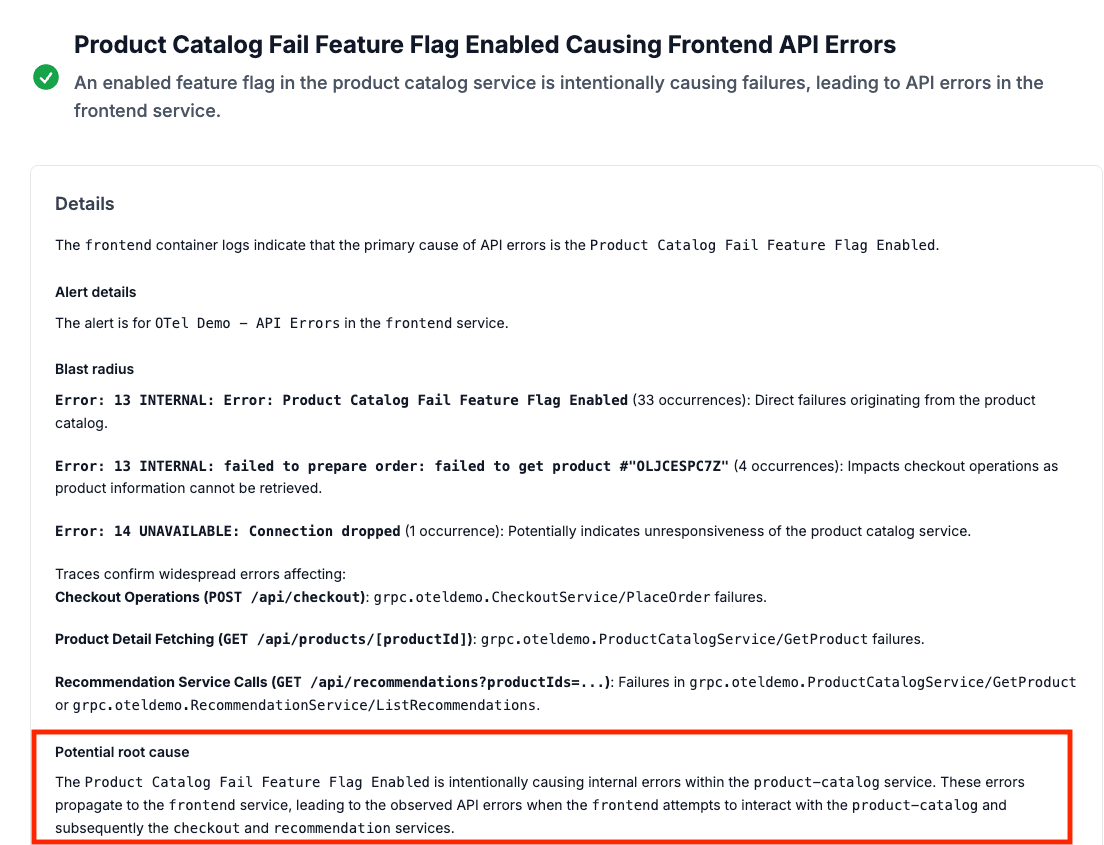
✨ AI assistant identified that
Product Catalog Fail Feature Flag Enabledis leading to errors incheckoutAPI with specific product being impactedfailed to get product #"OLJCESPC7Z". This ties well with our manual investigation through the Unified experience.
Note: The AI assistant is also available as a sidebar on all UI pages in Oodle to assist you with common tasks, such as summarizing logs, creating alerts, and updating Grafana dashboards.
Stop Fighting Your Tools. Start Fixing Problems.
Debugging production incidents shouldn’t feel like archaeological work across three different tools. With Oodle’s unified, AI-native experience, you get:
- All signals in one place — metrics, logs, and traces, pre-filtered for your alert
- AI that reasons like an SRE — ask questions in plain English and get intelligent analysis
- Correlation that just works — across services, dimensions, and signals
- Setup in under 5 minutes — as we showed with the OTel demo
Ready to experience the future of observability? Explore our full feature set at our playground, or sign up for free to try Oodle with your own data.