- 08 Dec, 2025 *
This is the second week of my journey in the data science realm. This week, I built my first model—linear regression. It’s used to model the relationship between input features (independent variables) and a continuous target variable (dependent variable). I made a model between the number of cylinders and total weight of a car. Obviously, the more cylinders a car has, the heavier it will be. So, our model will predict what could be the weight of a car if it has, let’s say, four to six cylinders.
It’s one of the basic models, but still you should know a lot of theoretical things. For example, how the quality of those models is calculated using metrics like RMSE (Root Mean Squared Error). More importantly, how [R-squared](https://en.wikipedia.org/wiki/Coeffic…
- 08 Dec, 2025 *
This is the second week of my journey in the data science realm. This week, I built my first model—linear regression. It’s used to model the relationship between input features (independent variables) and a continuous target variable (dependent variable). I made a model between the number of cylinders and total weight of a car. Obviously, the more cylinders a car has, the heavier it will be. So, our model will predict what could be the weight of a car if it has, let’s say, four to six cylinders.
It’s one of the basic models, but still you should know a lot of theoretical things. For example, how the quality of those models is calculated using metrics like RMSE (Root Mean Squared Error). More importantly, how R-squared should be used. And when a model is ready, how to assess if it’s correct and will give you the actual result. There are a lot of things to consider, but overall, the experience was nice.
We are using datasets from Kaggle. It’s one of the most popular places for storing datasets and things related to machine learning.
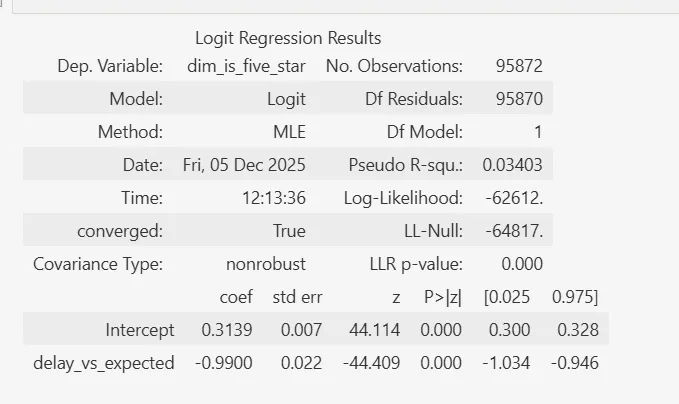
Logistic Regression
The same week, we looked into the logistic regression model. This is used when the target variable (what you’re predicting) is binary—either one or zero, yes or no, male or female, etc. You can use continuous features like age or income to predict these binary outcomes. Again, it’s basic stuff, but it’s essential for many real-world scenarios where you need to predict binary outcomes.
The Olist Project: Finding a Million-Real Opportunity
At the end of this week, we started looking into the Olist dataset. Olist is a Brazilian marketplace which shared its statistics and the whole data of the sellers and customers on Kaggle, and everyone can pick it up and start analyzing it.
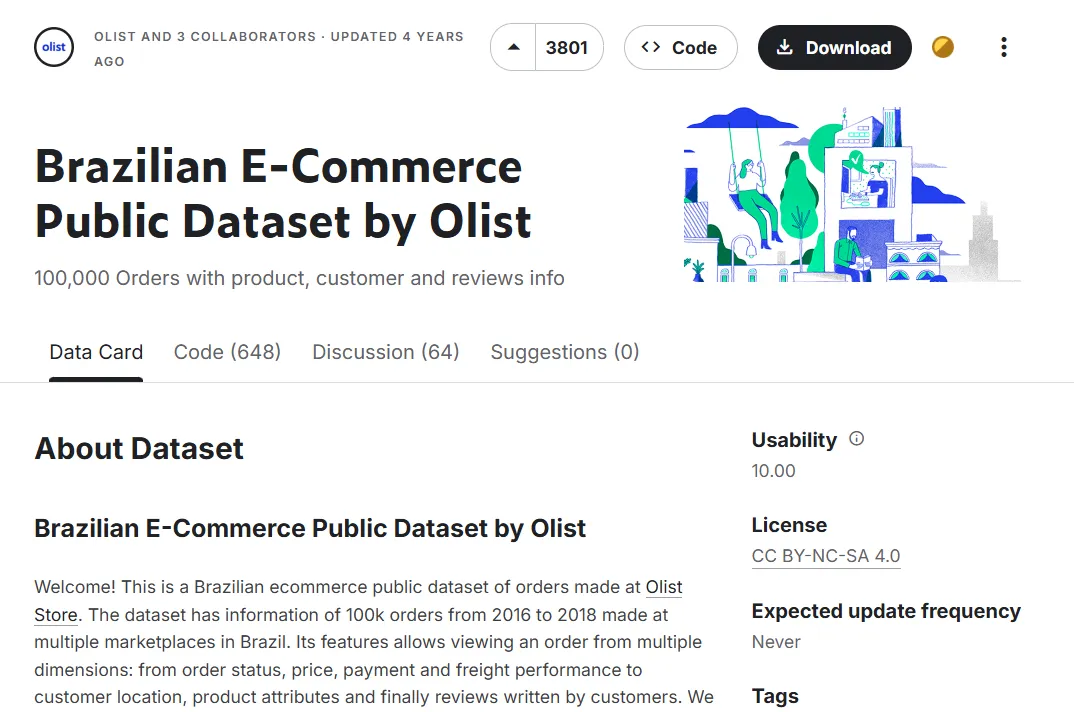 Image: E-commerce data analysis dashboard
For example, this week our task—we split into two groups and we were looking at the possibilities of improving the total profit. Ironically, despite my IT background, I didn’t realize that IT costs have such a huge impact on the total profit. So, one of our outcomes—our analysis showed a potential savings of even 1 million Brazilian Reals. Only by improving the IT costs and getting rid of bad sellers.

But it was interesting. We were working in groups and we were presenting to our instructor (acting as CEO) our results and our analysis, simulating how it would be in actual production work. So, as you can see, a couple days of work on this dataset, we found potential savings of 1 million Reals. It’s a big impact. 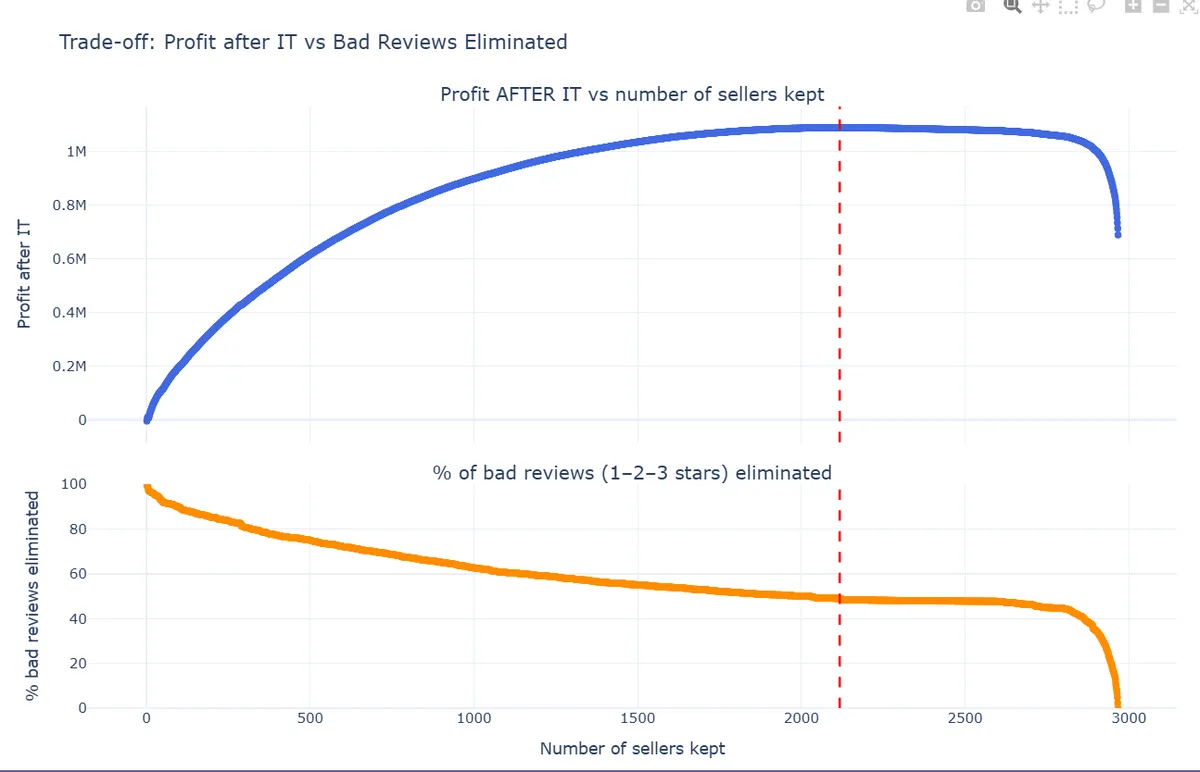
Looking Ahead
So, I look forward to the next week. We will go deeper into advanced Machine Learning and start exploring Deep Learning. It’s the stuff which could be even harder than what we’ve been working on so far. It’s challenging. I’m still a bit struggling because of the lack of experience, but I’m ramping up gradually and this week I feel much more confident than, for example, last week.
So, see you next week. I hope to share with you what interesting models we’ll be working on. I’ll try to share it with you. I’m not sure—I mean, we might not be allowed to do this, but let’s see how it goes.