1748-9326/20/11/114091
Abstract
Forests, once the largest terrestrial carbon sink, are increasingly becoming significant sources of carbon emissions worldwide due to large wildfires and the accumulation of fire fuels in warming environments that deplete soil and vegetation moisture. Despite growing needs such as Nature-Based Solutions, there is a lack of operationalized near-real-time satellite observations of forest fuel conditions to assess whether forests are acting as carbon sinks or emitters. Most existing satellite products focus on chlorophyll content or vegetation cover rather than directly measuring hydrological or thermal variations that influence carbon flux. From Soil Moisture and Ocean Salinity (SMOS) L-band microwave brightness temperature, we retrieved forest (or …
1748-9326/20/11/114091
Abstract
Forests, once the largest terrestrial carbon sink, are increasingly becoming significant sources of carbon emissions worldwide due to large wildfires and the accumulation of fire fuels in warming environments that deplete soil and vegetation moisture. Despite growing needs such as Nature-Based Solutions, there is a lack of operationalized near-real-time satellite observations of forest fuel conditions to assess whether forests are acting as carbon sinks or emitters. Most existing satellite products focus on chlorophyll content or vegetation cover rather than directly measuring hydrological or thermal variations that influence carbon flux. From Soil Moisture and Ocean Salinity (SMOS) L-band microwave brightness temperature, we retrieved forest (or canopy) temperatures over the 2023 Canadian and 2021 Sakha Republic wildfires that generated some of the world’s largest carbon emissions. We propose forest canopy temperature as a predictor of natural carbon emissions from mega-wildfires, in comparison with Soil Moisture Active Passive vegetation water content and European Centre for Medium-Range Weather Forecasts ERA5 land surface temperature products, which fail to capture the tipping points of thermal development in cold forests. The heat-amplifying feedback between forests and pre-fire sensible heat further accelerates fuel dryness through evapotranspiration driven by snow-melt water and forest warming, leading to the large-scale spread of wildfires. Under such dry conditions, forestation policies may inadvertently increase fuel availability and wildfire risk, potentially leading to an increase in net carbon emissions rather than achieving the intended benefits of carbon sequestration.
Export citation and abstractBibTeXRIS
In recent decades, forestation has been proposed as a strategy for carbon mitigation (Marx and Cuypers 2011, Kristensen et al 2024). Forests not only absorb carbon, but they are also a major source of carbon dioxide emissions, especially when they burn or decay. Due to this dual role, often referred to as the forest paradox, it remains challenging to assess the effectiveness of this approach. Current carbon policies, including Net-Zero targets or the Paris Agreement, often assume forests are a stable carbon sink without fully accounting for their potential to become a massive carbon source in a warming environment (Natali et al 2022). This is a very important missing element, considering the latest trends that boreal forests have transitioned from a carbon sink to a source in both Canada and the Sakha Republic of Russia. Boreal forests are the largest intact forest biome in the world, but globally have the highest proportion (69%–73%) of forest loss due to wildfires (Tyukavina et al 2022). In 2023, the Canadian wildfires accounted for approximately 22% (1761 Mt of CO2 eq, almost five times the average for the past 20 years) of 2170 Mt of global carbon from wildfires (Copernicus Atmosphere Monitoring Service (CAMS) 2023). It far exceeds the average amount of carbon sink (4.7 Mt of CO2eq) that Canada can annually sequester (Bysouth et al 2024). That is a greater amount of carbon emissions than those from fossil fuels in any other country except China and the United States (Zou et al 2020). While China’s emissions are indeed high, given that much of the world’s manufacturing is concentrated in China and that the United States’ carbon emissions are declining, this point can be made even more strongly. Siberian taiga forests also change from carbon sinks to carbon sources (Ponomarev et al 2023). In 2024, they emitted the 3rd highest carbon amount in 20 years, following 2019 and 2020 (Copernicus Atmosphere Monitoring Service (CAMS) 2024b). Not only boreal forests but also the world’s most productive forests are increasingly becoming carbon emitters. In 2024, Amazon wildfires recorded the highest carbon emissions since 2010, also turning Amazon forests from carbon sinks into carbon emitters (Gatti et al 2021, Copernicus Atmosphere Monitoring Service (CAMS) 2024a). Deforestation declined in 2023, but fire-burned areas have increased. More arid than moist tropical forests like the Amazon, Australia, which is experiencing prolonged droughts, is also transitioning into a carbon emitter. The Australian fires also burnt 715 million tons of carbon dioxide during 2019–2020, far exceeding annual fossil and industrial carbon emissions, approximately at 400 million tons of CO2 eq (van der Velde et al 2021).
Whether forests become carbon emitters or sinks depends on the thermal development of forests as a heating source to spread large wildfires, especially in extreme heat events that have become more prominent in recent years. During heatwaves, the long-term cooling effect of forests languishes more than open grassland or croplands. Instead, forests become strong heat storage in the short term, due to sensible heat fluxes (Teuling et al 2010, van Heerwaarden and Teuling 2014, Domeisen et al 2023). Forests desiccated through such convective surface heating, which could consequently intensify fire severity in boreal forests (Lareau et al 2018, Nauslar et al 2018, Zhang et al 2019).
Forest heating is thus a very important factor that constitutes two of the three fundamental elements of the ‘fire triangle’ (heat, fuel, and oxygen) required for ignition. This surface heating event further accelerates rapid and large-scale snowmelt (Huning and AghaKouchak 2018, Madadgar et al 2020). For example, according to 2024 the British Columbia Automated Snow Weather Stations, the heat events in British Columbia for several days in May 2023 melted approximately 86% of the seasonal snowpack by June 1st. The intense heat ultimately led to the outbreak of one of the largest Canadian wildfires in the year. Once the snow had rapidly melted, the forest became vulnerable to wildfires due to the combined effects of low humidity and dry, windy weather conditions (Darwish Ahmad et al 2023).
However, the short-term heat transfer mechanisms that amplify the thermal effects and carbon emission potential of forests over timescales of several days or weeks remain inadequately studied, as compared to long-term climatology. Most widely used wildfire prediction systems are primarily based on meteorological forecast data (van Wagner 1987) and/or drought severity indices (Fan et al 2023), while often overlooking the hydrological and thermal dynamics of forests as fuels and heat storage. As a result, there is a significant gap in information necessary for accurately assessing vegetation fuel conditions and fuel availability.
Although fuel moisture, simulated as a function of atmospheric variables such as rainfall and humidity, is often incorporated into current fire models, near-real-time (NRT) observations of fuel hydrological and thermal properties in forests remain unavailable at an operational level. Typically, fuel (or vegetation) moisture proxies such as the normalized difference water index and the global vegetation moisture index are retrieved from thermal or optical multispectral sensors, such as the moderate resolution imaging spectroradiometer (MODIS) temperatures, surface reflectance, or their Vegetation Index products, which are often more specific to chlorophyll (Yebra et al 2022a, 2022b). However, these optical and thermal infrared images are fundamentally contaminated by factors such as cloud cover, or smoke shadows. Their algorithms often rely on empirical methods, resulting in unclear relationships between fuel moisture and vegetation index when applying to different land cover, vegetation species or forests exceeding the threshold of a linear relationship used by empirical methods (Ceccato et al 2001, Leblon 2005, Chen et al 2021).
As an alternative to fuel moisture, MODIS land surface temperatures, often used as a proxy for fuel temperature, are not effective in monitoring fuel development. This is because the surface emissivity of forests is approximated with the linear and empirical relationship between NDVI and forest emissivity instead of measurement (Wang et al 2008). Consequently, these indices are not highly sensitive to moisture fluctuations in forests, which has a complex relationship with NDVI (Leblon 2005, Nolan et al 2016). In addition, C-band synthetic aperture radar (SAR) backscatter is sometimes used for estimating vegetation water content (VWC) (Szpakowski and Jensen 2019, Pirotti et al 2023). However, with SAR, it still remains challenging to accurately isolate surface roughness. There is no radiative transfer model developed for simulating volume scattering from vegetation yet.
Soil moisture is an important indicator of vegetation fuel moisture. However, practically, satellite products such as Moisture and Ocean Salinity (SMOS)/Soil Moisture Active Passive (SMAP) are often subject to vegetation biases (Lee et al 2017, Lee 2018, Wang et al 2023). While SMAP vegetation optical depth and water content (VWC) are also available, they often fail to effectively capture fuel dynamics in forests or serve as reliable proxies for fire spread (Lee et al 2024). This is likely because VWC is approximated using long-term climatology of NDVI, which easily saturates as the VWC exceeds a threshold in cases with high VWC such as forests. The other reason may be that the SMOS/SMAP retrieval algorithm does not adequately account for the canopy temperature (Kerr et al 2012, Entekhabi et al 2014). However, this assumption does not hold under heat stress (Pomeroy et al 2009, Luan and Vico 2021).
Canopy temperature plays a crucial role in the fire spread mechanism, as fuel temperature provides the heat required for pyrolysis, and increases vegetation fuels by decreasing fuel moisture (Liu et al 2021). Although canopy temperature is often estimated using thermal infrared sensors (Ihuoma and Madramootoo 2017), these measurements are often contaminated by cloud or smoke cover. In contrast, L-band radiometer-retrieved canopy temperature offers several operational advantages for characterizing vegetation fuel conditions compared to thermal infrared or C-band microwave sensors. At this microwave frequency, vegetation opacity is low and semi-transparent, reducing the effects of vegetation volume scattering, atmospheric interference, and soil roughness, and being independent from cloud cover or smoke (Reul et al 2016, Meyer et al 2018).
In this study, we investigate the thermal and hydrological dynamics of pre-fire fuel conditions in forests to predict megafire spread ahead of the flames. By monitoring tipping points in the timing and location of heat absorption in forests, we assess the predictive capability of L-band microwave-retrieved canopy (or fuel) temperatures, extending beyond existing fire detection products such as MODIS active fire or fire radiative power, which only detect flames or smoldering during ongoing fires. To evaluate the predictability of canopy temperatures, we compare them with SMAP VWC and ERA5 land surface temperatures, which have been widely used for canopies or forests. This study also aims to investigate the impact of forest heat storage on snowmelt and consequently fuel availability through evapotranspiration from snow-melt water in boreal forests in the Northern Hemisphere. Ultimately, this study aims to propose a reliable and effective indicator for large-scale wildfires, eliminating the need for models that require complex parameterization of land surface dynamics and multiple accurate input variables.
2.1. Study area
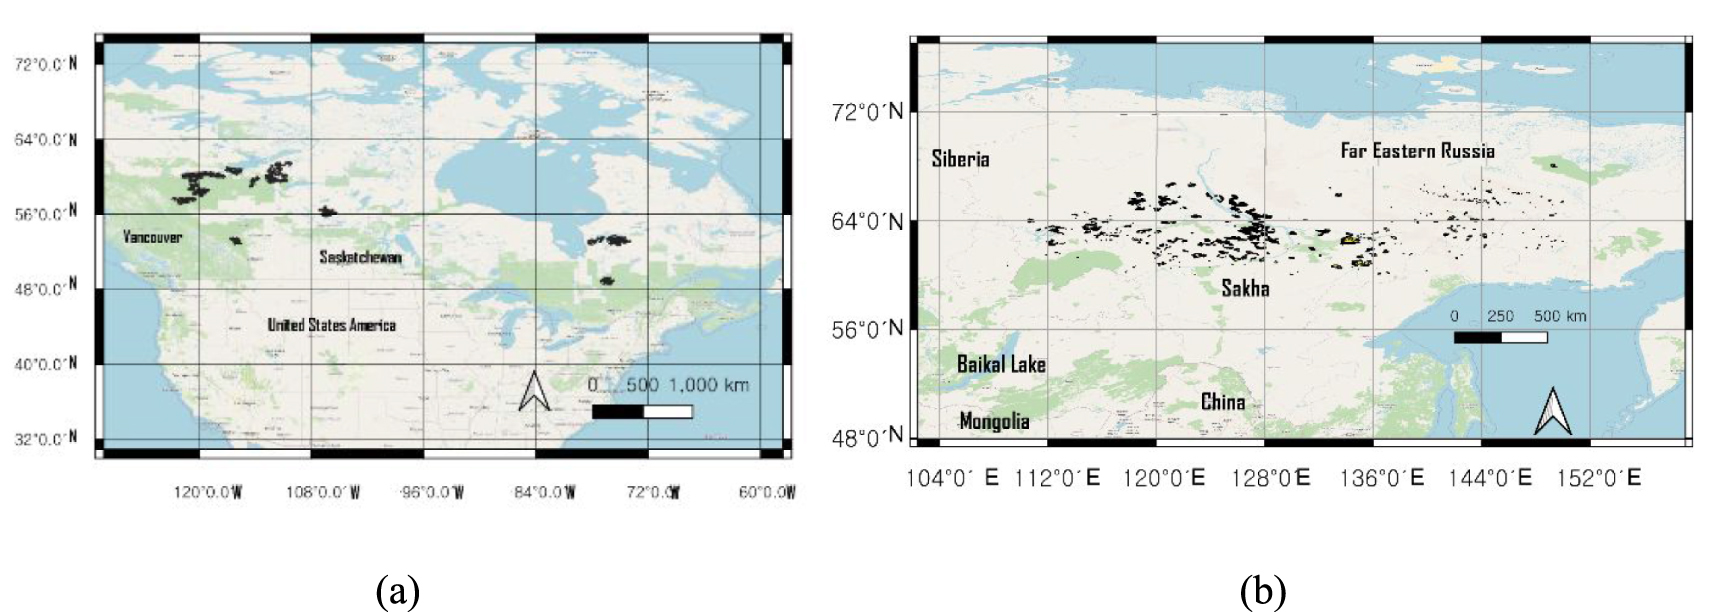
We focus on large-scale fires that can non-linearly disturb atmospheric stability. According to the US. Interagency Fire Center, a wildfire that burned more than 40 500 hectares is classified as a megafire. In the past 5 years, two of the largest wildfires in history occurred (figure 1). In 2023, Canadian wildfires spanned from the Northwest Territories to British Columbia, Alberta and Quebec, burning a total of 18.496 million hectares (Firestatistics 2023). MODIS land cover (MCD12) includes evergreen needleleaf forests, evergreen broadleaf forests, mixed forests and shrublands. Similarly, the 2021 Russian wildfires burned 18.8 million hectares, accounting for 8.4 million hectares of this total (Voiland 2021). Ecoregions include Bering tundra, Cherskii–Kolyma mountain tundra, Chukchi Peninsula tundra, East Siberian taiga, Northeast Siberian taiga and Trans-Baikal Bald Mountain tundra (Talucci et al 2021). MODIS land cover (MCD12) indicates woody savannas, and savannas. Out of 6,000 Canadian fires (Natural_Resources_Canada 2024), we focused on large-scale burned areas of 100 000–300 000 ha, as follows: 63° 42′ 36″ N, 123° 39′ 0″ W ∼ 52° 10′ 48″ N, 103° 44′ 24″ W, and 53° 30′ 0″ N, 79° 7′ 12″ W ∼ 47° 58′ 12″ N, 72° 4′ 48″ W. This corresponds approximately to 7998 611 ha (figure 1(a)). Polygon forest fire perimeters for burned areas in Canada were acquired from the Canadian National Fire Database (CNFDB)(Canada 2022). The Sakha Republic region was set at 60–66.8° N and 116–138° E. This is approximately 1952 417 ha (figure 1(b)). The data source will be presented in the subsequent section concerning satellite data.
Figure 1. Study domain: (a) Canadian wildfires in 2023 (b) Sakha Republic wildfires in 2021.
Download figure:
Standard image High-resolution image 
2.2. Satellite data
For both Canadian and Russian wildfires, the European Space Agency (ESA)’s Soil SMOS Level 3 daily (version 3.3) brightness temperature product on a 25-km EASEv2 grid was acquired through the Centre Aval de Traitement des Données (Kerr et al 2012). In this study, reprocessed MIR_CDF3TD or operational MIR_CDF3TD products with a descending orbit were selected, depending on availability. Among 15 incidence angles, three angles (37.5°, 40°, and 42.5°) were selected for averaging so that it can be compared with SMAP data measured at 40°. Both horizontal and vertical brightness temperature values were also averaged to determine the brightness temperature. For snow cover data, MODIS/Terra Snow Cover Daily L3 Global 500 m Grid. Version 6.1 (MOD10A1) was used (Hall and Riggs 2021). Sakha fire areas were obtained from the Version 6 MODIS Burned Area data product (MOD64A1), a monthly, global, 500 meter gridded dataset (Giglio 2015). SMAP VWCs were downloaded from SMAP L3 Radiometer Global Daily 36 km EASE-Grid Soil Moisture products (version 8, SMAP_L3_SM_P_XX) through the earth data (https://search.earthdata.nasa.gov/).
2.3. Retrieval of canopy temperature
Canopy temperature is closely related to sensible heat Hc as follows:
where Hc is vegetation sensible heat flux (W m−2), ρ Cp is the volumetric heat capacity of air (J m−3 K), Tc is canopy temperature (K), Ta is the air temperature at some reference height above the surface (K), and Ra is the resistance to heat transport (s m−1). Sensible heat indicates the ability of forests to absorb heat, and the amount of heat required to raise the temperature of forests by one Kelvin degree. This also can be described by the difference from air temperature (i.e. Hc =  Cp ((Tc–Ta)/Ra), Kustas and Norman 1997), where Hc is vegetation sensible heat flux (W m−2),
  Cp is therefore volumetric heat capacity of air (J m−3 K), Tc is canopy temperature (K), Ta is the air temperature at some reference height above the surface (K), and Ra is the resistance to heat transport (s m−1).
The canopy temperature gradient alone indicates heat capacity from forests (i.e. Q heat absorbed/release = C ΔTc, where C is specific heat capacity J (kg·K)−1, and ΔTc is temperature increase in forest canopy), the amount of heat required to raise the temperature of forests by one Kelvin degree. So, it indicates the ability of forests to absorb heat.
The canopy temperature in equation (1) is estimated from the 1.4 GHz L-band microwave (wavelength of 21 cm) SMOS/SMAP brightness temperature (Lee 2021), which usually represents the radiation of the canopy emission scattered at the surface, and attenuated through the canopy and atmosphere, and the soil emission attenuated by the canopy and atmosphere (Kerr et al 2012). Although L-band microwave radiometers are known to penetrate several centimeters in the depths (accurate penetration depth varies by soil moisture and texture) of soils with a VWC of up to 5 kg m−2 (Liu et al 2018), it seems implausible to penetrate 20–60 m tall trees and reach the soils. Thus, it is thought that the L-band satellite senses brightness temperature mainly from the top crown and trunk of vegetation canopy in dense forests rather than from the soil reflectivity (Link et al 2018). It is assumed that in dense forests, effective scattering albedo ω is negligible (0.03–0.06), indicating that extinction is primarily due to absorption (Wigneron et al 2017). The zeroth-order τ–ω model widely used for retrieving soil moisture does not apply to dense forests (Wang et al 2023).
The canopy temperatures can be retrieved from brightness temperatures (Kustas and Norman 1997, Lee 2021, Lee et al 2024). The directional radiometric surface temperature TR is estimated from SMOS and SMAP brightness temperature measurement TB at view angle θ and directional emissivity  (e.g. SMOS or SMAP brightness temperature divided by land surface temperature from independent sources), as follows (Kustas and Norman 1997, De Jeu and Owe 2003, Lee 2021):
where the nth power in the Stefan–Boltzmann equation is calculated as 1 (accordingly, not shown) for the L-band wavelength (21 cm) and a temperature range from 190 to 315 K (Becker and Li 1990), and the hemispherical temperature of the sky Tsky is 2.7 K. Soil reflectivity was neglected in dense forests, as stated above. Atmospheric contribution at L-band is significantly small, and does not largely affect a temporal evolution of brightness temperature (Reul et al 2012). Then, the canopy temperature TC is estimated from TR.
where Ts is the soil surface temperature, and f is the vegetation fraction as a function of the leaf area index (LAI) e.g. 1− exp(−0.5LAI/cosθ) (Kustas and Norman 1997). We applied this approach to forest land cover.
2.4. European centre for medium-range weather forecasts (ECMWF) land surface data
Several land surface variables were obtained from the ECMWF reanalysis data. Surface sensible heat flux, LAI, soil temperature, and land surface temperatures were obtained from ERA5 Land hourly data (Hersbach 2018, Bell 2020, Muñoz Sabater 2021)
3.1. Increments in canopy temperatures
The canopy temperature was found to increase continuously up to the point of ignition and flash-over stage. Figures 2(a) and (c) show pronounced increases in SMOS-derived canopy temperatures, rising from the lowest values up to the onset of fire activity in both Canada and the Sakha Republic, as indicated by arrows marking ignition dates. This trend suggests a prolonged endothermic preheating phase sufficient to initiate or intensify wildfires.
Figure 2. Temporal evolution over various fire burned areas (arrows show ignition dates): (a) spatial average of SMOS canopy and ERA5 land surface temperatures of each burned areas in 2023 Canadian wildfire, (b) spatial average of SMAP vegetation water contents (VWC) for the same burned areas as (a), (c) and (d) the same as (a) and (b) for 2021 Sakha Republic wildfires.
Download figure:
Standard image High-resolution image 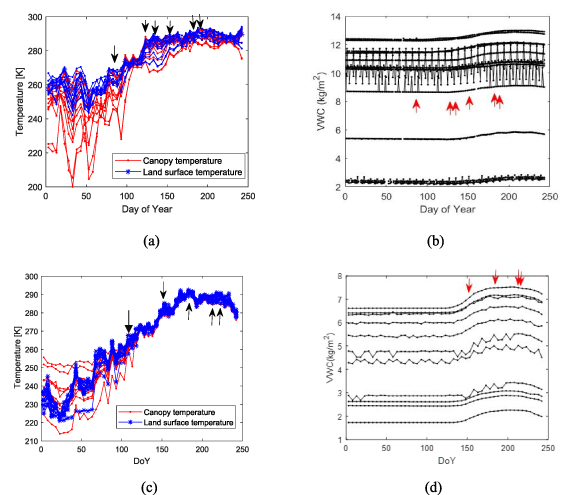
In 2023 Canada (figure 2(a)), canopy temperatures rose substantially—by approximately 40–50 K—between the lowest values in February and the early ignitions around day of year (DoY) 80–83. By the flashover stage near DoY 123, the temperature increase reached up to 80 K. Most ignitions occurred once canopy temperatures exceeded 285 K, following a non-flaming preheating period lasting ∼30 d prior to the earliest ignition at 270 K. During this phase, vegetation likely underwent progressive desiccation, thereby increasing fuel availability. Once this heat absorption threshold was surpassed and ignition began, the accumulated energy was rapidly released through flaming combustion.
In contrast, comparable increases in canopy temperature and associated vegetation desiccation as a consequence were not captured by ERA5 land surface temperature products prior to ignition. This discrepancy can be attributed to limitations of land surface models, which compute land surface temperature by solving the surface energy balance under the assumption of zero heat capacity in the surface layer (Trigo et al 2015). In the real world, the heat capacity of trees varies with their moisture content, invalidating this assumption for forested regions. These limitations also extend to satellite-based land surface temperature retrievals. Although surface emissivity is influenced by hydrological conditions, such as rain or snow cover, it is typically simplified as a linear function of NDVI (Wang et al 2008), which inadequately represents forest dynamics.
Similarly, thermal development and pre-heating fuel conditions were poorly reflected in SMAP-derived VWC (figure 2(b)). No significant decrease in VWC was observed around ignition events. Ideally, VWC should have declined prior to or at least following fire occurrence, yet it instead showed an anomalous increase (Lee et al 2024). As briefly discussed above, this discrepancy likely arises from the retrieval algorithm’s reliance on 10 d NDVI climatology composites (2000–2010) from Terra/MODIS data (Entekhabi et al 2014), which does not adequately reflect short-term vegetation dynamics in response to fire events.
In the 2021 Sakha Republic fires (figure 2(c)), SMOS canopy temperatures were similar in magnitude to ERA5 land surface temperatures, suggesting little discrepancy between the two metrics. This consistency may reflect relatively stable snow cover and vegetation moisture conditions during that year, as compared to Canadian wildfires (this will be further discussed in section 3.4 and figure 7). On average, land surface temperature was lower in Sakha Republic (265 K) than in Canada (274.4 K).
Interestingly, two temperature metrics (canopy vs. land surface) exhibited contrasting indications regarding fire severity. Based solely on land surface temperature, burned areas in the Sakha Republic (ΔT ≈ 65 K) should have exceeded those in Canada (ΔT ≈ 40 K). However, the opposite occurred: Canadian wildfires burned substantially larger areas (7998 611 ha) than those in the Sakha Republic (1952 417 ha). The extent of fire spread more closely aligned with canopy temperature differences (ΔT ≈ 88 K in Canada vs. 65 K in Sakha Republic), suggesting canopy temperature is a more reliable predictor of wildfire spreads than land surface temperature. Similarly to figure 2(b), fire dynamics were not adequately captured by SMAP VWC in figure 2(d). No pre-ignition warning signals were detected, as VWC unexpectedly increased. It should have declined as the fire event approached.
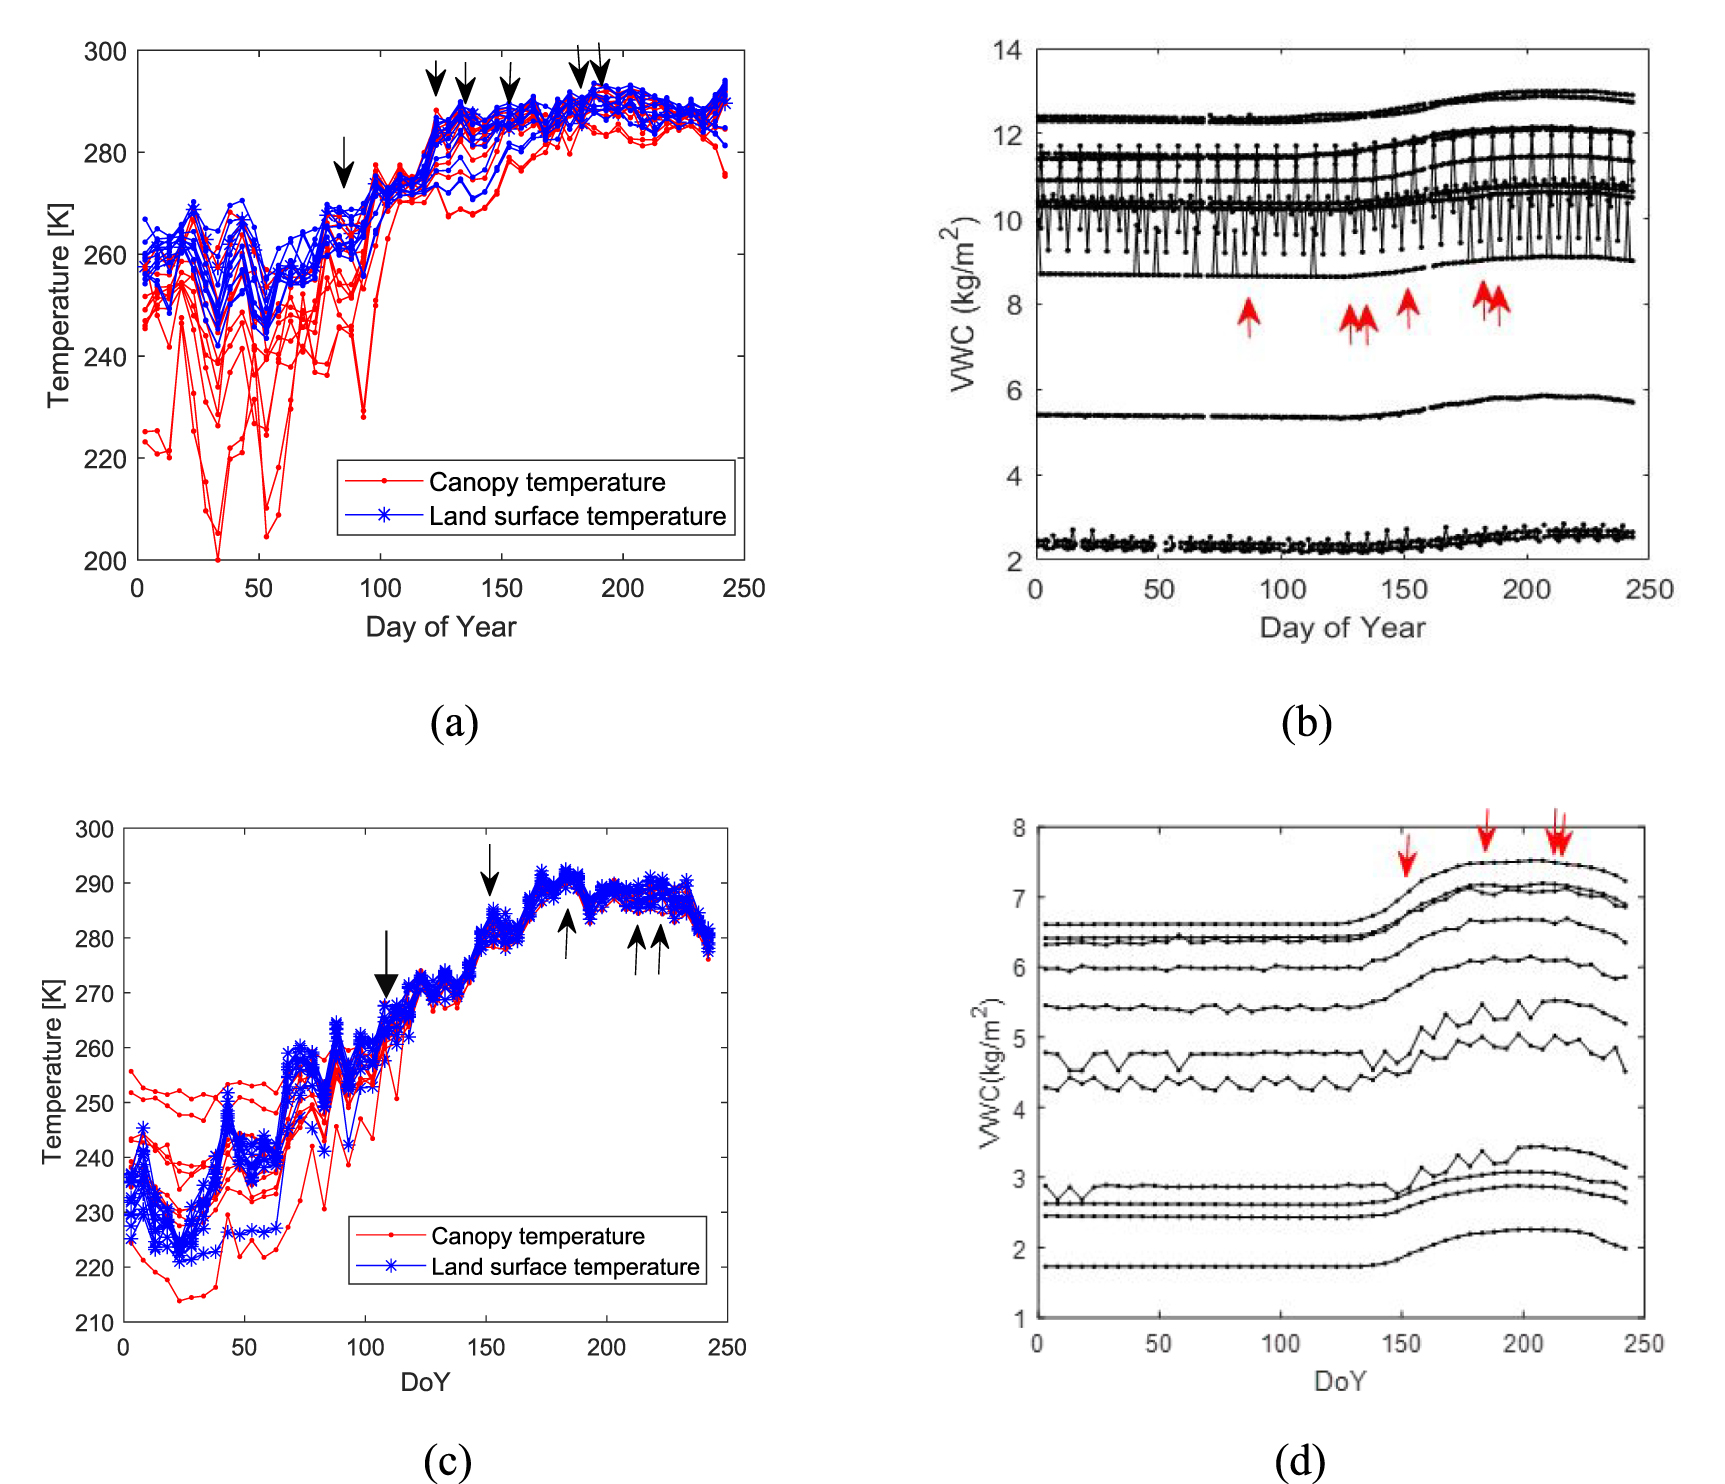
Figure 3 presents 5 day averaged spatial distributions of pre-fire canopy temperature across Canadian burned areas. The spatial patterns reveal that wildfires ignited in regions where canopy temperatures had already risen, indicating pre-heating and desiccation of fuels (yellow regions in figure 3(a)). As fires progressed toward flashover, pre-fire canopy temperatures further increased and expanded (yellow regions in figure 3(b)), corresponding to wildfire spread within these hotspot areas. At the peak flashover stage (figure 3(c)), pre-fire canopy temperatures became more intense and spatially extensive, aligning with continued wildfire expansion later on.
Figure 3. Spatial distribution of 5 d-averaged SMOS canopy fuel temperatures over 2023 Canadian wildfires before following ignition dates (red polygons indicate areas ignited; cyan polygons show areas not ignited yet): (a) DoY 86 (b) DoY 130 (c) DoY 180 figure 3. Spatial distribution of 5 d-averaged SMOS canopy fuel temperatures over 2023 Canadian wildfires before following ignition dates (red polygons indicate areas ignited; cyan polygons show areas not ignited yet): (a) DoY 86 (b) DoY 130 (c) DoY 180.
Download figure:
Standard image High-resolution image 
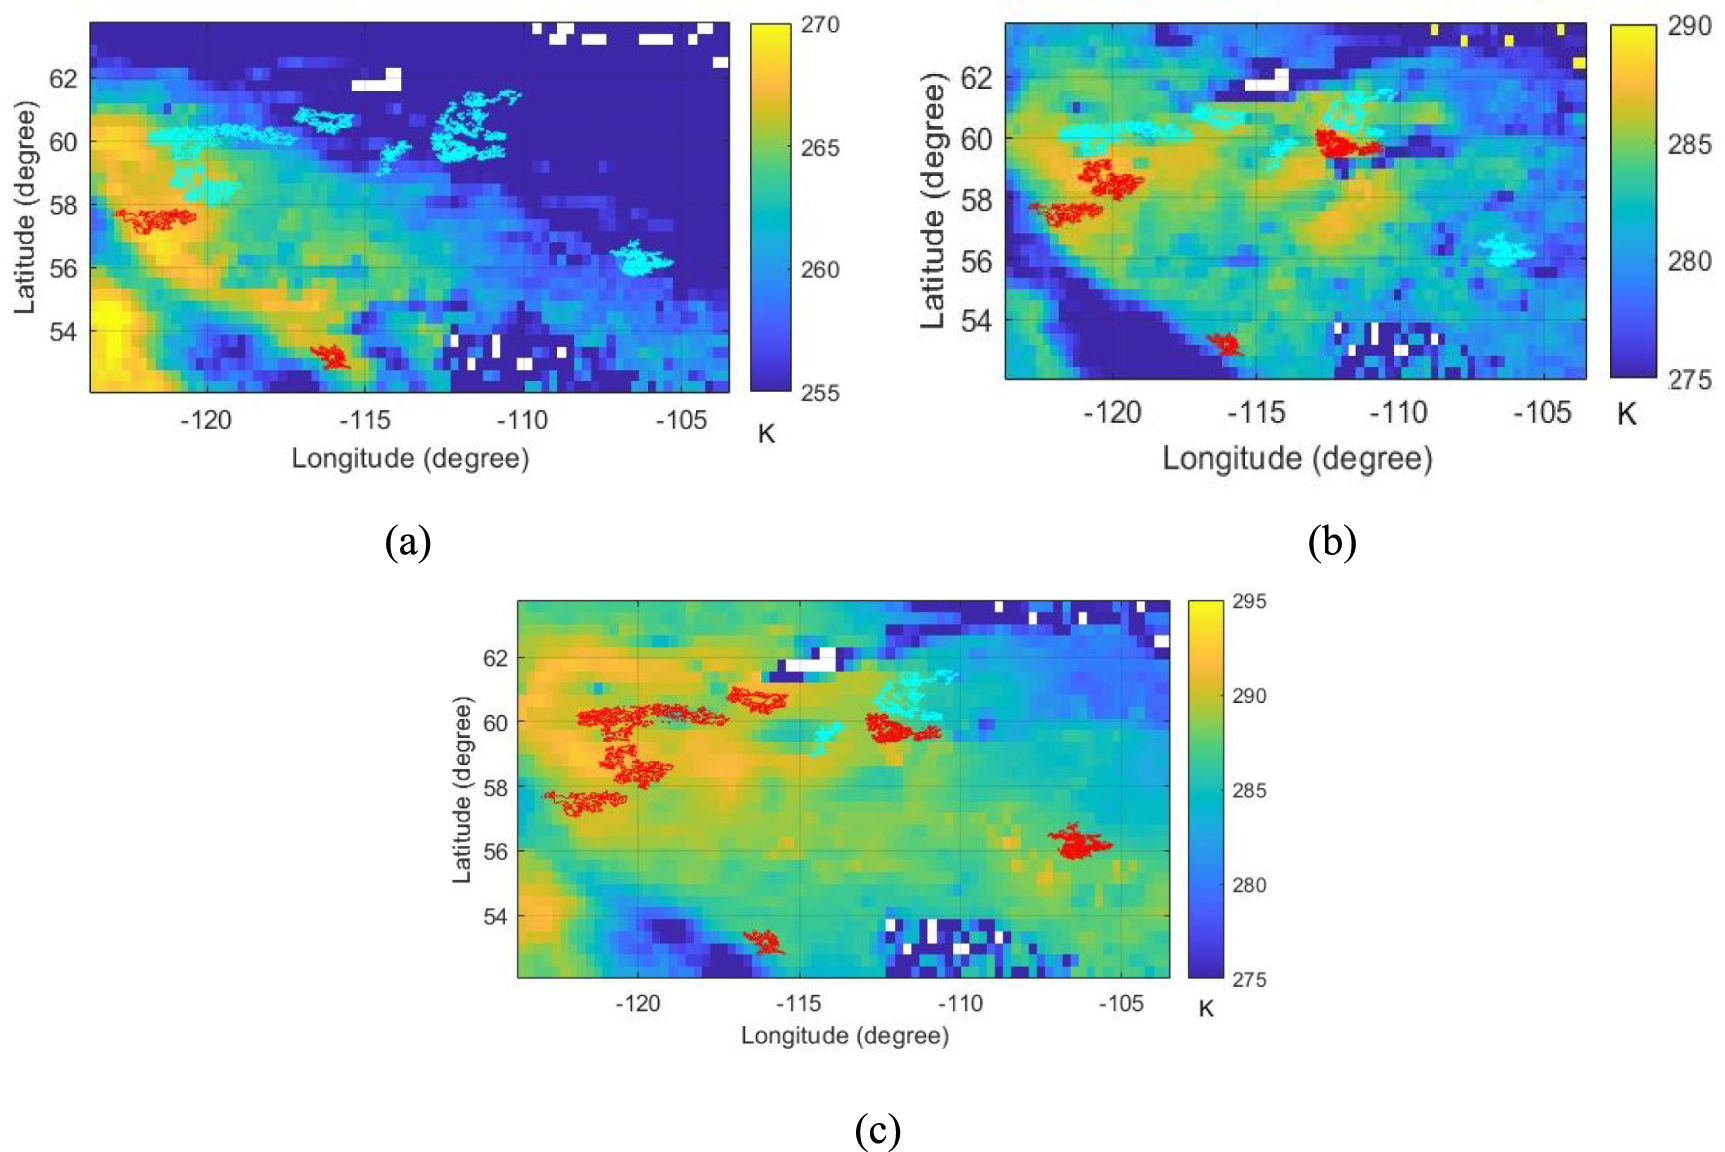
Similarly, figure 4 illustrates 5 d averaged spatial distributions of pre-fire canopy temperatures over the Sakha Republic burned areas across ignition dates. Fires ignited predominantly in hotspot regions where canopy temperatures exceeded 270 K, suggesting several days of preheating and desiccation. As in Canada, canopy temperatures rose and expanded during the incipient stage, facilitating fire spread along hotspot regions. Few wildfires occurred where canopy temperatures remained low (blue regions in figure 4), reinforcing canopy temperature as a potential early-warning indicator of wildfire risk.
Figure 4. Spatial distribution of 5 d-averaged SMOS fuel temperature over 2021 Sakha wildfires before the following ignition dates (black polygons are fire areas): (a) DoY 214–215 (b) DoY 216–218 (c) DoY 219–223.
Download figure:
Standard image High-resolution image 
3.2. Pre-fire SMOS canopy vs ERA5 land surface temperature increments in relation to fire spread
We also found that pre-fire canopy temperatures in forests influence fire spread. Figure 5 shows the relationship between pre-fire temperature increments at incipient stages (e.g. temperature increases measured from the lowest temperature until ignition stages) and burned areas for all ignition dates. Although the correlation with land surface temperatures was weak or absent, we found a positive relationship between pre-fire canopy temperatures and final burned areas. Notably, the antecedent canopy temperature increase in Canadian wildfires (20–53 K) was greater than that in wildfires in the Sakha Republic (15–35 K). This gradient of canopy temperatures aligns well with the fire-burned areas: Canadian wildfires (7998 611 ha, correlation ρ of canopy temperatures Tc = 0.52, ρ of land surface temperatures LST = 0.07) and Sakha wildfires (1,952,417 ha, ρ of Tc = 0.5, ρ of LST = 0.017). Although the correlation with canopy temperature can be shown to some extent, a perfect linearity (e.g. ρ > 0.9) is not expected. The relationship between fuel temperature and fire spread is fundamentally nonlinear, as fires spread radically and abruptly once a threshold is exceeded.
Figure 5. Relationship between pre-fire SMOS canopy or ERA5 land surface temperature increments and fire-burned areas: (a) 2023 Canadian wildfires (correlations ρ of SMOS canopy temperatures Tc = 0.52, ERA5 land surface temperatures LST = 0.07, P-values of Tc = 0.08, LST = 0.83); (b) 2021 Sakha wildfires (ρ of Tc = 0.5, LST = 0.02, P-values of Tc = 0.14, LST = 0.96).
Download figure:
Standard image High-resolution image 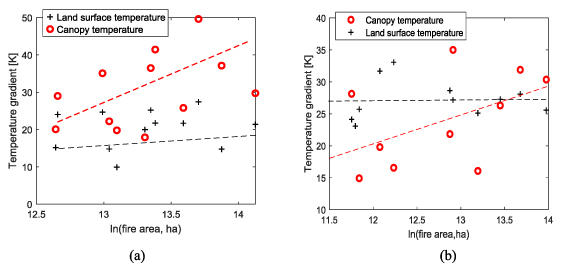
By combining figure 2 with 5 to investigate which temperatures better represent the preheating process (fuel dehydration) in forests that will make them more vulnerable to ignition and fire spread, we suggest that a short-term nonlinear increase in canopy temperatures effectively indicates fuel availability and warns of fire spread ahead of the flames. In other words, a higher antecedent canopy temperature gradient results in greater surface heating and more intense fire spread, leading to destructive megafires, as seen in Canada, due to significant heat absorption at the incipient stage.
3.3. Impact of pre-fire SMOS canopy on ERA5 sensible heat
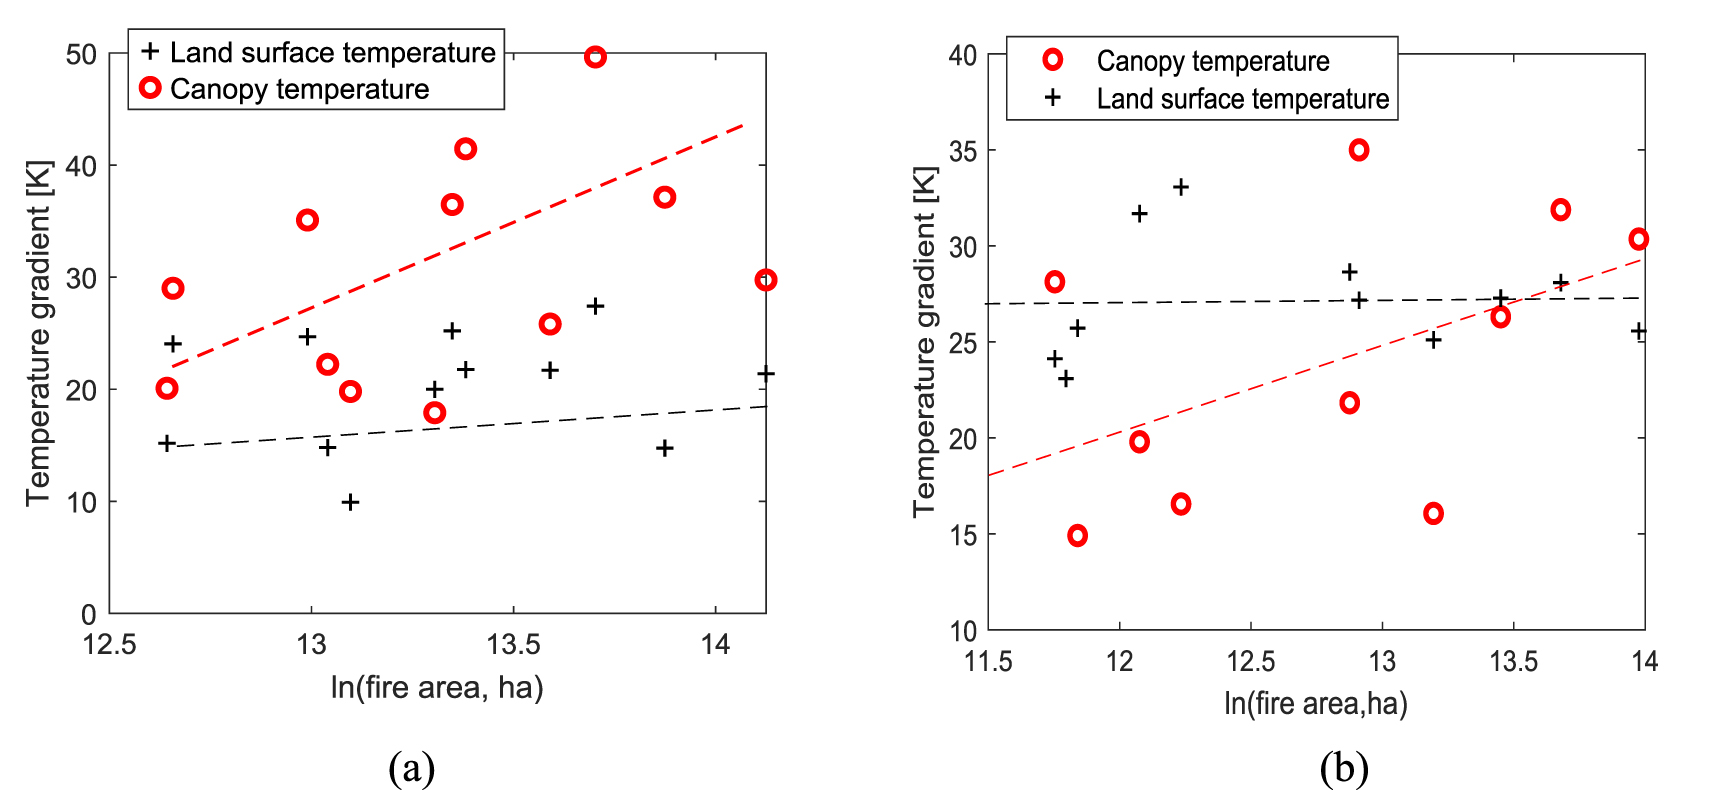
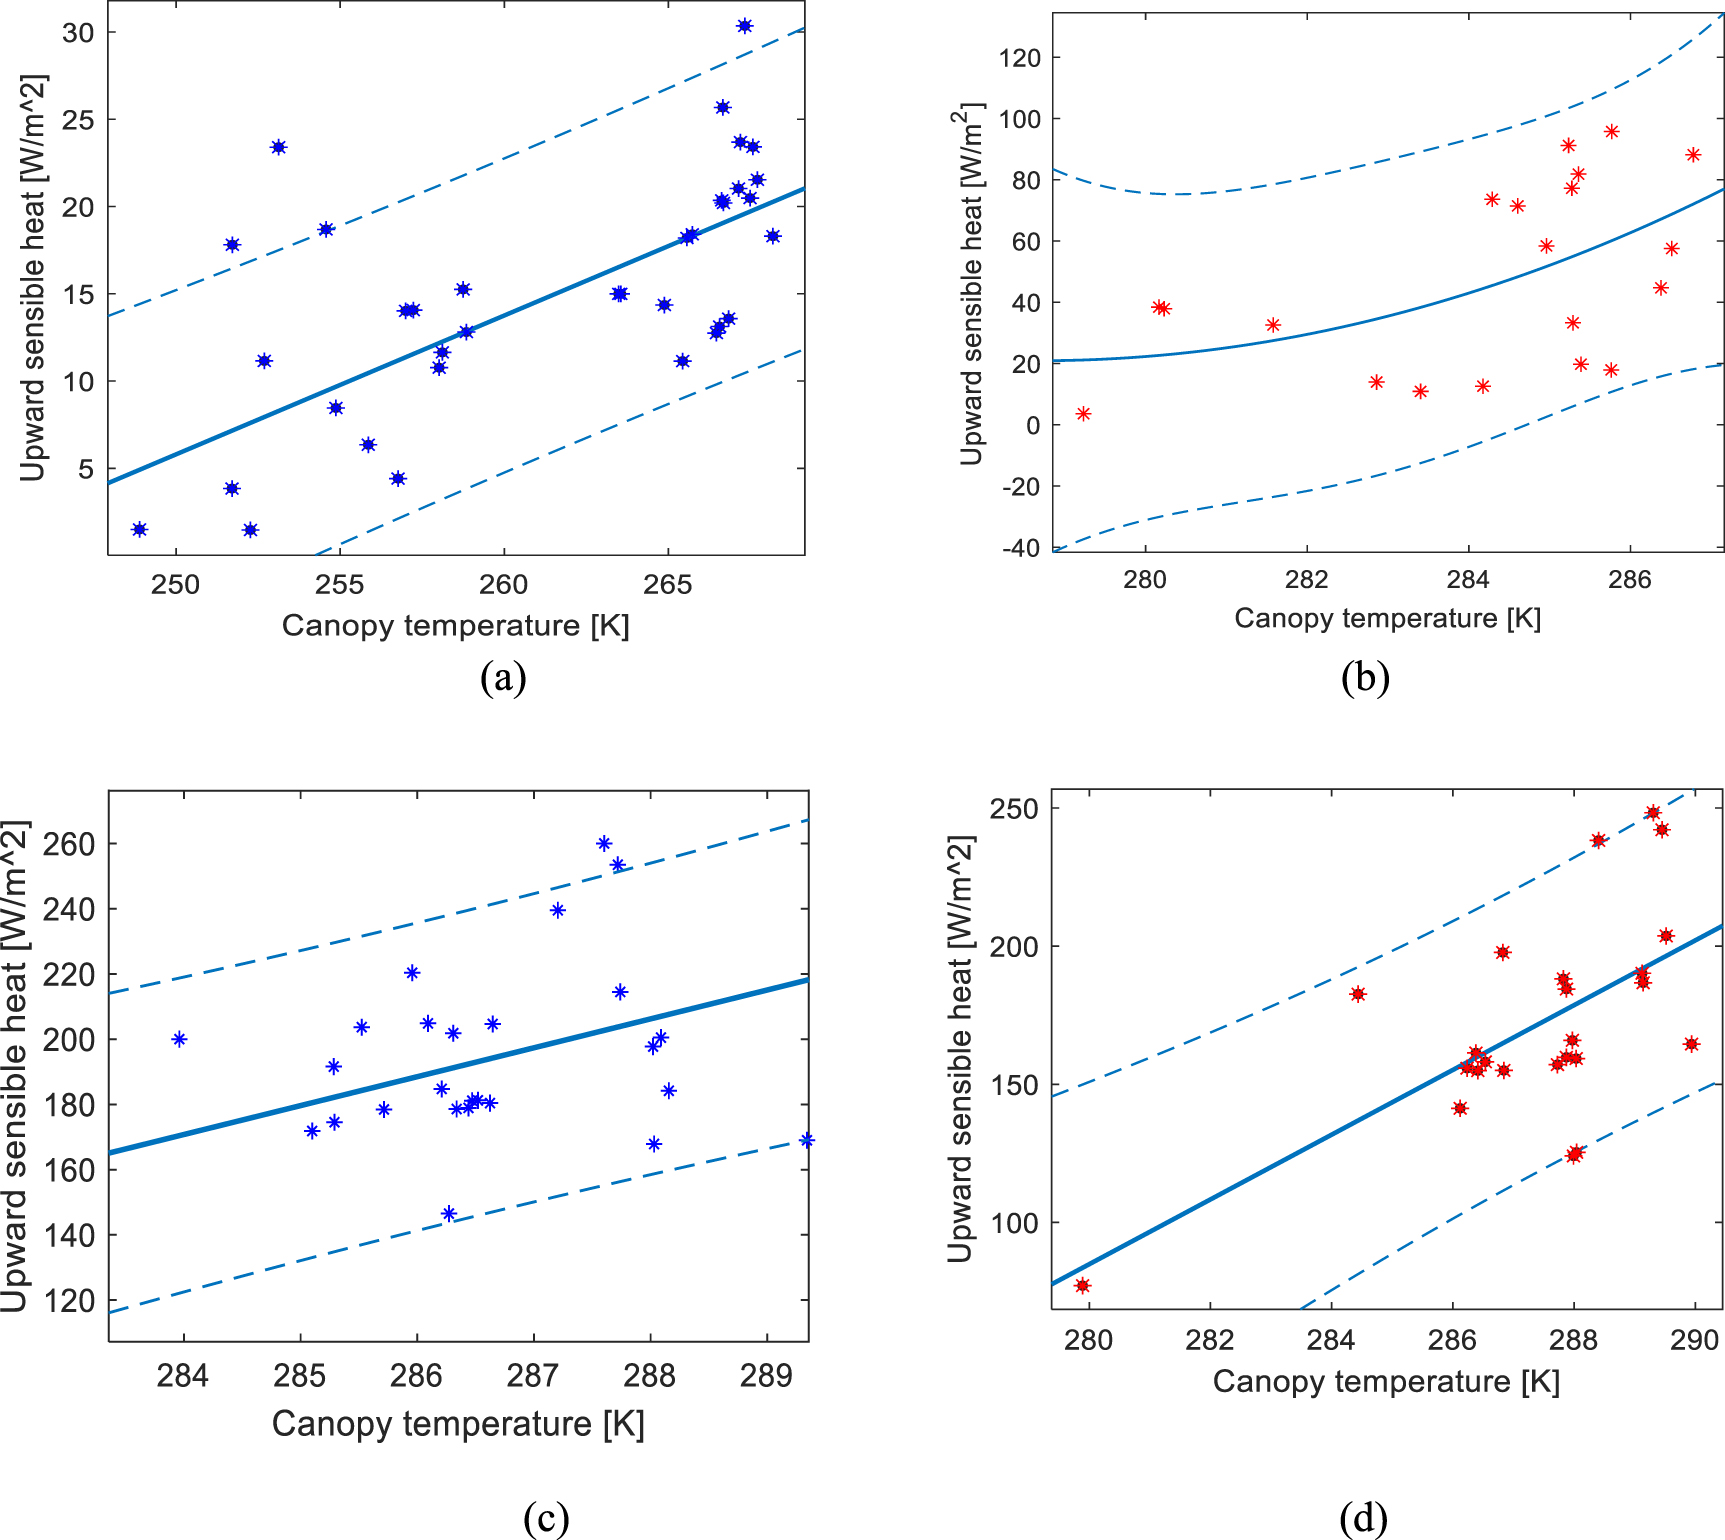
As equation (1) indicates, an increase in canopy temperature signifies an increase in sensible heat and a preheating process that facilitates ignition and dries fuel. This is well illustrated in figure 6, where canopy temperatures are positively related to elevated sensible heat ahead of the flames. Figures 6(a) and (b) show that upward sensible heat increased with canopy temperature for 7 d before the ignitions in Canadian wildfires (ρ = 0.67 and 0.51 on different ignition dates). Here, upward surface sensible heat indicates that vegetation is warmer than the air temperature, meaning that preheated, endothermic vegetation fuels released sensible heat into the air. Similarly, figures 6(c) and (d) also show that sensible heat in Sakha wildfires increased with the canopy temperature prior to different ignitions (ρ = 0.56 and 0.63). However, a direct comparison of sensible heat between the Sakha and Canadian regions is not possible. Due to diurnal variations in sensible heat, higher sensible heat in Sakha fire areas than in Canadian wildfires does not necessarily indicate higher fire energy.
Figure 6. Relationships between pre-fire 7 d-averaged SMOS canopy temperature and ERA5 upwards sensible heat: (a) 2023 Canadian fire areas before the ignition date DoY 86 (ρ = 0.67, P-value= 1 × 10⁻⁵) (b) 2023 Canadian fire areas before ignition date DoY 131 (ρ = 0.51, P-value = 0.02), (c) 2021 Sakha fire areas before the ignition date DoY 214 (ρ = 0.56, P-value = 0.0022) (d) 2021 Sakha fire areas before the ignition date DoY 216 (ρ = 0.63, P-value = 9 × 10⁻⁴), dash-line: 90% confidence levels.
Download figure:
Standard image High-resolution image 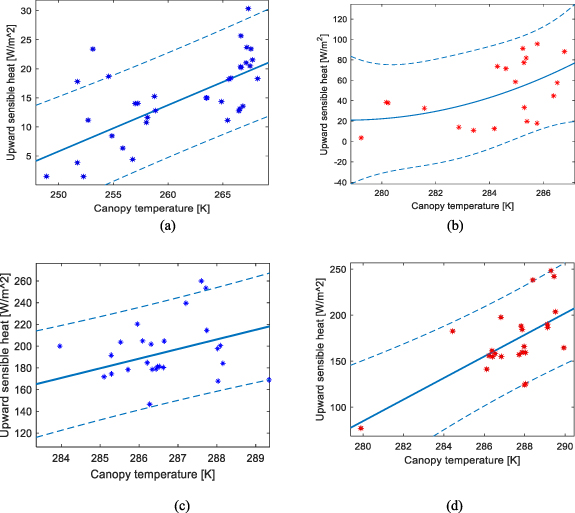
When combining figures 5 and 6, it becomes clear that canopy-associated sensible heat contributed to fire spread. We suggest that surface heating desiccates fuel, increases fuel availability, and accelerates fire spread. This correlation was more pronounced when temperature gradients were larger in Canadian wildfires compared to the Sakha regions. It is thus suggested that forest warming initiated heat-amplifying feedback, intensifying fire spread (Teuling et al 2010, van Heerwaarden and Teuling 2014). In other words, once warmed forests release sensible heat to the atmosphere, this warmed air further heats the forests again, thereby generating a positive feedback loop of heat amplification. To monitor forests under heatwaves, canopy temperature in the SMOS/SMAP retrieval algorithms or hydrological modeling cannot be replaced with air or land surface temperature (Essery et al 2008).
3.4. Comparison between MODIS snow cover and ERA5 sensible heat
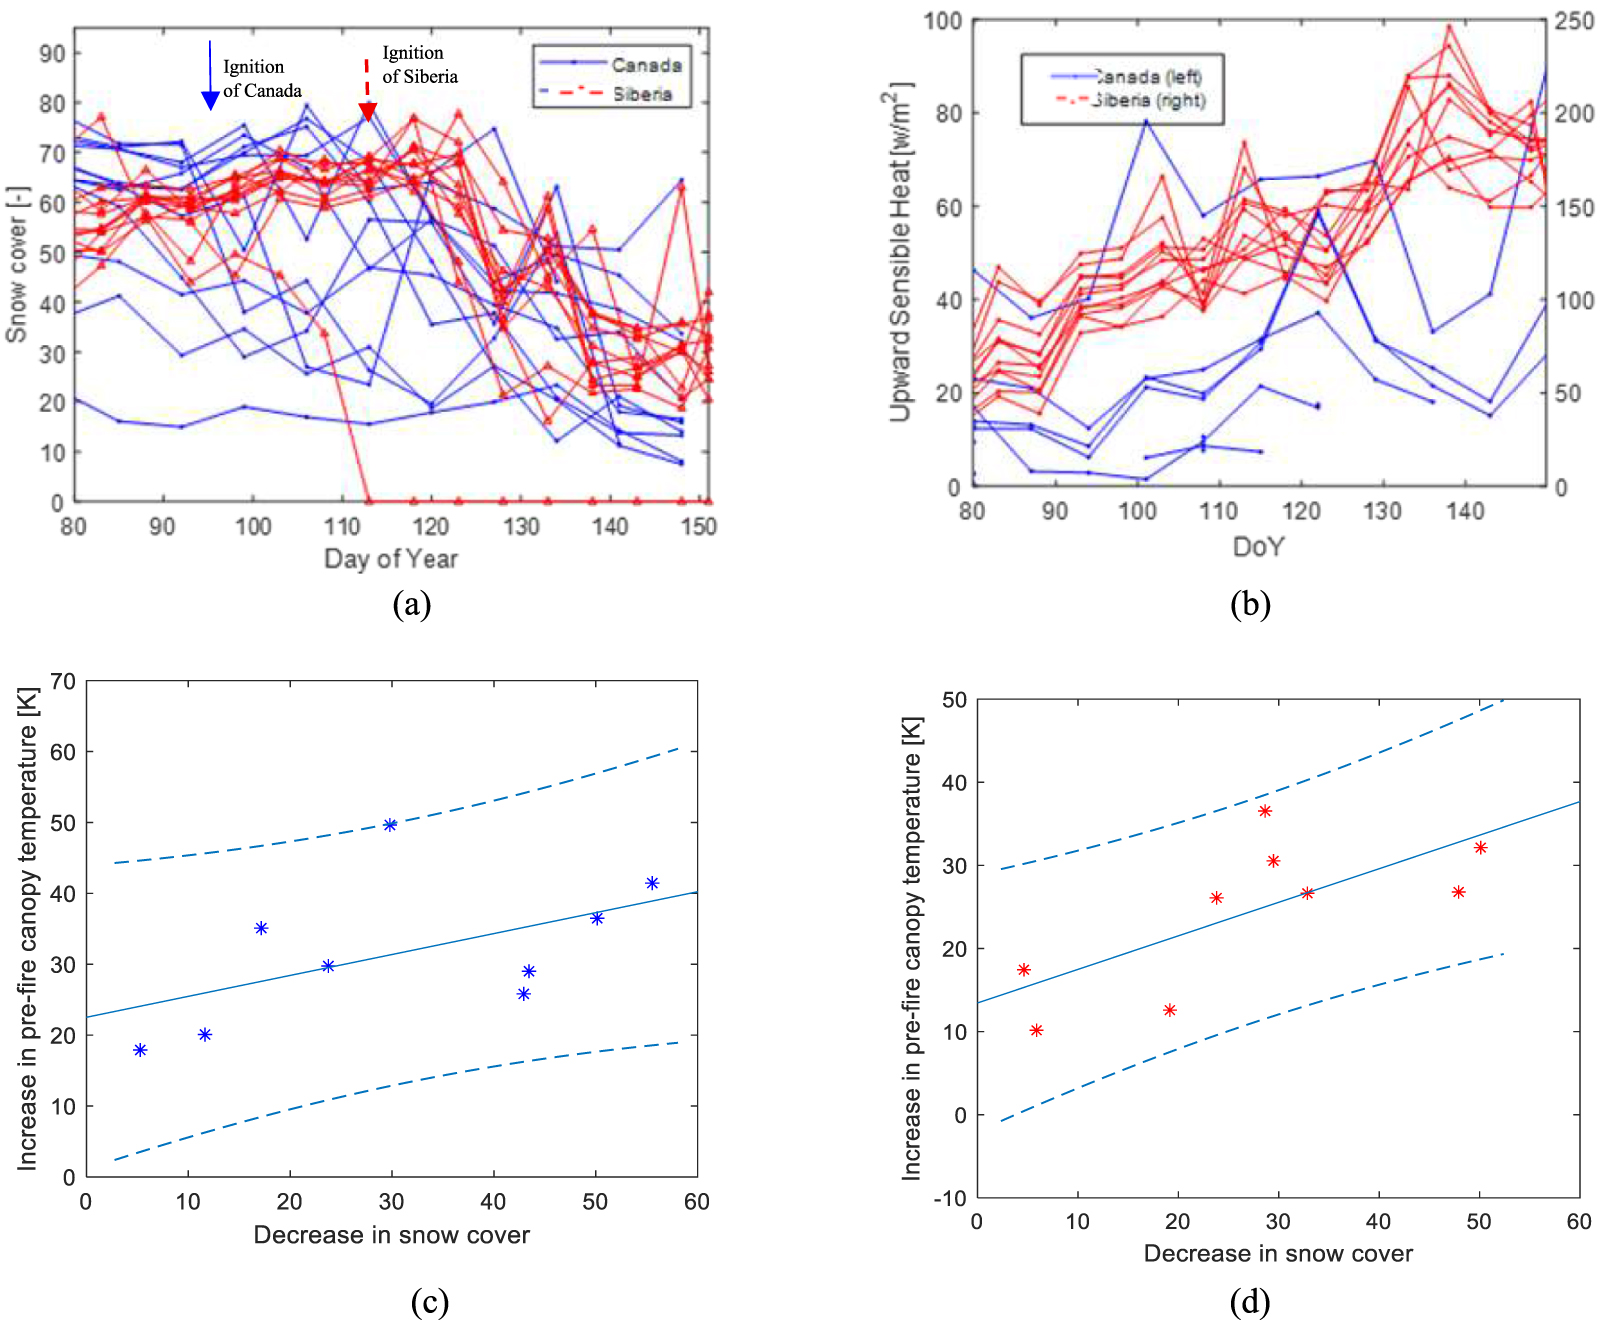
We also investigated whether the heat-amplifying feedback of forests influenced snowmelt. Figures 7(a) and (b) show that as upward sensible heat (Tc > Tair) transfers energy to the snow, the snow consequently melts, suggesting that forest heating plays a hydrological role. In figure 7(b), the upward sensible heat of Canadian wildfire areas increased until ignition, but slightly decreased around DoY 140 after the ignition dates. This decrease was due to an increase in downward sensible heat as large-scale wildfires reached the flash-over stage. In contrast, for Sakha wildfires, where burned areas that will release downward sensible heat were relatively smaller, there was a consistent increase in upward sensible heat, as expected. An increase in sensible heat was found to contribute to snow melt.
Figure 7. Relationship between pre-fire SMOS canopy temperature, ERA5 sensible heat and MODIS snow cover over various fire burned areas: (a) time-series snow-melt (b) time-series sensible heat (c) an increase in antecedent canopy temperature (DoY 29–98) and subsequent snowmelt (DoY 100–148) for Canadian fire areas (ρ = 0.62, P-value = 0.07) (d) an increase in antecedent canopy temperature (DoY 26–98) and subsequent snowmelt (DoY 116–147) for Sakha fire areas (ρ = 0.73, P-value = 0.02). Dash-line: 90% confidence levels.
Download figure:
Standard image High-resolution image 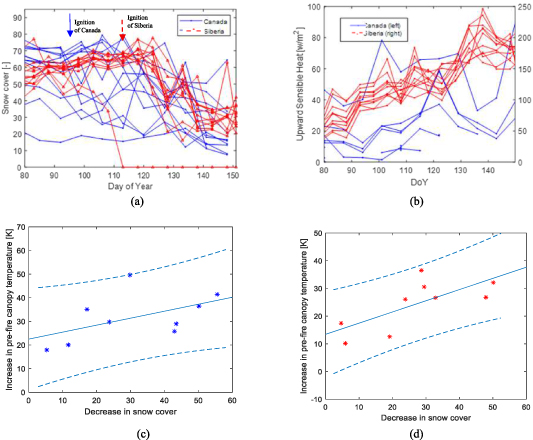
In high-latitude regions with uneven snow distribution, as shown in the Canadian areas of figure 7(a), sensible heat from snow-free areas or warmed canopies accelerates thermal advection and increases the rate of snowmelt. This leads to horizontal heat transfer to adjacent snow patches (Marsh et al 1997). The relationship between warmed canopies and subsequent snowmelt is clearly illustrated in figures 7(c) and (d) (ρ = 0.62 and 0.73 for the Canadian and Sakha Republic regions, respectively). This is because the sensible heat absorbed by the canopy can contribute to snow-melt. Through the latent heat of sublimation or melting, the phase change of snow or ice directly into water or vapor occurs. If combining sections 3.3 and 3.4. With section 3.5, it is thus suggested that the warmed forests not only heat the surrounding air, creating heat-amplifying feedback with the atmosphere, but in regions with snow cover, it also accelerates snowmelt through sensible heat, leading to an increase in evapotranspiration. This further reduces vegetation moisture, thereby decreasing fuel moisture levels and increasing fuel availability. Thus, when combining figures 2 and 5 with 7, it is suggested that forest warming influences both snowmelt and fire spread.
Despite the paradoxical role of forests, they are generally considered carbon sinks in most carbon policies, including Nature-Based Solutions. As a result, afforestation and reforestation have been widely accepted as major carbon mitigation strategies. However, while the largest terrestrial carbon storehouses have transitioned into significant carbon emitters and expanded as fire fuels, NRT (Near Real-Time) monitoring of whether forests are developed into carbon sinks or fire fuels has not yet been operationalized.
In this study, we explored the heat storage capacity of forests under warming conditions and their amplifying effects on wildfire spread and snowmelt. Because SMOS canopy temperature effectively captured the preheated, endothermic vegetation condition in cold regions over periods of several days or weeks preceding ignition—an essential prerequisite for megafires, we suggest that L-band microwave-retrieved fuel temperature is more effective for observing vegetation heat transfer, as compared to ERA5 land surface temperature or canopy temperatures from infrared sensors, which are often hindered by cloud or smoke cover. In addition, SMAP VWC provided limited insight into the nonlinear, abrupt dynamics of fuel conditions at temporal scales of several days or weeks, likely due to their reliance on NDVI climatology data.
The increase in pre-fire antecedent canopy temperature correlated positively with decreased pre-fire snow cover, increased sensible heat, and subsequent wildfire burned areas. This sequence suggests that the effects from forest heating will not be limited to heatwaves but will also create optimal conditions for triggering and spreading massive wildfires because warmed forests consequently enhance fuel availability and increase sensible heat from canopy temperature. For this reason, we suggest that monitoring canopy temperatures, which are often neglected under normal conditions, becomes critical under warming conditions or in snow-covered areas with uneven snow distribution. Detecting such forest warming with air or land surface temperature may be difficult.
In this context, we argue against unconditional reforestation and afforestation with high heat storage capacity, as this could inadvertently exacerbate heatwaves and contribute to unprecedented wildfire spread. Forests in low root zone soil moisture areas rarely photosynthesize, offering little benefit as carbon sinks. A more constructive strategy might involve selective logging based on satellite observations of forest heating or vegetation moisture or spacing trees appropriately not to deplete root zone soil moisture or further amplify thermal effects.
There is a caveat to using this approach. Because the retrieval of canopy temperature is sensitive to the accuracy of LAI data, the threshold or magnitude of canopy temperature may vary depending on the source of the LAI data (e.g. MODIS or ECMWF). To compare different studies and regions, it is first necessary to examine the input data sources. Future research will explore megafires in moist forests, such as Amazon rainforest fires, to investigate the impact of reduced deforestation in warming environments on the occurrence of wildfires.
We thank Bill Kustas for providing discussions on the canopy temperature. We would like to thank Natural Resources Canada, Canadian Forest Service, Northern Forestry Centre, Edmonton, Alberta, for providing the Canadian National Fire Database (https://cwfis.cfs.nrcan.gc.ca/ha/nfdb) and the journal for their support with the Article Processing Charge.
The data that support the findings of this study are available upon reasonable request from the authors.