1748-9326/20/11/114083
Abstract
The deliberate addition of sulfur dioxide in the stratosphere to form reflective sulfate aerosols, reflect sunlight, and reduce surface temperatures is increasingly being considered as an option for minimizing the impacts of climate change. This strategy would create an unprecedented climate where the relationship between surface temperature and carbon dioxide concentration is decoupled. The implications of stratospheric aerosol intervention (SAI) for global crop protein concentrations have not yet been explored. While elevated CO2 concentrations are expected to reduce crop protein, higher temperatures may increase crop protein concentrations. Here we report changes of maize, rice, soybean, and wheat protein concentrations under a medium emissions…
1748-9326/20/11/114083
Abstract
The deliberate addition of sulfur dioxide in the stratosphere to form reflective sulfate aerosols, reflect sunlight, and reduce surface temperatures is increasingly being considered as an option for minimizing the impacts of climate change. This strategy would create an unprecedented climate where the relationship between surface temperature and carbon dioxide concentration is decoupled. The implications of stratospheric aerosol intervention (SAI) for global crop protein concentrations have not yet been explored. While elevated CO2 concentrations are expected to reduce crop protein, higher temperatures may increase crop protein concentrations. Here we report changes of maize, rice, soybean, and wheat protein concentrations under a medium emissions climate change scenario and a SAI scenario to maintain global average temperatures at 1.5 °C above preindustrial levels, as simulated by three global gridded crop models. We show that using SAI to offset surface temperature increases would create decreases in the global protein concentrations of maize and rice, with minimal impact on wheat and soybean. Some already protein-deficient and malnourished nations that rely heavily on these crops to meet protein demands would show large decreases in protein intake under SAI with the current diet pattern, which could exacerbate their nutrient scarcity. The range of results between crop models highlights the need for a more comprehensive analysis using additional crop models, climate models, a broader range of climate intervention scenarios, and advancements in crop models to better represent protein responses to climate changes.
Export citation and abstractBibTeXRIS
As the impacts of climate change worsen, climate intervention methods to reflect sunlight and reduce surface temperatures are being examined. One of the proposed climate intervention methods would involve deliberately maintaining a persistent sulfate aerosol layer in the stratosphere to reflect a fraction of incoming sunlight [1]. Since this strategy would not mitigate atmospheric carbon dioxide (CO2), it would not perfectly counteract anthropogenic climate change but would instead create a novel climate where the relationship between surface temperature and atmospheric CO2 is decoupled [2].
Previous crop modeling studies have indicated that the production of major crops may increase [3, 4] or be minimally impacted [5, 6] by stratospheric aerosol intervention (SAI) relative to climate change, with impacts varying by region [7], crop type [8], and crop model used [9]. However, those studies have focused on crop yields and have not accounted for changes to crop quality, such as crop protein concentration. Protein is a key macronutrient that underpins human nutrition, and its availability in staple crops is critical for dietary quality and food security [10]. An estimated 1.4 billion people will be at risk of protein deficiency by the year 2050, which is expected to be made worse by elevated CO2 concentrations [10, 11]. Enhanced crop growth due to elevated CO2 fertilization is associated with reduced concentrations of other elements, such as nitrogen [12, 13], an indicator for crop protein concentration. There is evidence from field experiments that elevated CO2 has the potential to significantly reduce the protein concentration of major food crops, such as wheat [14] and rice [15, 16]. While these cereals are primarily sources of carbohydrates, they also provide a substantial share of dietary protein for large portions of the global population [11]. Higher CO2 increases carbohydrate accumulation through CO2 fertilization, which dilutes the crop nitrogen content and inhibits nitrate assimilation, thus limiting the nitrogen available for protein synthesis and reducing crop protein concentration [11, 14]. Furthermore, elevated CO2 reduces the concentration of the nitrogen-rich enzyme Rubisco, which further lowers nitrogen and protein levels in key crops such as wheat and rice [17].
While the impact of rising temperatures on crop nutritional quality is less understood, there is growing evidence that this could have a positive impact on crop nutritional quality, potentially helping to safeguard some of the negative effects of rising CO2 [18–20]. Field experiments found that with a 1.2 °C–2.5 °C warming relative to the average temperature during the late 20th Century, nitrogen and protein concentrations may increase in maize, rice, and wheat by enhancing nitrogen uptake and translocation through increased transpiration, as well as by accelerating nitrogen mineralization and plant metabolic rates [18, 20]. However, with extreme high temperature, nitrogen and protein concentrations can be reduced as the heat stress diminishes nitrogen assimilation [21]. Since SAI would reduce surface temperature increases while maintaining elevated CO2, it has the potential to further reduce crop protein concentrations below what may occur with climate change alone.
This study uses three global gridded processed-based crop models: the Community Land Model version 5 crop model (CLMcrop) [22], the parallel Decision Support System for Agrotechnology Transfer global crop model (pDSSAT) [23, 24], and the Lund–Potsdam–Jena General Ecosystem Simulator crop model (LPJ-GUESS) [25] that simulate grain carbon and nitrogen concentration responses to changing CO2, temperature, precipitation, humidity, and radiation under future climates. The three global gridded crop models were forced by atmospheric output from the Community Earth System Model version 2 (CESM2) that simulated the future climate change scenario Shared Socioeconomic Pathway (SSP) 2 with Representative Concentration Pathway 4.5 (SSP2-4.5) and the Assessing Responses and Impacts of Solar climate intervention on the Earth system with stratospheric aerosol injection (ARISE-SAI-1.5 C) [26] scenarios. ARISE-SAI-1.5 C uses stratospheric sulfate aerosol intervention to maintain 1.5 °C above preindustrial levels under SSP2-4.5 (see methods for details). All other crop model inputs held constant, meaning the impact on crop protein are due entirely to changes to the climate under future climate change and SAI.
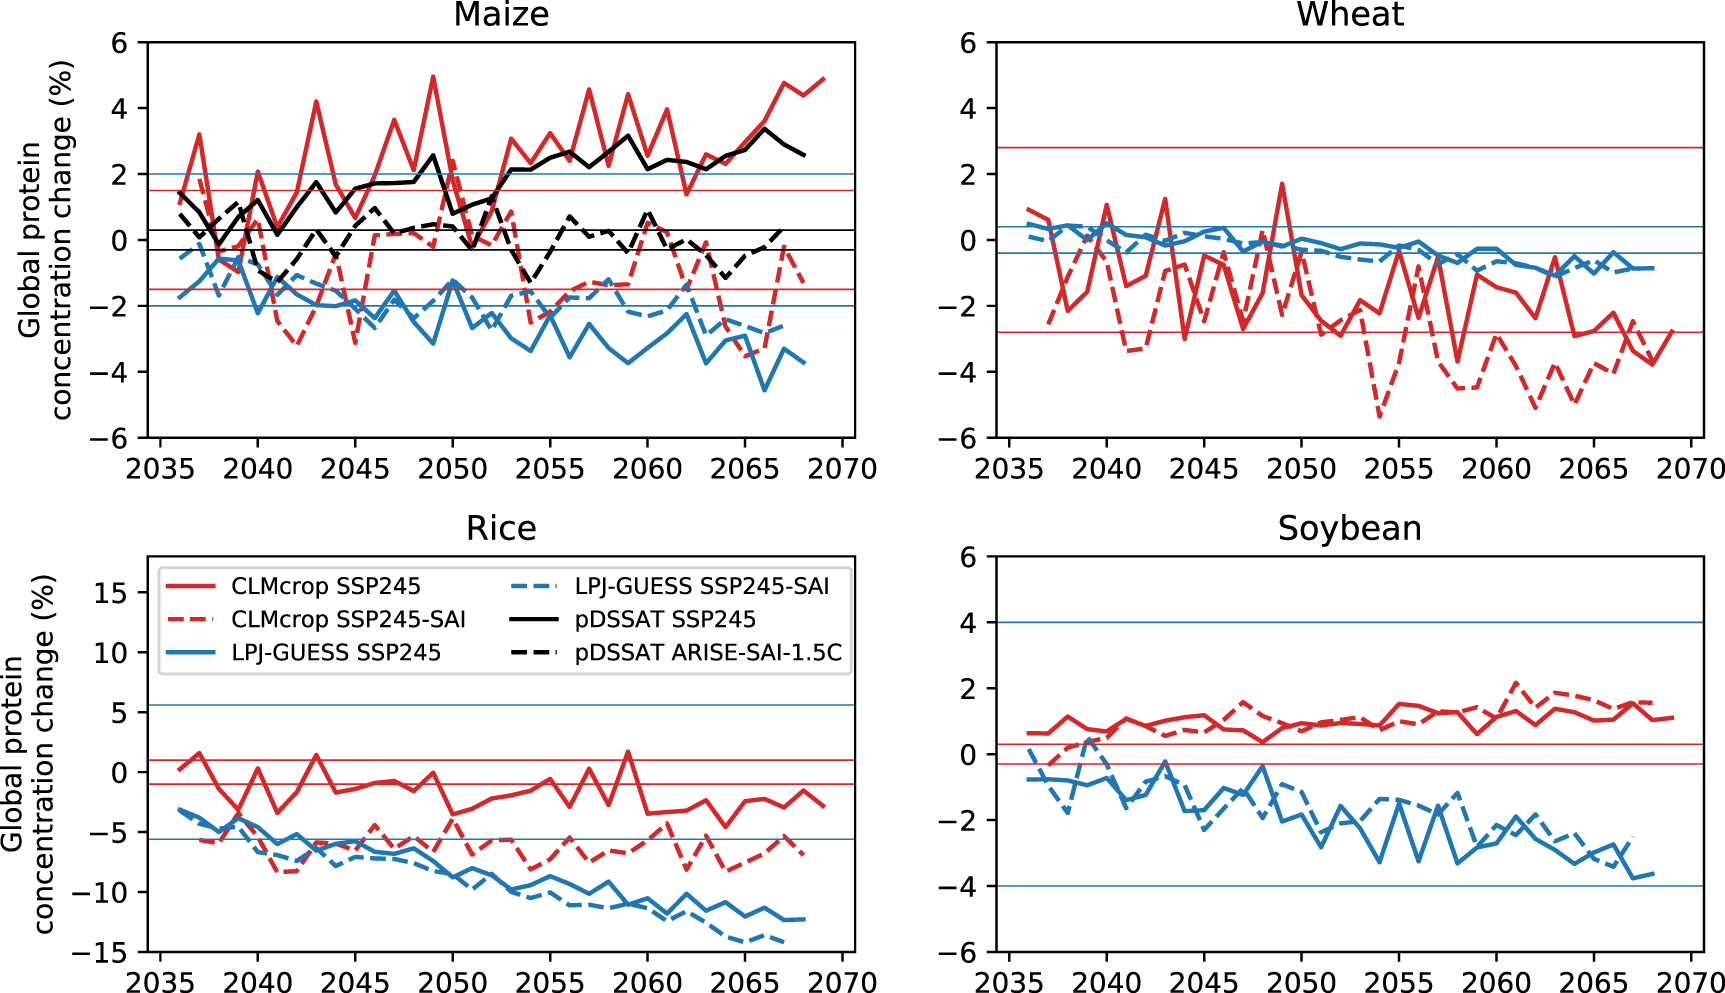
Under future climate change, maize protein concentration increases over time in CLMcrop and pDSSAT, while LPJ-GUESS shows a decreasing trend. Different model responses may arise from variations in how they represent the negative effects of elevated CO2 on protein synthesis and the positive impacts of warming (figure 1). Maize, as a C4 crop, has a mechanism to concentrate CO2 at the Rubisco enzyme site, reducing its susceptibility to the CO2 fertilization effect [27]. Consequently, the positive impact of warming on maize protein may outweigh the negative impact of the ‘dilution’ effect, which is consistent with the results in the CLMcrop and pDSSAT. CLMcrop also shows an increase in protein concentration for soybean under SSP2-4.5, a slight decrease in wheat within the range of natural variability, and no change in rice (figure 1). In contrast, LPJ-GUESS shows a decreasing trend in protein concentration across all four crops, due to its low sensitivity to temperature [9]. Soybean, rice, and wheat are C3 crops and therefore their photosynthesis rate is limited by CO2 availability. Under climate change, with the CO2 fertilization effect, the ‘dilution’ process likely plays a significant role in determining the protein concentration of C3 crops [11, 28]. The simulated increase in soybean protein concentration under SSP2-4.5 in CLMcrop may be attributed to the ability of legumes to exchange extra carbon gained from CO2 fertilization with nitrogen fixed by the bacteria Rhizobium on the legume’s root nodules, thereby maintaining a balanced grain carbon to nitrogen ratio [29].
Figure 1. The annual time series of changes (%) to global average crop protein content (grain N/C ratio) for maize, rice, soybean, and wheat as simulated by CLMcrop (red), LPJ-GUESS (blue), and pDSSAT (black) under ARISE-SAI-1.5 C (2037–2069, solid lines) and SSP2-4.5 (2036–2069, dashed lines) relative to the reference period (2016–2025). Horizontal lines indicate ± one standard deviation of crop protein under the reference period for each model and crop. The pDSSAT model only simulated maize.
Download figure:
Standard image High-resolution image 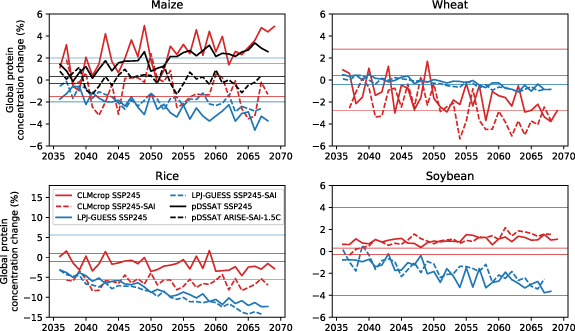
Compared to SSP2-4.5, the reduced surface temperatures under SAI tend to decrease protein in maize and rice, with milder impacts on wheat and soybean (figure 1). Towards the end of the simulations, global average maize protein decreases by approximately 7 percentage points in the CLMcrop and 3 percentage points in pDSSAT under SAI relative to climate change (figure 1). Similarly, there are decreases to global rice protein of about 5 percentage points under SAI relative to climate change in CLMcrop throughout the simulations. SAI slightly decreases wheat protein concentration in CLMcrop towards the end of the simulations relative to SSP2-4.5. Cooling due to SAI may reduce nitrogen uptake, disrupt nitrogen assimilation pathways, and diminish the potential positive effects of warming on crop protein production under SSP2-4.5 [18, 21]. In contrast, LPJ-GUESS shows minimal differences in protein concentration in four crops under SAI relative to climate change, as LPJ-GUESS has been shown to have a weak response to temperature changes [9] (figure 1).
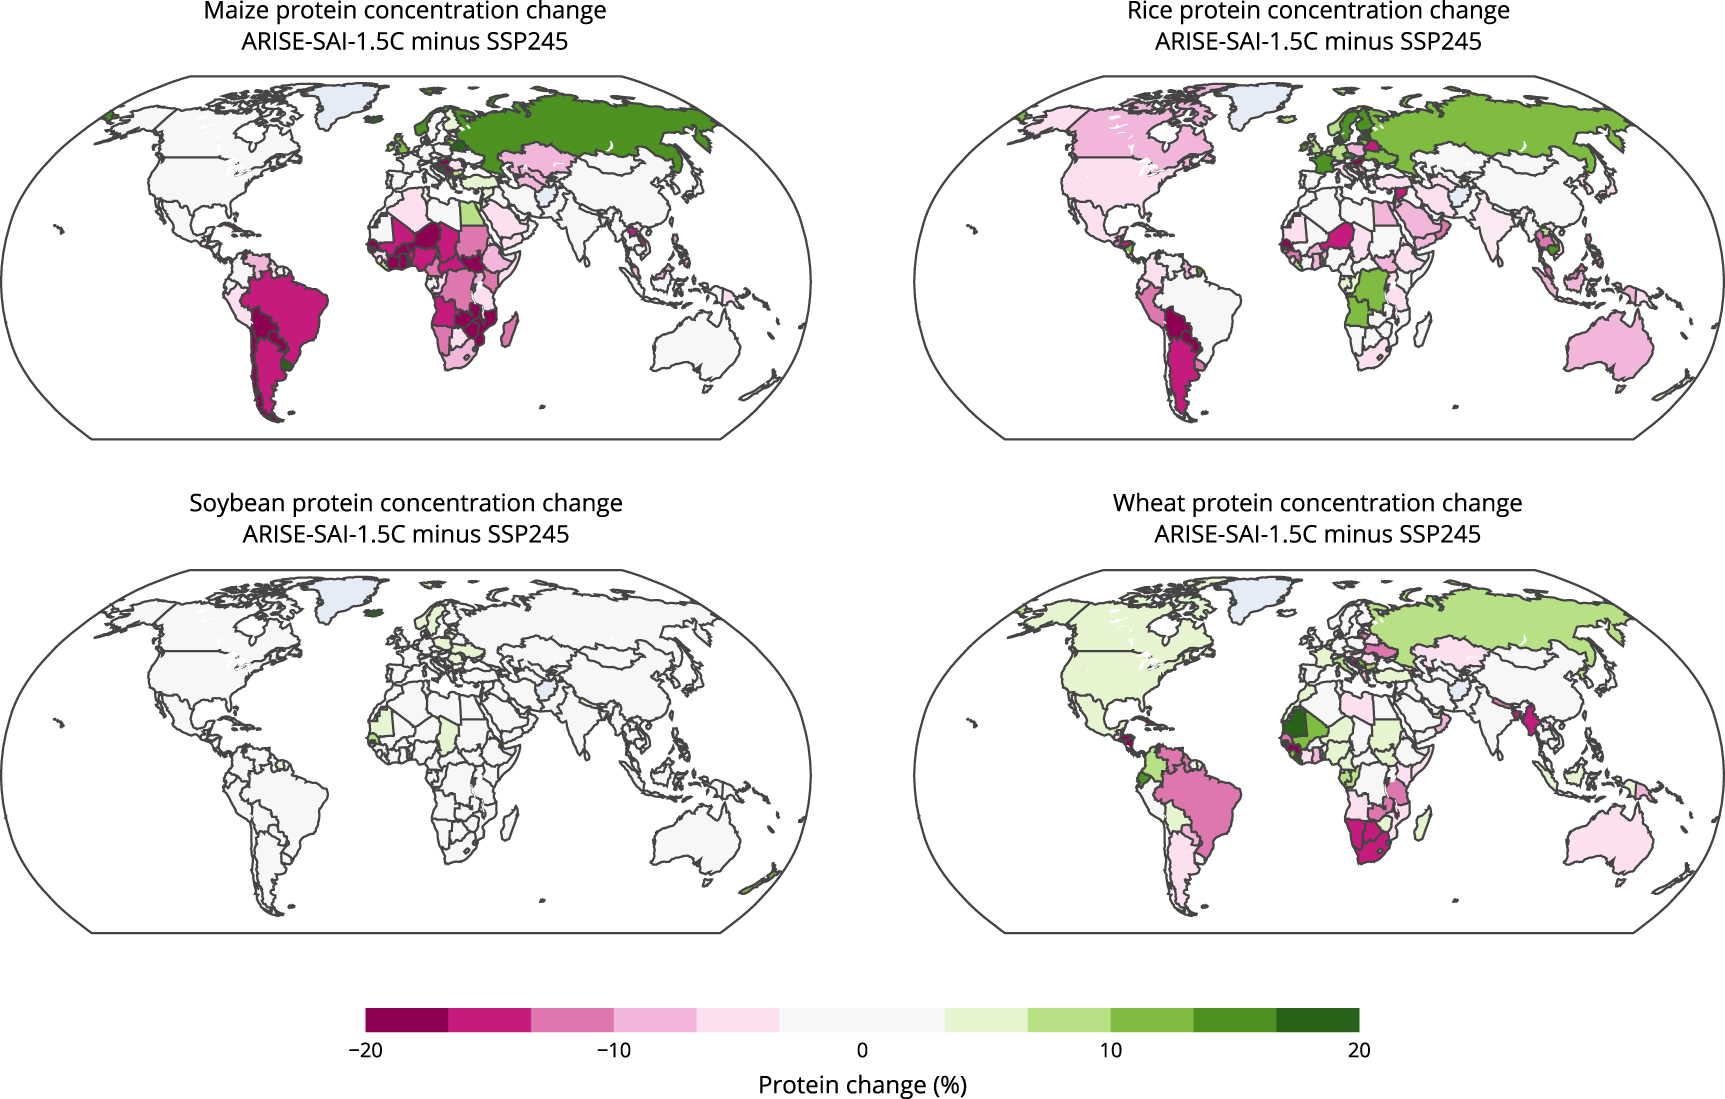
Impacts to future protein supply will vary depending on geographic location and crop species. Figure 2 shows the national level impacts to protein concentrations of maize, rice, soybean, and wheat under SAI relative to climate change. In the CLMcrop, reduced surface temperatures under SAI causes large decreases to maize protein in South Africa (−8%), Zimbabwe (−18%), Malawi (−17%), Zambia (−25%), Ghana (−26%), Nigeria (−16%), Mozambique (−19%), Brazil (−14%), Argentina (−14%), Paraguay (−28%), Chile (−17%), among others, with smaller impacts to North America, Europe, and Asia (figures 2 and 3). SAI also causes rice protein to decrease in India (−3%), Bangladesh (−3%), Japan (−5%), Thailand (−12%), Vietnam (−4%), Indonesia (−9%), and the Philippines (−11%), with increases in places such as Libera (+8%), Cambodia (+15%), and Laos (+7%) (figures 2 and 3). SAI has minimal impact on soybean protein concentration in all areas, and wheat protein is decreased under SAI in Ukraine (−12%), South Africa (−14%), Botswana (−16%), Namibia (−14%), Myanmar (−15%), Venezuela (−13%), and Brazil (−12%), with increases in Russia (+9%), the United States (+7%), and Canada (+6%) (figures 2 and 3).
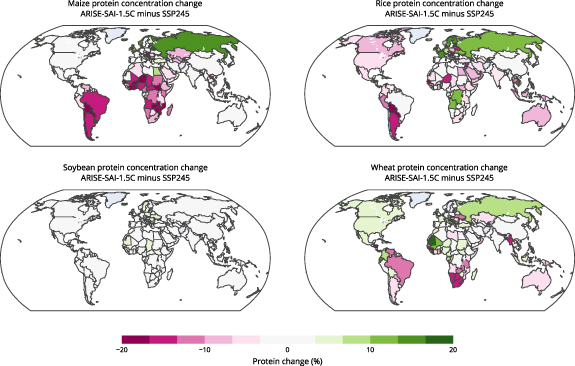
Figure 2. Maps of percent change to crop protein concentration for individual nations under ARISE-SAI-1.5 C relative to SSP2-4.5 during the years 2060–2069 as simulated by CLMcrop.
Download figure:
Standard image High-resolution image Figure data file
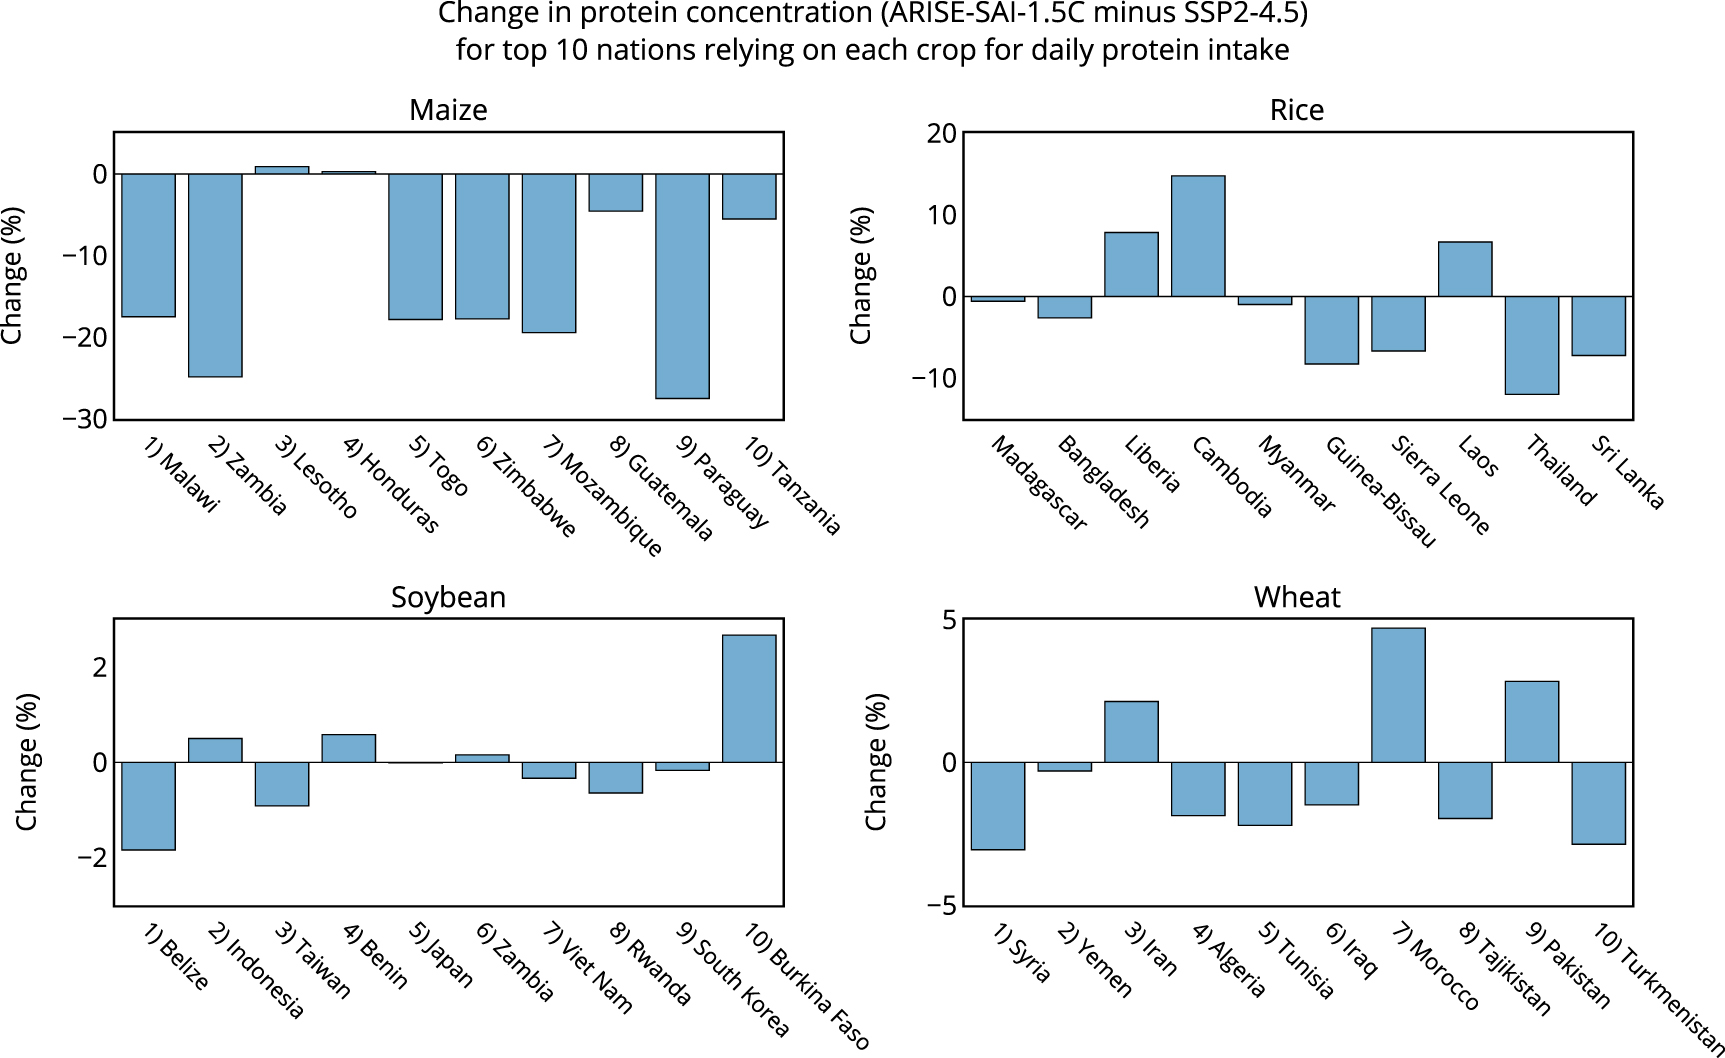
Figure 3. The percent change to protein under ARISE-SAI-1.5 C relative to SSP2-4.5 during the years 2060–2069 as simulated by CLMcrop for the top 10 nations that rely on each crop for total daily protein intake (FAO, 2022).
Download figure:
Standard image High-resolution image 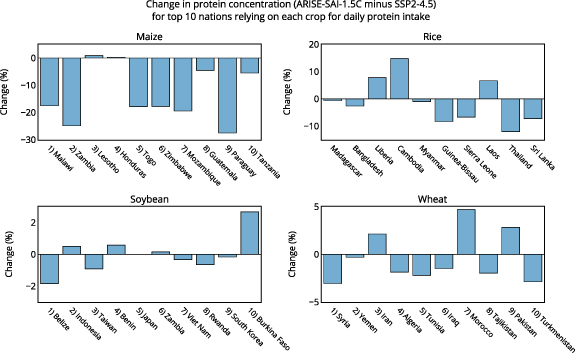
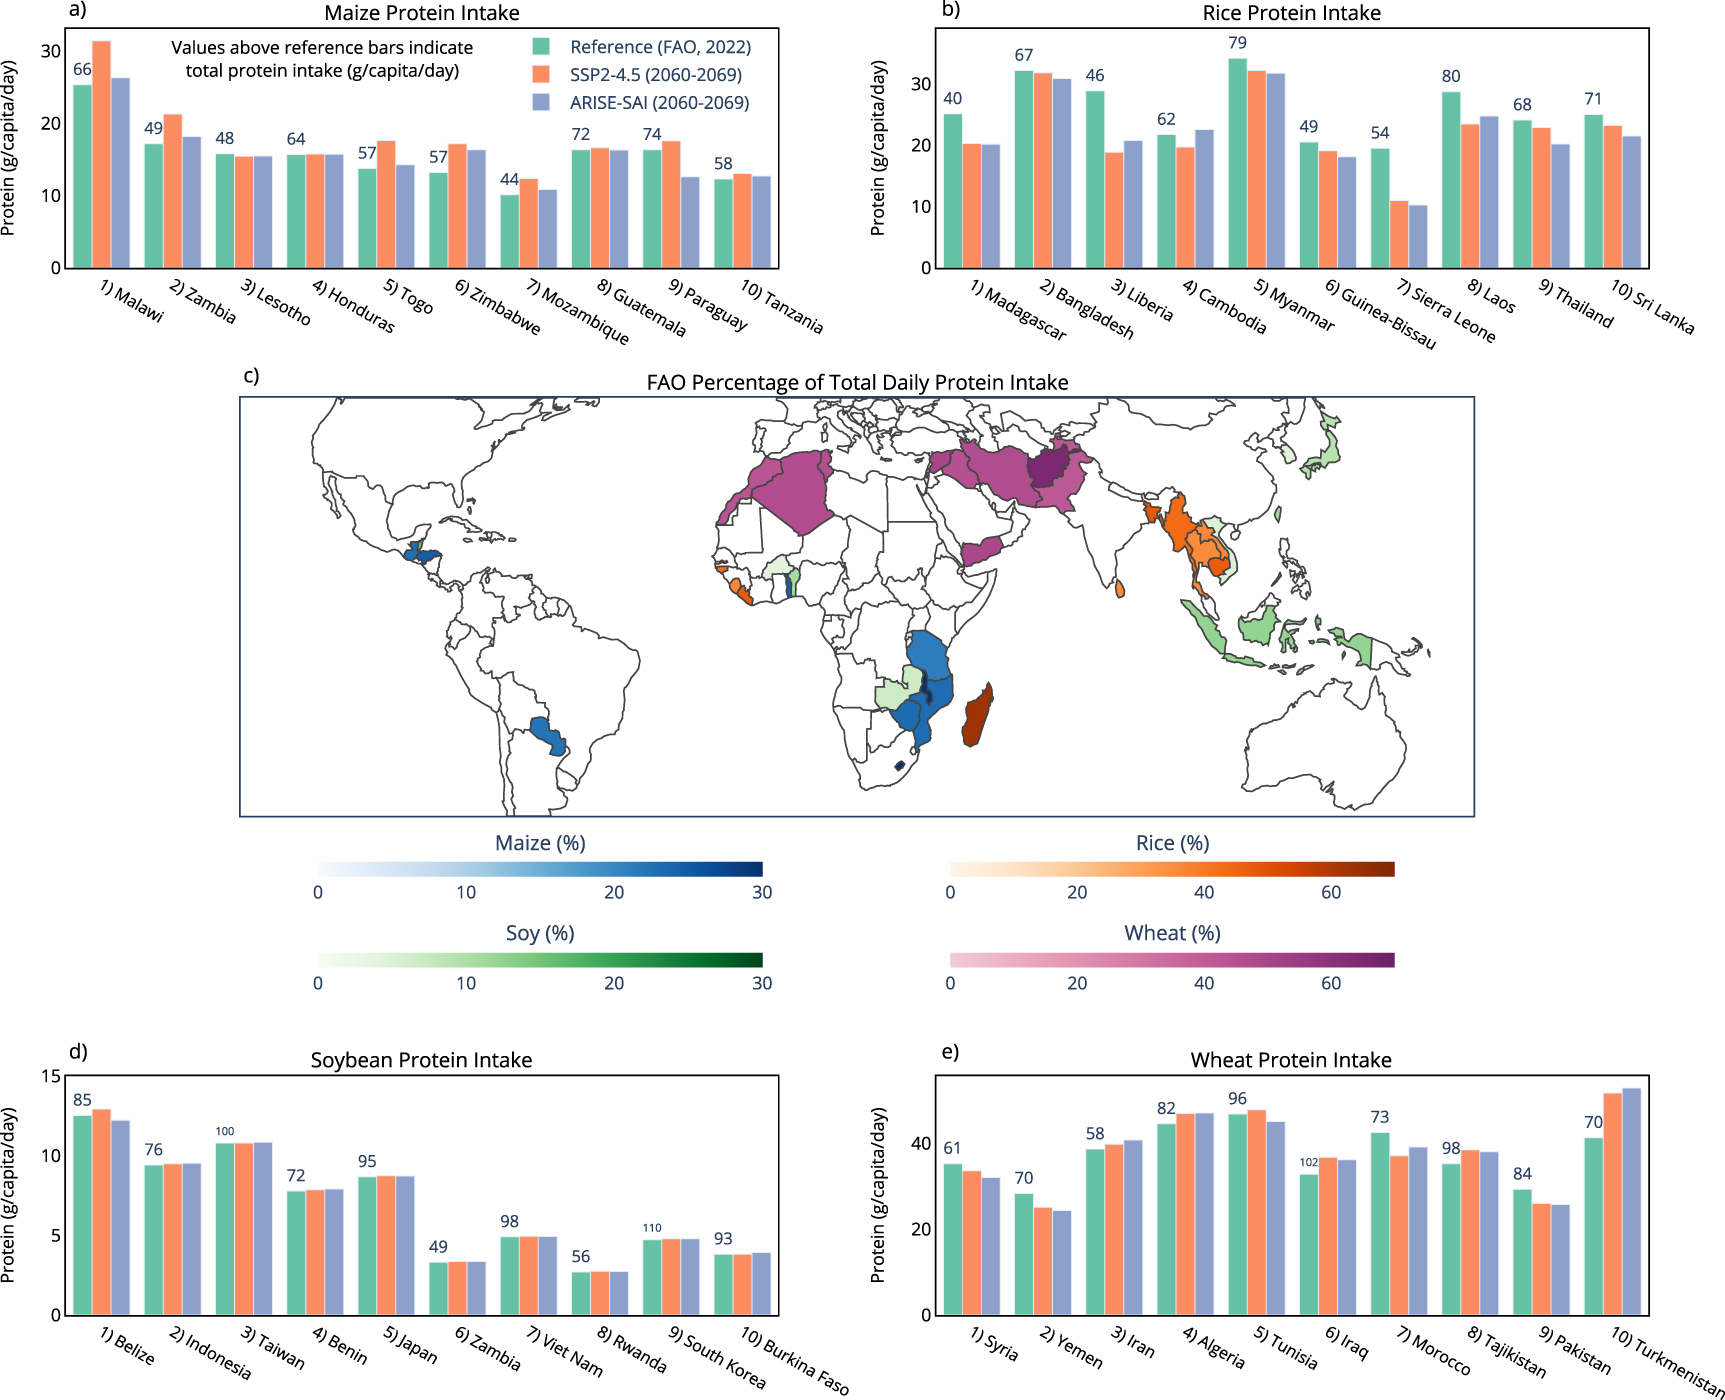
To better understand the relevance of projected regional changes to protein under SAI, figure 3 shows protein changes of maize, rice, soybean, and wheat for the top 10 nations that rely on each crop for daily protein intake [30]. These are nations where the majority of daily total protein intake comes from these grain crops [30]. These are also nations that tend to be both protein deficient and malnourished [30], making any future changes to crop protein relevant. Nations that rely on maize for daily protein intake show reduced maize protein concentration under SAI relative to climate change of up to 30% (figure 3). Rice protein also shows decreases of up to 10% in many nations that heavily depend on rice to meet daily protein requirements. Soybean and wheat protein concentration is minimally impacted by SAI for nations that rely on soybean and wheat for daily protein intake, with impacts of SAI ranging between −5% and +5% for wheat, and −2% to +2% for soybean (figure 3). Figure 4 shows the current daily protein intake (g/capita/day) sourced from each crop for the nations that rely most on a crop for total protein intake [30], the percentage of total daily protein intake that comes from each crop for nations that rely on each crop most, and the change in daily protein intake from these crops under both climate change and SAI, assuming no future changes to consumption patterns or agricultural development relative to present day. For example, Malawi receives 38% of its total daily protein intake from maize, and Madagascar receives 65% of its total daily protein intake from rice (figure 4). This makes changes to maize and rice protein in the future important for these nations as it will largely dictate impacts on total daily protein intake from climate change. For nations that rely on maize for total daily protein intake, climate change and future warming tend to increase maize protein relative to the reference period, while temperature reduction from SAI tends to reduce maize protein intake relative to climate change (figure 4). Since maize is a C4 crop, it is not as impacted by changes to future CO2 concentrations when compared to the C3 crops. Under climate change, elevated CO2 reduces rice protein intake across all ten nations most dependent on rice protein (figure 4). In these same countries, SAI induced cooling leads to either increases or decreases in rice protein intake relative to climate change, underscoring the potential for regional disparities in SAI impacts (figure 3). Changes to daily protein intake of soybean and wheat are minimally impacted by both climate change and SAI in many nations.
Figure 4. National daily protein intake for the four crops examined. Green bars show current daily protein intake sourced from each of the four crops for the top 10 nations that rely on each crop to reach total daily protein intake (FAO, 2022). Values above green bars indicate total daily protein intake (FAO, 2022). Red bars (SSP2-4.5) and blue bars (ARISE-SAI-1.5 C) indicate future daily protein intake from the crops, calculated from reference data (green bars) multiplied by the percent change to national crop protein under climate change and SAI from CLMcrop model output. The map shows the percentage of total daily protein intake that currently comes from each crop [(protein intake from crop)/(total protein intake) * 100], plotted for the top 10 nations that rely most on each crop for daily protein (FAO, 2022).
Download figure:
Standard image High-resolution image 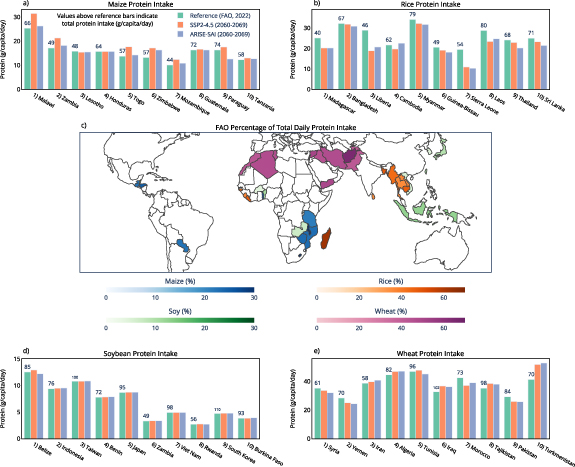
This study serves as an initial assessment of potential impacts to global crop protein changes under both future climate change and climate intervention using multiple global gridded crop models. The three crop models used here show varying responses to crop protein under future climate change and SAI. While the global gridded crop models used here have been previously evaluated for their ability to simulate historical crop yields (see methods for details), there is no global dataset for observations of crop protein, so a similar analysis cannot be done for protein. However, the CLMcrop did a reasonable job capturing changes to protein under elevated CO2 when compared to observations from free-air CO2 enrichment experiments (supplementary figure 1; see methods for details). CLMcrop captured the increase in protein content under elevated temperatures for maize and rice, but not for wheat (supplementary figure 2). For maize and rice, CLMcrop underestimated the magnitude of the observed increase, suggesting that protein losses under SAI could be larger than what is shown here. Other crop models that successfully reproduce the observed increase in wheat protein with warming may project future declines in wheat protein under SAI. Experimental literature testing the impact of warming and elevated CO2 on crop protein is lacking, making model evaluation difficult. More experimental research is needed to better understand how crop protein responds to changes in the climate to better evaluate models and draw more robust conclusions about global crop protein impacts from both climate change and climate intervention.
Process-based crop models like CLMcrop, LPJ-GUESS, and pDSSAT simulate key processes of the nitrogen cycle, including nitrogen fixation, plant nitrogen uptake from the soil, atmospheric nitrogen deposition, leaching, nitrification, and denitrification. Both CLMcrop and LPJ-GUESS have representation of biological nitrogen fixation for soybeans, allowing soybean to maintain a balanced grain C/N ratio under future climate conditions, which is consistent with observations [20, 31]. CLMcrop and LPJ-GUESS are full ecosystem models and include additional processes like nitrogen losses due to fire that are not included in pDSSAT. There are also differences between the three models used here. While CLMcrop and LPJ-GUESS are both ecosystem models, they differ in how they represent plant nitrogen uptake. CLMcrop calculates plant nitrogen uptake and allocation using the Fixation and Uptake of Nitrogen (FUN) model [32]. In the FUN model, a plant can expend energy in the form of carbon to uptake nitrogen from several possible sources. LPJ-GUESS determines nitrogen demand and uptake to maintain optimal leaf nitrogen for photosynthesis [33]. LPJ-GUESS determines nitrogen allocation by maintaining a leaf nitrogen content that maximizes photosynthesis [34]. Differences in how models represent nitrogen cycle processes may help explain the variation in projected future responses of crop protein concentrations (supplementary figures 3 and 4). There are additional physiological differences between models that could explain differences in results. LPJ-GUESS does not separate between direct and diffuse radiation, while CLMcrop and pDSSAT do [9]. LPJ-GUESS has also been shown to be much less sensitive to changes to temperature compared to CLMcrop and pDSSAT [9].
This study is limited by using only one ensemble member from one climate model, one SAI scenario, and only three crop models. The use of one ensemble member means that natural climate variability is large relative to the forced response. A more comprehensive analysis using climate forcings from multiple scenarios, multiple climate models, multiple ensemble members, and additional global gridded crop models are needed to draw more robust conclusions and reduce uncertainties. Different SAI scenarios vary in both the amount of SO2 injected and the latitude of injection, leading to strong scenario dependent differences in surface climate responses that in turn would affect crop outcomes [35]. Current crop models are not able to simulate impacts from changing surface ozone and ultraviolet radiation, which are both expected to be modified under SAI [1, 2]. Updating the models to handle these changes under SAI is needed to better understand the full impact of SAI on crop yield and protein. While these models can estimate protein concentrations through simulated grain nitrogen to carbon (N/C) ratios [36], they do not have the ability to simulate other important nutrients, such as iron and zinc, which have been shown to also be impacted by CO2 and temperature changes [11, 19]. While these simulations applied constant fertilizer application, applying additional fertilizer may be able to mitigate negative impacts on crop protein concentrations, but would be accompanied by negative environmental effects, such as air pollution, stratospheric ozone depletion, and eutrophication [21]. If reduced crop protein under SAI is accompanied by increases to crop yield, dietary protein losses may be compensated by increased consumption, but this could have an impact on caloric intake and obesity and needs to be studied further.
Stratospheric sulfate aerosol climate intervention, used to maintain 1.5 °C above preindustrial levels relative to SSP2-4.5, would cause global maize protein to change by −3.8%, 0.9%, and −2.3% for CLMcrop, LPJ-GUESS, and pDSSAT, respectively. Rice protein changes by −4.1% and −0.9%, global wheat protein by −1.4% and −0.1%, and soybean protein by 0.2% and 0.6% in CLMcrop and LPJ-GUESS. Despite CO2 concentrations being the same in the SAI and climate change scenarios, reducing temperature increases with SAI has the potential to reduce the protein of maize and rice, while wheat and soybean protein concentrations are minimally impacted by SAI. Regional changes that are relevant to local protein intake are much larger. SAI relative to climate change reduces maize protein intake by up to 30% in nations that rely most on maize for total protein intake. For nations that rely on rice for protein intake, rice protein is decreased by up to 10%, with other nations showing both increases or decreases to rice protein under SAI relative to climate change. These decreases to crop protein could exacerbate future nutrient scarcity and malnourishment in already vulnerable regions. While regional soybean and wheat protein are minimally impacted by SAI in the crop models used in this study, changes to maize and rice protein need to be accounted for when understanding impacts on crops from SAI. There is still large model-related uncertainty as to how SAI would impact both crop protein and yields, and other crop models may show different results. Additional work is needed to run more SAI scenarios with more climate and crop models. More field experiments are also needed to better understand how crop protein will respond to both CO2 and temperature in the future to better evaluate crop models. This study serves as an initial effort to explore crop protein responses to SAI. Given the current limitations in observational data and global modeling capabilities, further research is needed to draw robust conclusions that can effectively inform policy decision making. Accounting for changes to protein as well as yields will continue to be important for understanding the potential impact of SAI on global agriculture and food security.
5.1. Climate model simulations
In this study, the atmospheric data used to force the crop models, were output by CESM2 using the Whole Atmosphere Community Climate Model (WACCM) version 6 configuration [37, 38]. The reference climate change scenario used was the intermediate emissions scenario SSP2-4.5 [39]. The ARISE-SAI-1.5 C scenario has varying amounts of SO2 injected in the climate model at four different latitudes: 30° N, 15° N, 15° S, and 30° S. A feedback control algorithm is used to determine where and how much SO2 is injected every year to maintain global average temperatures of 1.5 °C above preindustrial levels. CESM2 (WACCM6) was run at 1.25° by 0.9° longitude-latitude resolution with a model top at about 140 km above the surface. The sophisticated stratospheric and tropospheric chemistry and dynamics of this model allows the simulation of impacts of SAI on varying aspects of the climate important for agriculture, including temperature, precipitation, humidity, and direct and diffuse radiation. Additional details on the CESM2 (WACCM6) simulations of SSP2-4.5 and ARISE-SAI-1.5 C can be found in Richter et al [26].
5.2. Crop model simulations
The crop models have interactive carbon and nitrogen cycling and output grain-level carbon and nitrogen storage levels upon harvest. All three crop models were harmonized following the Global Gridded Crop Model Intercomparison phase 3b ‘2015soc’ protocol, whereby planting dates, cropping areas, nitrogen fertilizer application, and atmospheric NO3 and NH4 deposition were held constant at 2015 levels throughout the simulations [40]. One ensemble member from the output of CESM2 (WACCM6) of SSP2-4.5 and ARISE-SAI-1.5 C was chosen as climate forcing for the crop models [26]. The atmospheric forcing data were downscaled to 0.5° by 0.5° longitude-latitude resolution using bilinear interpolation. LPJ-GUESS and pDSSAT are forced by daily atmospheric inputs, while CLMcrop was run with 3 hour and 1 hour atmosphere data. CLMcrop and LPJ-GUESS simulated maize, wheat, rice, and soybean, while pDSSAT only simulated maize. Crop protein concentration was estimated using the model simulated grain nitrogen to carbon (N/C) ratio.
5.3. Crop model evaluation
The ability of CLMcrop, LPJ-GUESS, and pDSSAT to simulate historical crop yields has been evaluated in previous studies. pDSSAT was able to replicate the interannual variability of the Food and Agriculture Organization (FAO) reported historical (1982–2006) global maize yields with a correlation coefficient of 0.88 [41]. LPJ-GUESS replicated the interannual variability of FAO historical global yields of wheat, rice, soybean, and maize with correlation coefficients of 0.60, 0.52, −0.002, and 0.71, respectively [41]. Similar analysis was done for CLMcrop, where it replicated the interannual variability of FAO historical (1996–2012) global yields of wheat, rice, soybean, and maize with correlation coefficients of 0.52, 0.40, 0.23, and 0.91, respectively [7]. National level historical yields have also been evaluated for CLMcrop against FAO data [7]. There are known issues with CLMcrop, such as underestimation of maize yields in the US, and rice yields in India [22]. CLMcrop, LPJ-GUESS, and pDSSAT all showed a significant positive correlation with simulated interannual global maize yield when compared to observations [7, 40]. CLMcrop and LPJ-GUESS also showed significant positive correlation to observations of global wheat and rice yields [7, 41]. However, CLMcrop and LPJ-GUESS were not able to significantly replicate the interannual yield variability of soybean, making future projections of soybean for these models less reliable [7, 41].
There are no global datasets for observations of crop protein, making evaluation of the crop models for their ability to simulate protein concentration a challenge. To evaluate the ability of crop model simulated grain N/C to respond to future climates, we evaluated simulations of CLMcrop with ambient CO2 (370 ppm) compared with elevated CO2 (570 ppm) against the results of free‐air CO2 enrichment experiments from Myers et al [11]. Supplementary figure 1 shows that CLMcrop did a reasonable job capturing protein responses to elevated CO2 for maize, rice, soybean, and wheat. Myers et al [11] found a decrease in protein of wheat and rice under elevated CO2, with minimal impact on maize and soybean, which is consistent with the results from CLMcrop (supplementary figure 1). Experiments from Myers et al [11] took place during the years 2007–2010 for wheat, 2007–2010 for rice, 2001–2008 for soybean, and 2008 for maize. The evaluation period used for CLMcrop are from years 2016–2020. While Myers et al [11] and our analysis have different background conditions, the only difference between the elevated and ambient scenarios is the CO2 concentration. However, higher background temperatures could lead to more relative CO2 fertilization through enhanced photorespiration and decreased water use efficiency, which could impact our evaluation (supplementary figure 1). Experiments that test the impact of elevated temperatures on protein concentrations are even more rare.
Supplementary figure 1 shows the impact on protein from elevating temperatures by 2 °C for CLMcrop, Guo et al [20], and Tan et al [42]. CLMcrop was run from 2016–2025 under SSP2-4.5 with temperatures increased uniformly over each grid cell and a 3-hour time step, which was compared to the same time period without this temperature increase. Guo et al [20] assessed the impact on wheat and rice protein from an increase of 2 °C. They used a background climate of 2013 for rice and 2018 for wheat, and they were not able to maintain +2 °C, with elevated temperatures ranging between 1.2 °C and 2.5 °C of warming. Tan et al [42] assessed the impact to maize protein from an increase of 2 °C. They used 2000–2010 as the baseline, and elevated temperatures ranged between 1.4 °C and 2.1 °C of warming. Guo et al [20] was an outdoor field experiment, while Tan et al [42] was an indoor laboratory experiment. Other variations between our analysis and these warming experiments include variations in cultivars, water supply, soil conditions, and background CO2. Because these background conditions remain unchanged between the elevated temperature treatment and the baseline case, we assume that differences in protein responses for CLMcrop relative to observations are primarily driven by model processes representing temperature impacts on protein accumulation (supplementary figure 2). Compared to the experiments in Guo et al [20] and Tan et al [42], CLMcrop tends to underestimate protein benefits from warming (supplementary figure 2.). Wheat in CLMcrop shows no benefit to global protein concentrations from unified warming, while Guo et al [20] showed a benefit of about 15% (supplementary figure 2.). In CLMcrop under 2 °C warming, global rice and maize protein increased by about 5% and 8%, respectively, which is less than what is seen in experiments (supplementary figure 2.). To our knowledge, there are no experimental studies that assess the impact of warming on soybean protein concentrations.
This work was supported by NSF grants AGS-2017113 and ENG-2028541 and by a gift from SilverLining’s Safe Climate Research Initiative. This material is based on work supported by the National Center for Atmospheric Research, which is a major facility sponsored by the NSF under cooperative agreement no. 1852977. Computing and data storage resources, including the Cheyenne and Derecho supercomputers, were provided by the Computational and Information Systems Laboratory at the National Center for Atmospheric Research.
B C, A R, and L X designed the study. B C, S S R, J R G, and J J conducted crop model simulations. B C analyzed the data with contributions from all authors. B C, A R, and L X wrote the first draft, and all authors contributed to editing and revising the paper.
The authors declare no competing interests.
The source code for the CESM(WACCM) model used in this study is available at www.cesm.ucar.edu/working_groups/Whole-Atmosphere/code-release.html. The code for CLM is available at www.cesm.ucar.edu/models/cesm2/land/. The code for LPJ-GUESS is available at https://web.nateko.lu.se/lpj-guess/download.html. The code for the Cropping System Model (CSM) of DSSAT is available at https://github.com/DSSAT/dssat-csm-os.