1748-9326/20/11/114073
Abstract
Wildfire is one of the dominant disturbances in the Siberian boreal forest, affecting the capacity of forests to uptake carbon. Impacts of wildfires on forest carbon uptake are substantially varied by tree compositions, however, the loss of carbon uptake capability across different forest types remains uncertain. Here, we tracked post-fire changes in gross primary production (GPP) across five forest types in Siberia, namely, evergreen needleleaf forests (ENF), deciduous needleleaf forests (DNF), deciduous broadleaf forests (DBF), mixed forests (MF), and woody savannas (WSVN), using satellite-based observation data from 2001 to 2023. Results revealed substantial reductions in GPP after wildfire followed by gradual recovery except DBF. The…
1748-9326/20/11/114073
Abstract
Wildfire is one of the dominant disturbances in the Siberian boreal forest, affecting the capacity of forests to uptake carbon. Impacts of wildfires on forest carbon uptake are substantially varied by tree compositions, however, the loss of carbon uptake capability across different forest types remains uncertain. Here, we tracked post-fire changes in gross primary production (GPP) across five forest types in Siberia, namely, evergreen needleleaf forests (ENF), deciduous needleleaf forests (DNF), deciduous broadleaf forests (DBF), mixed forests (MF), and woody savannas (WSVN), using satellite-based observation data from 2001 to 2023. Results revealed substantial reductions in GPP after wildfire followed by gradual recovery except DBF. The GPP changes one year after wildfire (ΔGPP1yr) and recovery rates of GPP notably differed by forest types. In ENF, ΔGPP1yr reached −63.4 g C m−2yr−1, which is larger than that in MF, DNF, and WSVN by −20.6, −31.3, and −42.7 g C m−2 yr−1, respectively. Consistently, the GPP recovery rate is the lowest in ENF, at 63.7%. Furthermore, significant decreasing trends in 5-year mean of ΔGPP1 yr in DNF, MF, and WSVN exceed −1.0 g C m−2yr−1 yr−1, indicating intensified impacts of increased wildfire intensity and/or extent on forest carbon. Our findings highlight the urgent need for establishing fire management and forest recovery strategies adapted to different forest types to enhance ecosystem resilience.
Export citation and abstractBibTeXRIS
Wildfire is one of prevalent disturbances on Earth that alters the terrestrial carbon budget (Bowman et al 2009, 2020, United Nations Environment Programme (UNEP) 2022, Intergovernmental Panel on Climate Change (IPCC) 2023). Wildfire induces immediate carbon emissions from soil and vegetation carbon pools into the atmosphere through the loss of vegetation and peatland burning. Globally averaged carbon emissions according to wildfires were estimated as 2.1 ± 0.2 Gt C yr−1 during 2002–2020 (Van Wees et al 2022), 21% of fossil fuel emissions (Friedlingstein et al 2023). In addition, the wildfire-induced degradation of vegetation has a long-term effect on the terrestrial carbon budget because the carbon uptake capacity of vegetation decreases during the regrowth period (He et al 2019). Hence, temporal changes in vegetation carbon uptake in the post-fire period are needed for a comprehensive understanding of wildfire impacts on the terrestrial carbon budget.
The Siberian boreal forest, which covers about 20% of the global forest areas (Keenan et al 2015), is one of the essential regions of the global terrestrial carbon cycle (Fan et al 2023). The terrestrial carbon budget of this region has been largely disturbed by wildfire events. Several field-based observations indicated that Siberian forests have undergone a fire-induced reduction in live carbon stock (Barrett et al 2020, Webb et al 2024). Remotely sensed observations also showed wildfire-induced tree loss across the Siberian boreal forests (Rogers et al 2015, Shuman et al 2017). The amount of carbon uptake over Siberia is expected to decrease within the regrowth period, yet studies associated with the decrease in carbon uptake capacity over Siberia in the post-fire period are still lacking due to both the limited accessibility to fire-affected regions and difficulty of long-term monitoring of the post-fire period, which requires huge resources, including substantial manpower and financial support (UNEP 2022). This knowledge gap is becoming critical as lengthening recovery times following large scale fires, suggesting that prolonged impacts of fire on carbon dynamics (Lv et al 2025).
Forests in the Siberian boreal region are classified into several forest types according to their vegetation structure and species composition (Mack et al 2021, O’sullivan et al 2024). Impacts of wildfire on carbon uptake capacity are different by individual forest types corresponding to their carbon storage capacity and resilience to wildfire disturbances. For example, forests with higher biomass density typically result in greater carbon losses upon burning (Alexander et al 2012). The recovery pattern of carbon uptake capacity is also strongly influenced by species composition and regeneration rates (Goetz et al 2007, Tangney et al 2022). Further, wildfires have become more intense in Siberia, with increases in the frequency of occurrence, persisting duration, and extent of damage (Liu et al 2010, Flannigan et al 2013, Senande-Rivera et al 2022, Hudiburg et al 2023). Impacts of changing wildfire characteristics on the loss of carbon uptake capacity vary significantly among forest types across both short- and long-term temporal scales (Fan et al 2023). Thus, understanding temporal change in carbon uptake capacity in the post-fire period requires consideration of distinct responses of individual forest types to wildfire.
This study aims to quantify the post-fire impact on vegetation productivity over the Siberian boreal forest for different forest types based on multiple satellite-retrieved datasets obtained from the moderate resolution imaging spectroradiometer (MODIS) on NASA’s Terra/Aqua satellites to overcome the difficulty of direct observation at wildfire sites for a long time. The differences in annual mean gross primary production (GPP) between pre-fire and post-fire periods are evaluated within the area affected by the wildfires for the period 2003–2022. Temporal variations of GPP in wildfire-occurred regions are individually examined and are analyzed across five dominant forest types in the Siberia, specifically, evergreen needleleaf forests (ENF), deciduous needleleaf forests (DNF), deciduous broadleaf forests (DBF), mixed forests (MF), and woody savannas (WSVN). Note that the WSVN type is defined by the international geosphere–biosphere programme (IGBP) classification as areas characterized by a tree cover ranging from 30% to 60%, with a canopy height exceeding 2 m (Loveland and Belward 1997, Belward et al 1999), which is typically recognized as one of natural forest types (Liu et al 2019, Chen et al 2021). Results can allow us to better understand how changed patterns of wildfire influence the vegetation productivity over the Siberian boreal forest.
2.1. Data description
Seven datasets for 2001–2023 derived from the MODIS sensors onboard NASA’s Terra/Aqua satellites and the Köppen–Geiger (K–G) climate classification data were utilized to estimate the GPP change due to individual wildfire events across five forest types. We used two fire-related products, namely monthly Burned Area data at a 500 m spatial resolution (BA; Giglio et al 2021) and eight consecutive days of maximum Fire Radiative Power (maxFRP; Giglio and Justice 2021) at a 1 km spatial resolution. Three datasets at a 0.05° spatial resolution, namely monthly land surface radiometric temperature (LST; Wan et al 2021), monthly normalized difference vegetation index (NDVI; Didan 2021), and daily white-sky shortwave Albedo (Schaaf and Wang 2021) were also employed. The 8-day composite gap-filled GPP data at a 500 m spatial resolution (Running et al 2021) were used to capture the changes in vegetation productivity following wildfire events. We utilized the MODIS land cover map with 0.05° × 0.05° horizontal resolution (Friedl and Sulla-Menashe 2022) based on the IGBP classification legend to identify different forest types. The K–G climate classification for the period of 1986–2010 (Kottek et al 2006, Rubel et al 2017) at 5 arc minute spatial resolution was obtained. The GPP, BA, maxFRP, and K–G climate classification datasets were aggregated to 0.05° × 0.05° horizontal resolution to match that of other datasets by averaging all pixels within each grid cell.
2.2. Study region
Our study area encompasses the Siberian boreal forests, which span 40°N–70°N and 50 °E–150 °E and include both western and eastern Siberian taiga ecoregions (figure S1). According to the K–G climate classification, the western area has a subarctic continental climate, whereas the eastern area experiences a monsoon-influenced subarctic climate with temperatures ranging from −3 °C to 10 °C (Rubel et al 2017). To separate wildfire impacts from other factors, we excluded non-forest pixels using land cover dataset, thereby avoiding confounding effects of human-induced fires (e.g. slash-and-burn agriculture).
2.3. Methods
We employed the concept of the percentage of burned area (PBA) to identify fire grids within the analysis domain at a 0.05° × 0.05° spatial resolution. The PBA was calculated annually during the period of 2003–2022 as the ratio of burned pixels to the total number of pixels within individual grid cells. Only grid cells with a PBA ⩾ 20% were defined as fire grids for the analysis, following Liu et al (2018, 2019). This conservative threshold captures pixels with a clearly detectable burned signal by minimizing the influence of noise and misclassification.
To establish control grids, we defined undisturbed adjacent grid cells matched to each fire grid through three steps, which are primarily referred to Liu et al (2018). Note that graphical illustration and flowchart can help understanding these procedures for selection of control grid cells (figures S2 and S3). First, we considered only unburned grid cells as potential control candidates within a 9 × 5 grid window, approximated area of 28 × 28 km2, centered on the corresponding fire grid. These candidates shared the same climate regime and land cover type to corresponding fire grid to eliminate background influences such as climate variability, synoptic-scale dynamics, and vegetation composition. Second, candidates were required to exhibit similar biophysical properties to the fire grid during the fire year and the two preceding years, with thresholds of 0.2 K, 0.05, and 0.05 for LST, NDVI, and white-sky shortwave albedo, respectively. These thresholds are less than or comparable to regional variability of corresponding biophysical parameters (not shown) and documented uncertainties of MODIS products (Huete et al 1999, Wan 1999, Schaaf et al 2010). If multiple candidates satisfied the conditions, the geographically closest grid was selected. Finally, this procedure was repeated for all fire grids. Across the study period, 95.4% of fire grids were successfully matched with control grids, suggesting enough samples for quantifying the GPP changes by fire (tables S1 and S2).
We defined the difference of annual GPP (ΔGPP) between each fire grid  and its paired control grid cell
  at year t as,

And then, we expressed ΔGPP as a function of year since fire to represent the temporal trajectory of ΔGPP, following the chronosequence approach (Hemes et al 2023). If  denotes the fire year for grid cell
  , the ΔGPP at
  years after fire is given by,
With  representing the post-fire reduction of GPP in the first year after fire, denoted by ΔGPP1yr. For an example of wildfires occurred in 2013, ΔGPP was computed from 2001 to 2023, corresponding to year since fire values of −12, 0, and 10 for 2001, 2013, and 2023, respectively (figure 1). We also calculated ΔNDVI using the same approach to evaluate reductions in vegetation greenness. To facilitate visualization, spatial patterns of averaged PBA, ΔGPP1yr, and ΔNDVI1yr for 2003–2022 were aggregated to a 1° × 1° horizontal resolution. Temporal trends in ΔGPP1yr, PBA, and maxFRP were assessed using the non-parametric Mann–Kendall test, with the rate of change estimated by Sen’s slope method.
Figure 1. Schematic overview illustrating the trajectory of ΔGPP before and after wildfire occurrence in 2013. The grey shaded area represents the pre-fire period (2001–2012), while the white background shows the post-fire recovery phase (2013–2023). Vertical colored lines indicate specific post-fire intervals (red, yellow, blue, and purple lines for 0, 1, 5, and 10 years after fire, respectively) analyzed in this study. The marked decline at year 0 illustrates the immediate impact of wildfire on GPP, followed by gradual but incomplete recovery over the subsequent decade.
Download figure:
Standard image High-resolution image 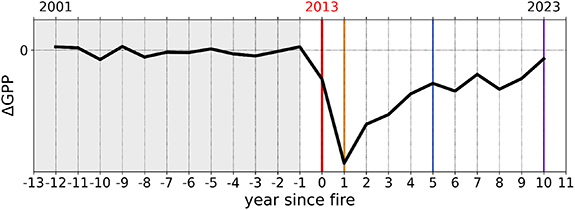
Based on the calculated ΔGPP, we further evaluated the degree of recovery relative to pre-fire conditions by defining the recovery rate  as the fractional return of GPP at
  year after the fire from the maximum GPP reduction in the first year toward the pre-fire mean level:

where  is the mean of ΔGPP over all available pre-fire years. Values of
  close to 1 indicate substantial recovery toward the pre-fire baseline, while values near 0 suggest little or no recovery. We adopted the recovery rate at 5 and 10 years after individual wildfire events,
  and
and  .
.
Finally, we assessed the wildfire-induced ΔGPP and its post-fire trajectories separately for five major forest types in Siberia, namely ENF, DNF, DBF, MF, and WSVN. Specifically, we analyzed spatial patterns of ΔGPP1yr, temporal changes in ΔGPP, trend in ΔGPP1yr,  , and
, and  for each forest type.
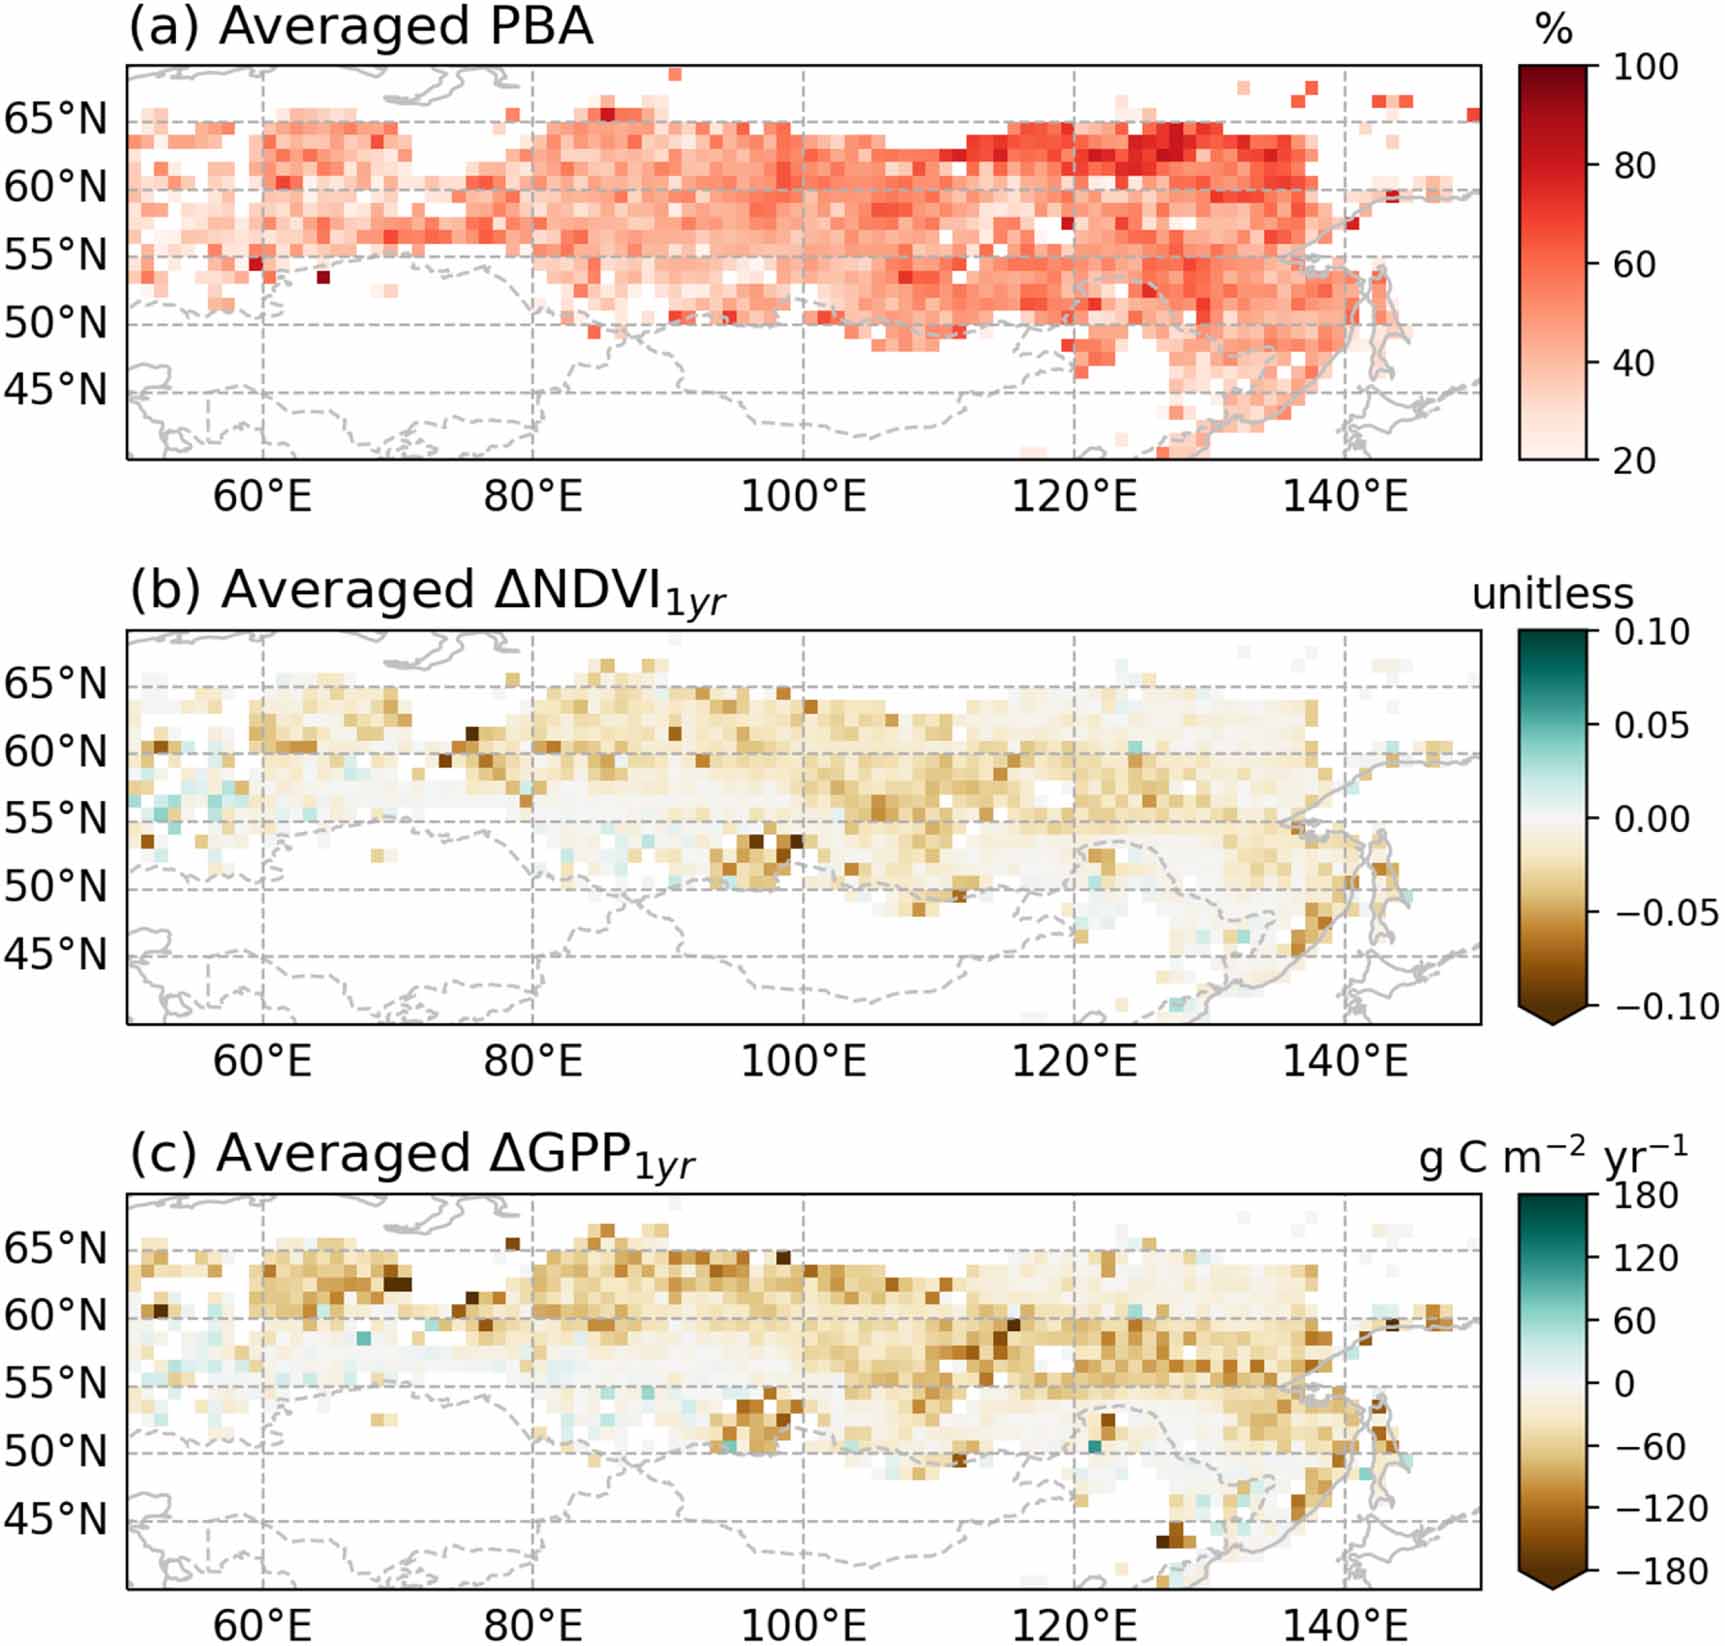
The spatial patterns of 20-year averaged PBA, ΔNDVI1yr, and ΔGPP1yr for 2003–2022 show the impacts of wildfire on vegetation greenness and photosynthetic productivity over Siberian forests (figure 2). Note that the PBA, ΔNDVI1yr, and ΔGPP1yr were aggregated to a 1° grid for better visibility as mentioned above (figures 2 and S4). The PBA is positive across most of the study domain, with a mean of 52.0 ± 23.7% (figure 2(a)). Positive PBA indicates that each 1° grid cell includes at least one fire grid determined at 0.05° × 0.05° resolution during 2003–2022. The spatial patterns of ΔNDVI1yr and ΔGPP1yr consistently show post-fire decreases in greenness and corresponding photosynthetic productivity (figures 2(b) and (c)). In the year following fire, NDVI decreased by 0.01 ± 0.03 (figure 2(b)), equivalent to reductions up to 13% relative to annual mean NDVI. Annual GPP also decreased by 26.1 ± 74.5 g C m−2 yr−1 over the analysis domain (figure 2(c)). In addition, the spatial consistency between ΔNDVI1yr and ΔGPP1yr supports that the vegetation loss is directly related to a reduction in the photosynthetic carbon uptake capacity.
Figure 2. Spatial patterns of the 20 year averaged values (2003–2022) of (a) PBA, (b) ΔNDVI1yr, and (c) ΔGPP1yr. The calculated spatial patterns represent the mean values within burned grid cells across five forest types in Siberia. Maps are displayed at a 1° spatial resolution, with each cell representing the averaged values for clearer visualization of regional variations. Negative values (brown colors) in (b) and (c) indicate areas of decreased vegetation productivity following wildfires.
Download figure:
Standard image High-resolution image 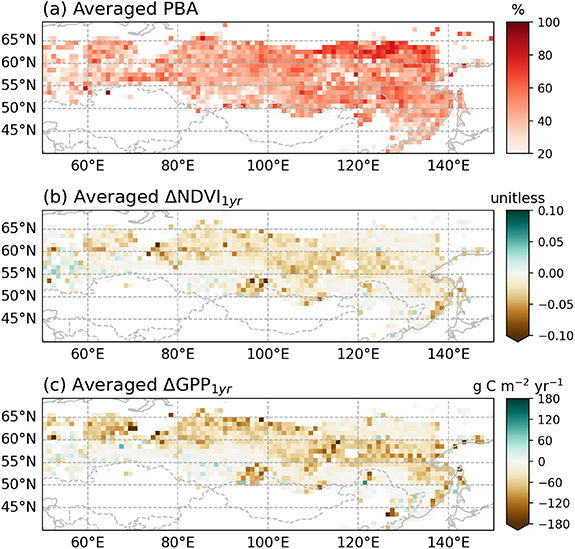
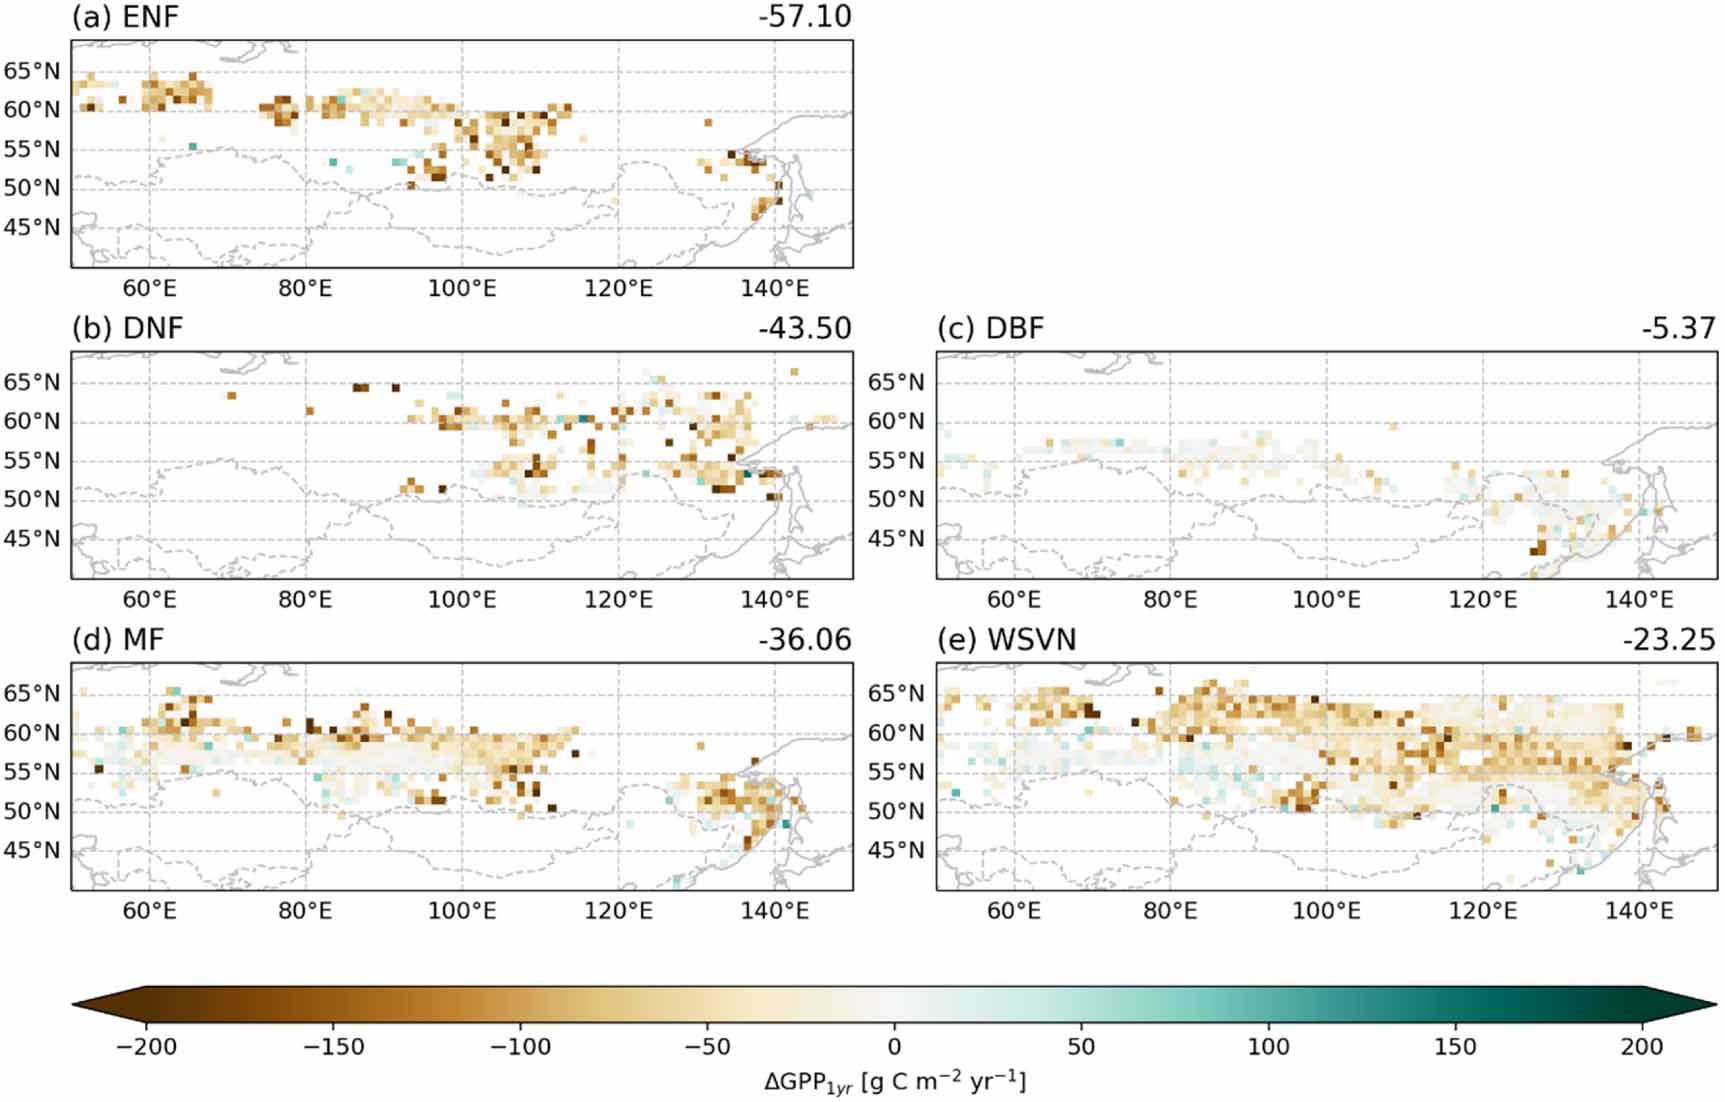
Spatial patterns of ΔGPP1yr corresponding to five forest types are illustrated for examining the effects of wildfires on GPP in each forest type (figure 3). In general, wildfires resulted in negative ΔGPP1yr values of −57.1 ± 96.9, −43.5 ± 86.5, −5.4 ± 54.2, −36.1 ± 75.3, and −23.2 ± 73.0 g C m−2 yr−1 for ENF, DNF, DBF, MF, and WSVN, respectively, which are 9.1 ± 15.5, 6.5 ± 12.9, 0.6 ± 5.8, 4.8 ± 10.0, and 3.7 ± 11.6% of baseline GPP (figures 3 and S5). In addition, spatial distributions of ΔGPP1yr are distinct by forest types following their geographical locations (figure S1(b)). For example, GPP reductions in ENF are concentrated in the northwestern and central parts of the domain (figure 3(a)), while DNF shows prominent decrease in ΔGPP1yr in the eastern Siberia (figure 3(b)). Distinct spatial patterns and magnitudes of ΔGPP1yr across five forest types suggested that the impact of wildfires on photosynthetic carbon uptake was regulated by the underlying vegetation characteristics.
Figure 3. Spatial distribution and magnitude of GPP reduction one year after wildfire events (ΔGPP1yr) from 2003 to 2022, categorized by forest types in Siberia: (a) evergreen needleleaf forest (ENF), (b) deciduous needleleaf forest (DNF), (c) deciduous broadleaf forest (DBF), (d) mixed forest (MF), and (e) woody savannas (WSVN). Color gradients from blue to red indicate differences in GPP between burned and control grid cells; brown (green) grid indicates substantial (minimal or no) reductions. Values shown in the upper-right corner of each panel represent the averaged ΔGPP1yr across all burned grid cells for the corresponding forest type. Maps are presented at a 1° spatial resolution.
Download figure:
Standard image High-resolution image 
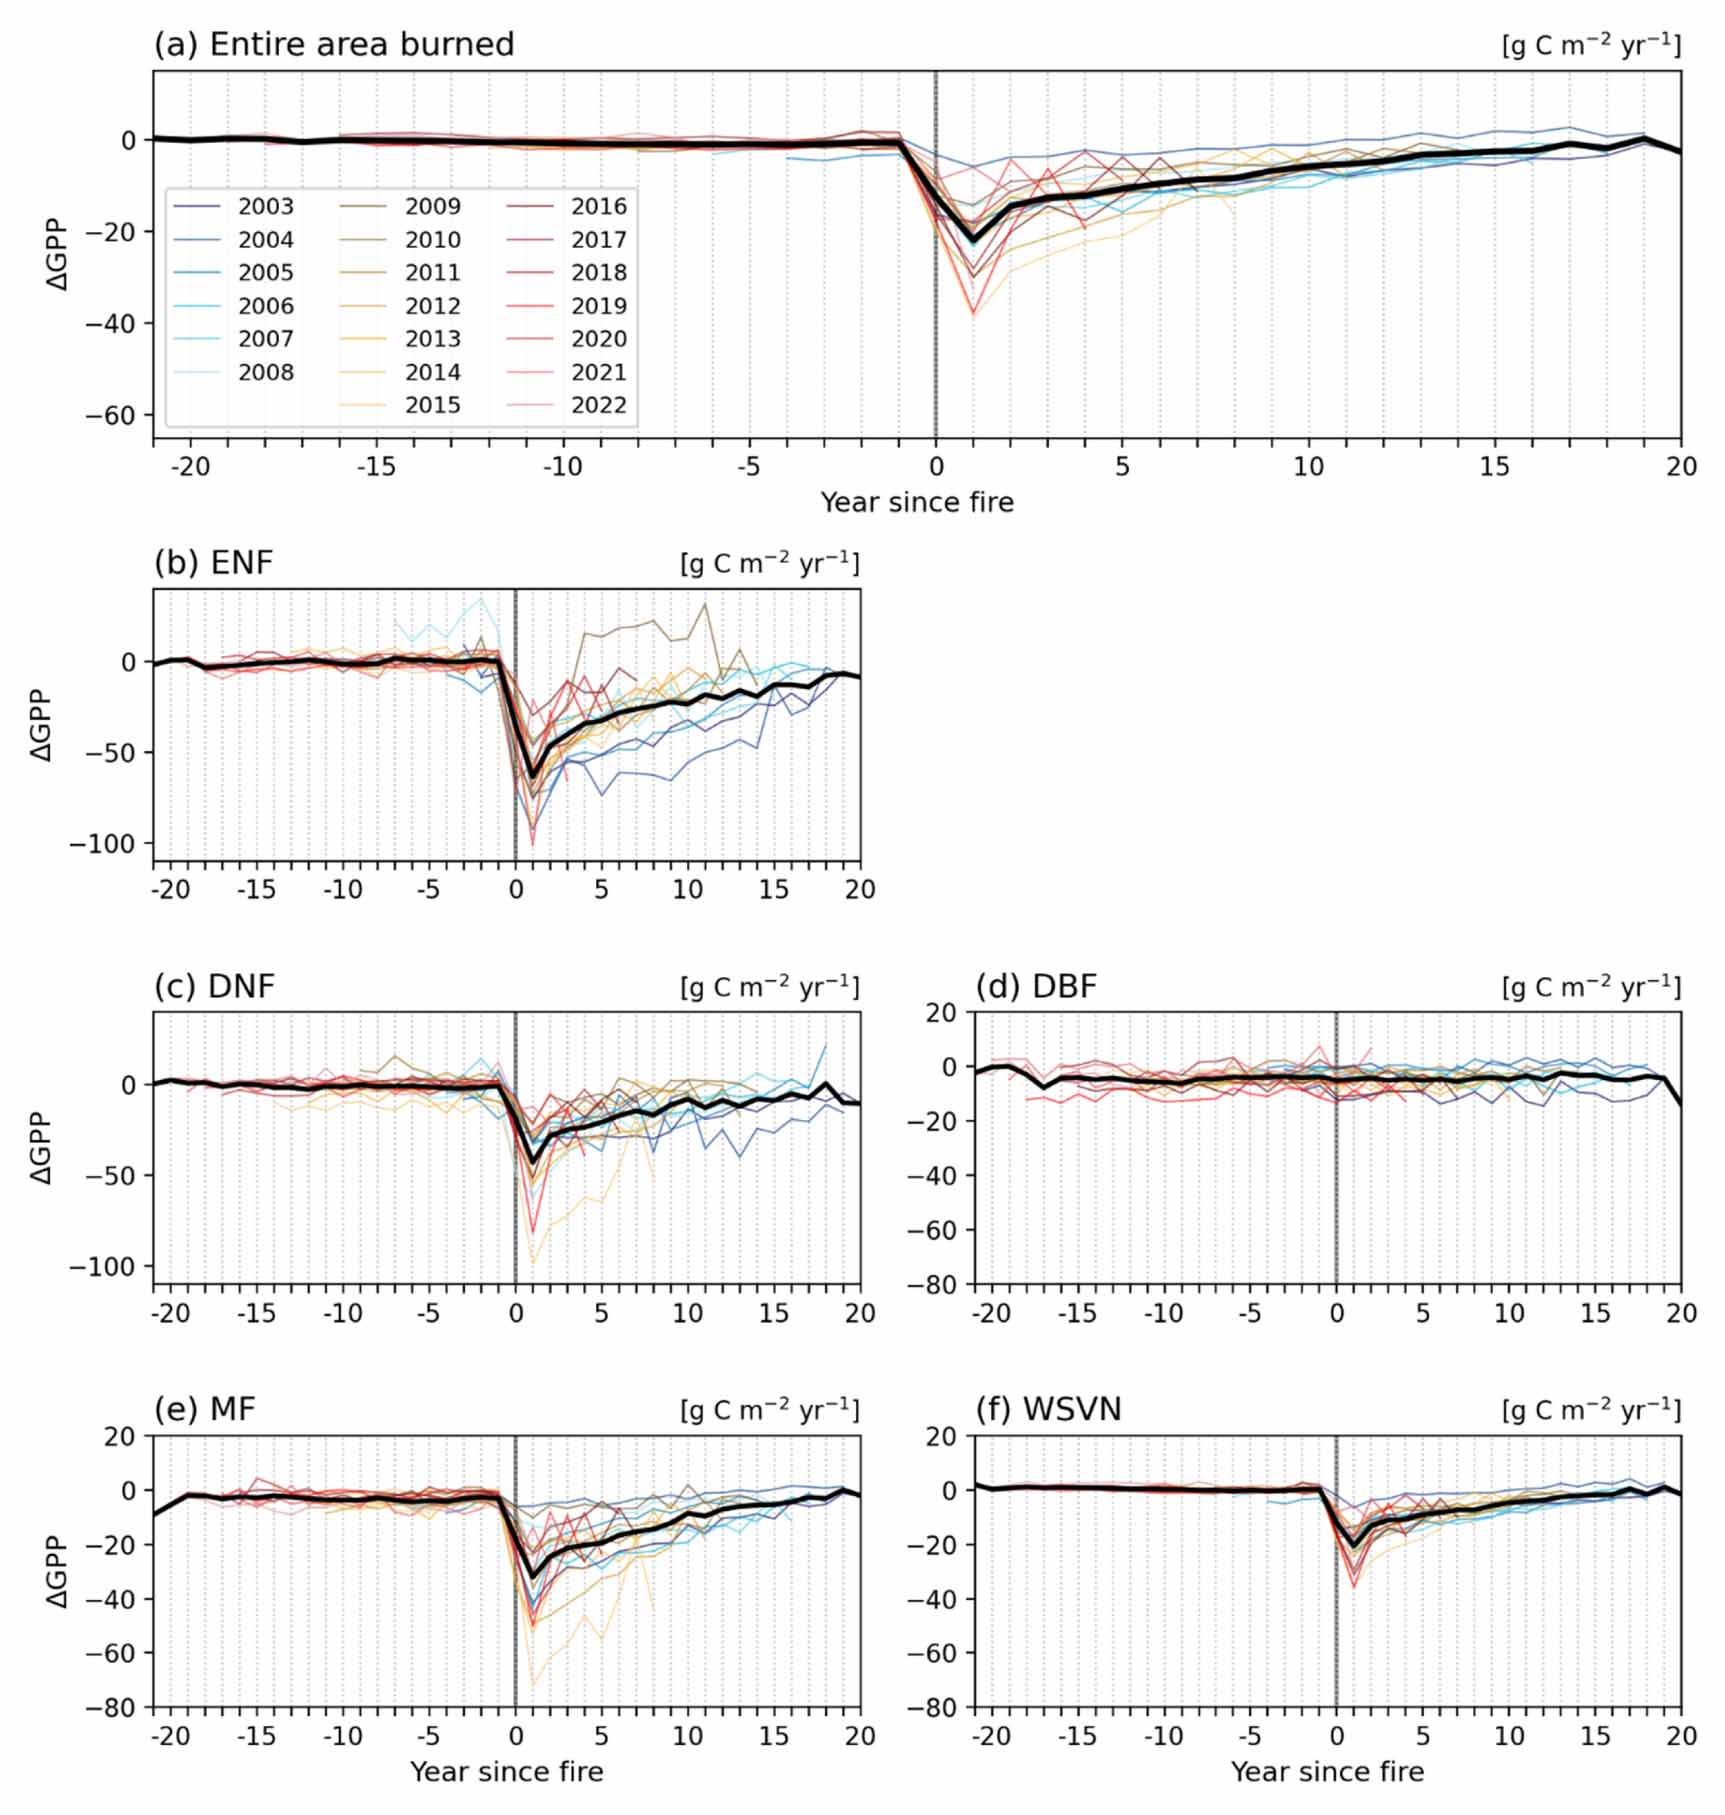
To understand the temporal variation in ΔGPP after wildfire, recovery curves of ΔGPP are derived using the concept of ‘year since fire’ that set the year of the wildfires as the zero point on the x-axis (see details in Methods; figure 4). Colored lines denote individual fire years (2003–2022), and the thick line indicates the mean recovery curve during the whole analysis period. Therefore, the longer the tail of the line extends along the x-axis, the more time has passed since the wildfire occurred. The variation of ΔGPP values were small in the pre-fire period (figure 4(a)), indicating relatively stable carbon uptake ability. However, following the wildfire occurrence, GPP rapidly declined, with ΔGPP reaching its maximum negative value in the first year of the post-fire period, demonstrating significant impact of wildfires on forest productivity. The magnitude of ΔGPP1yr is larger in recent years, suggesting intensified fire impacts on GPP. For example, the mean ΔGPP1yr for 2018–2022 is −22.9 g C m−2 yr−1, which is approximately 1.3 times larger than that for 2003–2007. After this initial reduction, ΔGPP gradually approaches pre-fire levels but does not fully return within the analysis period.
Figure 4. Temporal trajectories of ΔGPP from 20 years before to 20 years after wildfire occurrence, presented for (a) the entire study region and (b)–(f) five major forest types in Siberia: (b) evergreen needleleaf forest (ENF), (c) deciduous needleleaf forest (DNF), (d) deciduous broadleaf forest (DBF), (e) mixed forest (MF), and (f) woody savannas (WSVN). Thin colored lines indicate the ΔGPP time series for individual wildfire years from 2003 to 2022, while the thick black line represents the averaged ΔGPP across all years. The vertical line at year zero indicates the time of wildfire occurrence.
Download figure:
Standard image High-resolution image 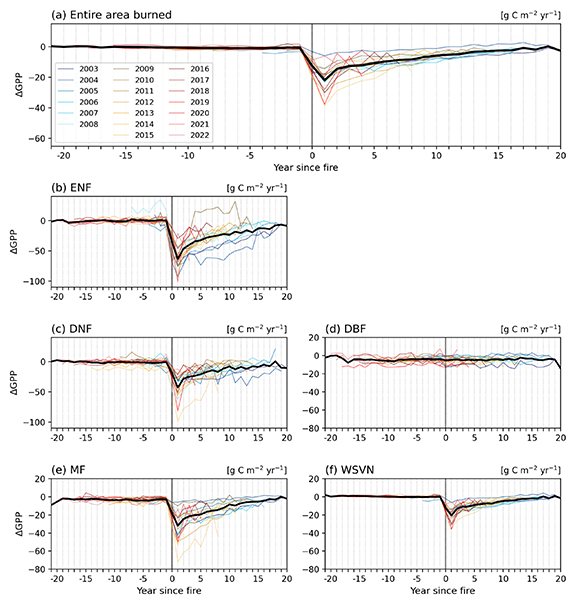
Recovery patterns of ΔGPP for the entire analysis domain were largely consistent across individual forest types except DBF (figure 4). The consistent pattern was characterized by small variations in ΔGPP before the fire occurrence, followed by a significant decrease in GPP in the year following the fire, and a gradual recovery thereafter. The magnitude of ΔGPP1yr differs among types, largest in ENF and progressively smaller in DNF, MF, and WSVN with the mean value of −63.4, −42.8, −32.1, and −20.7 g C m−2 yr−1, respectively (figures 4(b)–(f)). Unlike other forest types, DBF shows no clear recovery pattern, consistent with its smaller fire related GPP changes (figures 3(c) and 4(d)). In addition, the enlarged ΔGPP1yr in recent years was observed in DNF, MF, and WSVN types. In particular, the averaged ΔGPP1yr for WSVN, the mean over the most recent five years is −23.8 g C m−2 yr−1, about 1.3 times the mean for the first five years (p < 0.05; figure 4(f)). In contrast, ENF shows no clear relationship between the magnitude of ΔGPP1yr and the fire year (figure 4(b)). These suggest that the amplified ΔGPP1yr over entire Siberian forests is mainly caused by enlarging ΔGPP1yr in DNF, MF, and WSVN.
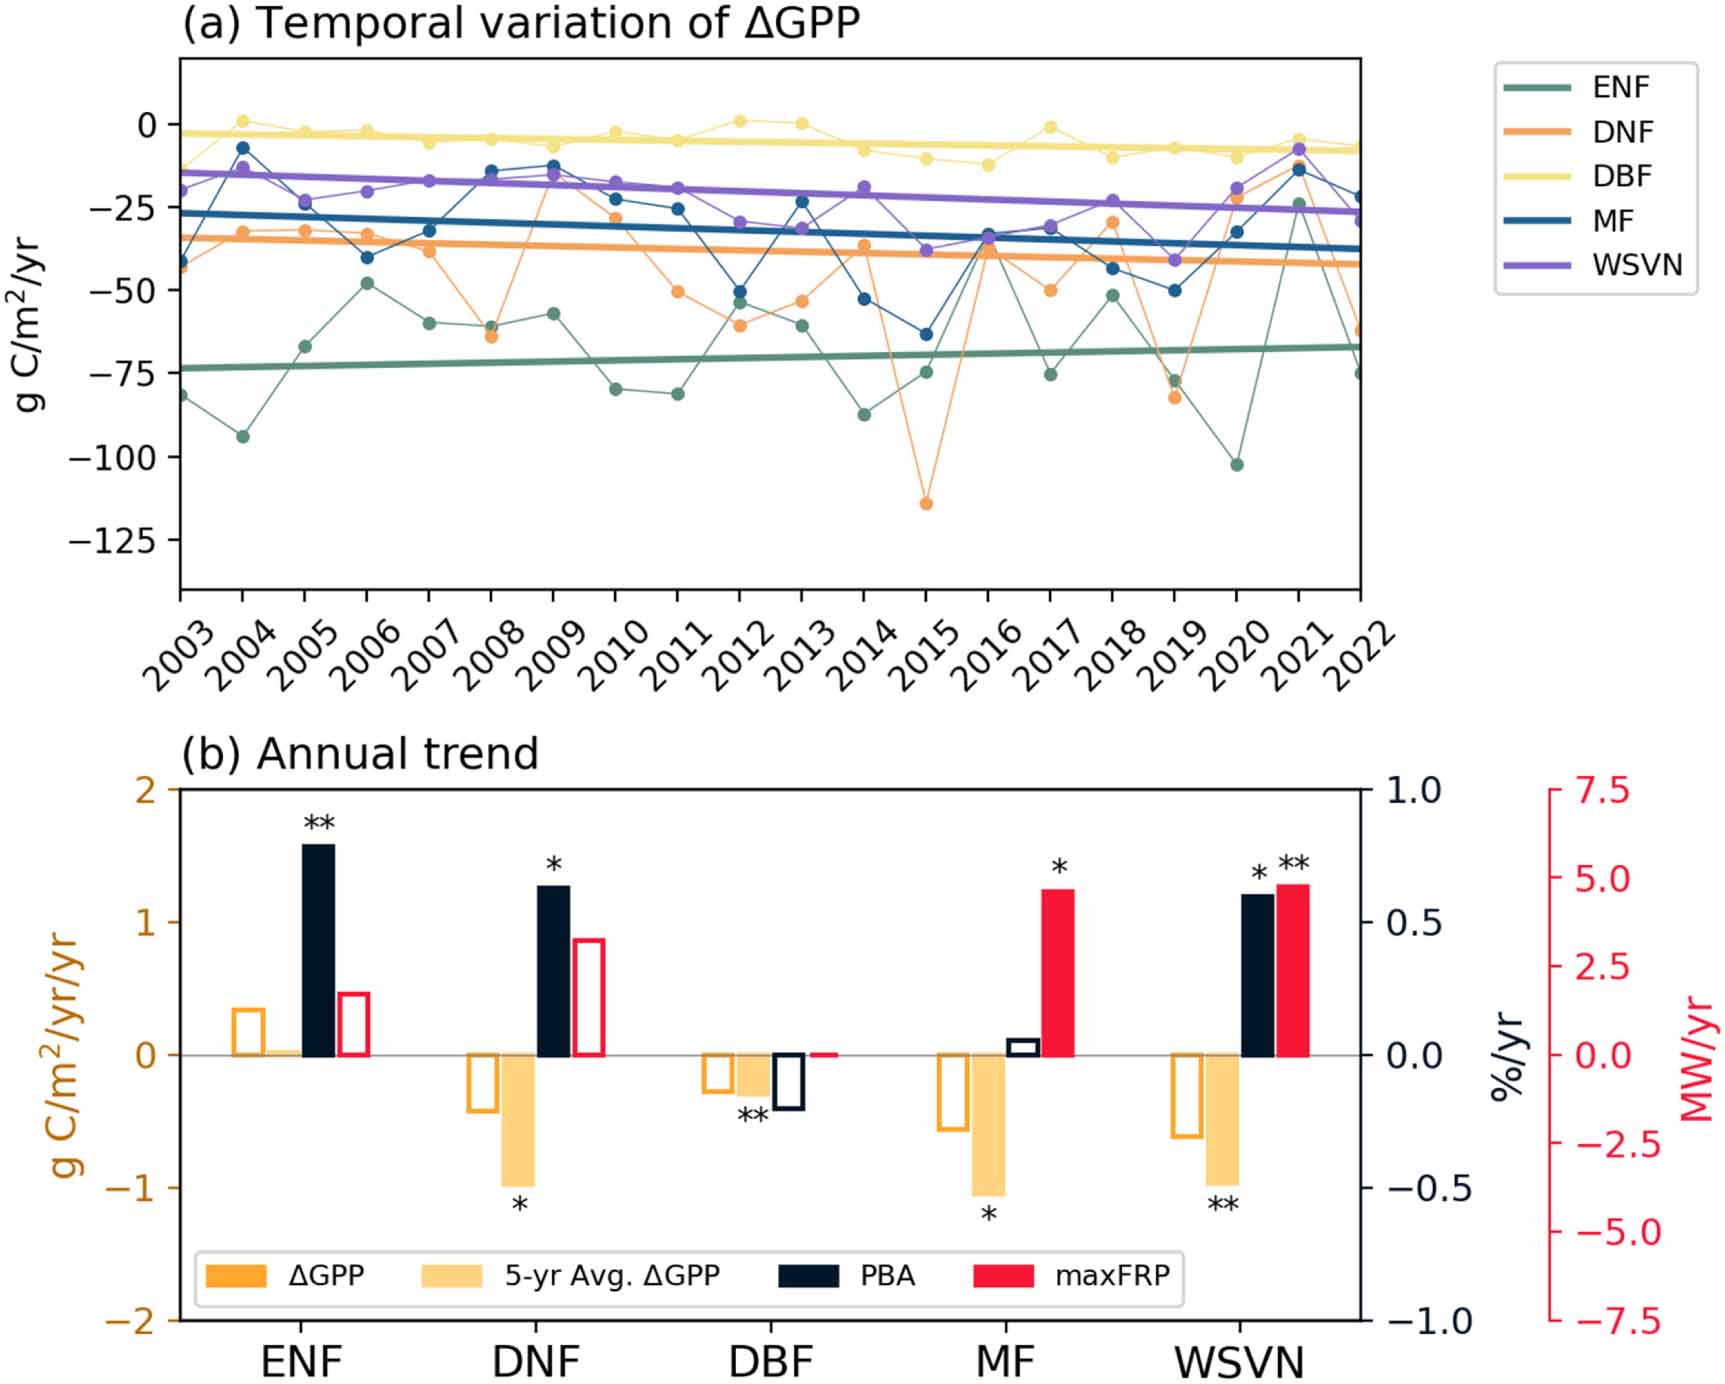
We further examined the temporal variation in ΔGPP1yr together with PBA and maxFRP across forest types (figure 5). The ΔGPP1yr shows a decreasing trend in DNF, DBF, MF, and WSVN by −0.42, −0.27, −0.57, and −0.62 g C m−2 yr−1 yr−1, respectively, while ENF shows a slight increasing trend of 0.34 g C m−2 yr−1 yr−1 (figure 5(a)). None of these annual trends is statistically significant, reflecting large interannual variability in the ΔGPP1yr. After applying a 5 year moving average, the decreasing trends in ΔGPP1yr become enlarged and significant for all forest types except for ENF (figure 5(b)). We also compared trends in ΔGPP1yr with trends in PBA and maxFRP, which represent extent of burned area and fire intensity, respectively. The negative ΔGPP1yr trends in DNF are connected to significant increases in PBA, whereas, for MF, positive maxFRP trend is relevant to decrease in ΔGPP1yr. The decreasing trend of ΔGPP1yr in the WSVN region aligned with significant increasing trends in both PBA and maxFRP. These results indicate that increasing extent and intensity of wildfire can raise the loss of photosynthetic carbon uptake.
Figure 5. Temporal variations and annual trends of ΔGPP1yr, PBA, and maxFRP from 2003 to 2022 across five forest types in Siberia. (a) Interannual variations of ΔGPP1yr with non-parametric trend lines derived from Sen’s slope estimates for ENF, DNF, DBF, MF, and WSVN. (b) Annual trends in ΔGPP1yr (orange bars, g C m−2 yr−1 yr−1), PBA (black bars, % yr−1), and maxFRP (red bars, MW yr−1), calculated using fire grid only. Trend significance was assessed using the non-parametric Mann–Kendall test. Colored bars with asterisks indicate statistical significance at the 95% (*) or 99% (**) confidence levels.
Download figure:
Standard image High-resolution image 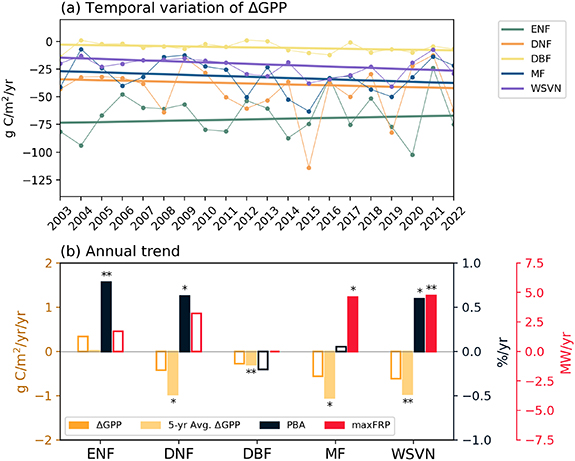
To assess the long-term GPP recovery, we analyzed the recovery rates of ΔGPP at 5 and 10 years after fire occurrences, i.e.  and
and  , for ENF, DNF, MF, and WSVN, which showed a clear pattern of GPP recovery (figure 6). The
  values for all four types are roughly half of pre-fire levels with minimum and maximum of 43.9 and 54.5% for MF and WSVN, respectively. After an additional five years, the
  is larger than
  by 15.7, 30.2, 38.4, and 20.6% for ENF, DNF, MF, and WSVN, respectively. Hence, after total 10 years later, DNF and ENF show the largest and smallest
  of 84.0 and 63.6%. These results demonstrate both rapid recovery of GPP during the initial five years and slowdown of GPP recovery during the subsequent five-year period, with different recovery rates across forest types, which is consistent with the temporal change in ΔGPP shown in recovery trajectories (figures 4 and 6). Note that the differences in recovery rates among forest types are consistent even when climate variables such as temperature, precipitation, and soil moisture are considered (tables S3 and S4).
Figure 6. Comparison of GPP recovery rates (%) at 5 and 10 years after wildfire events across four forest types in Siberia: evergreen needleleaf forest (ENF), deciduous needleleaf forest (DNF), mixed forest (MF), and woody savannas (WSVN). Grey (black) bars represent recovery rates at 5 years post-fire. The horizontal red dashed line is drawn at 70%, emphasizing the relatively slow recovery of ENF compared to DNF, MF, and WSVN forest types.
Download figure:
Standard image High-resolution image 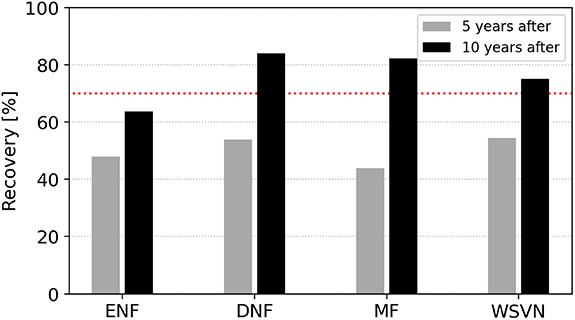
The present study examined spatial patterns of fire-induced GPP reductions across five forest types in Siberia using satellite-derived indices from MODIS. Our analysis revealed that wildfires cause substantial declines in GPP in the year following fire events, with an average reduction of 26.1 ± 74.5 g C m−2 yr−1. The spatial patterns of GPP reduction one year after fire occurrence closely aligned with those of PBA, indicating that burned areas consistently experience marked declines in photosynthesis activity. The spatial distribution of fire impacts on GPP also corresponds with regions identified as experiencing massive reduction of live above-ground biomass carbon as well as a change in land surface temperature due to wildfires (Liu et al 2019, Fan et al 2023). These spatial coherences highlight the persistent and widespread influence of wildfire on both biophysical and biogeochemical processes in Siberian forests.
Gradual recovery of the GPP is commonly observed over burned areas after a substantial decrease in GPP. However, the GPP in the post-fire period is generally smaller than that in the pre-fire period within our analysis period. This indicates that complete recovery of wildfire-induced GPP loss over Siberian forests may require more than a decade. Previous studies have also suggested long timelines for post-fire vegetation dynamics in Siberia. An analysis using vegetation indices, NDVI and normalized difference shortwave infrared index, showed that more than 13 years are required for the recovery of canopy greenness and canopy moisture contents after fire events (Cuevas-gonzález et al 2009). Consistently, surface albedo and radiative feedback have also shown to persist for over a decade following wildfire disturbances in the Siberian boreal region (Stuenzi and Schaepman-Strub 2020, Zhao et al 2024). In the larch forest, the restoring time for GPP to pre-fire levels after fire occurrence was estimated by 3–15 years based on both satellite-retrieved and field-based observations (Kharuk et al 2023). These results suggest a persistent reduction in photosynthetic carbon uptake capacity across Siberian forests until the full recovery of the forest ecosystem. Hence, the long-term monitoring of post-fire GPP recovery is essential for refining our understanding of wildfire impacts on the terrestrial carbon budget and improving the prediction of ecosystem resilience in fire-prone boreal forests.
The trajectory of GPP recovery after the wildfire was varied by forest types (Chu and Guo 2014, Shvetsov et al 2019, Zhang et al 2023). In Siberia, the ENF showed the slowest recovery rate, reaching only 63.7% at 10 years post-fire, which is over 10% lower than those in the DNF, MF, and WSVN. This delayed recovery in the ENF region is broadly consistent with previous assessments on the recovery time for post-fire vegetation productivity at both regional and global scales (Hemes et al 2023, Xu et al 2024). Relatively late GPP recovery of ENF might be related to seed dispersal limitation due to the scarcity of surviving seed sources within burned area (Tautenhahn et al 2016, Falk et al 2022). Permafrost thaw and associated changes in soil hydrology following fire can delay regeneration by altering active layer depth and increasing soil instability (Gibson et al 2018, Aaltonen et al 2019). In addition, ENF stands are often subject to high-intensity crown fires, which cause more severe canopy mortality and deeper combustion of soil organic layers compared with surface fires in deciduous or mixed forests (Héon et al 2014, Baltzer et al 2021, Mack et al 2021). These interacting factors likely act together to slow down the post-fire recovery of GPP in the ENF, which is even consistent with larger warming in post-fire period through strengthened biophysical feedback in corresponding regions (Zhao et al 2024). In contrast, the  for DNF is up to 84.0%, reflecting higher regeneration potential (Jorgensen et al 2023). The largest
  for WSVN could be attributed to a relatively high proportion of herbaceous plants and a low proportion of woody biomass (Friedl and Sulla-Menashe 2022). Further, different recovery rate between forest types could be enlarged under future warmer climate accompanying intensified wildfire (Descals et al 2022, Kim et al 2024), which acts as unfavorable condition for the regrowth of ENF. Therefore, our results highlight the importance of considering species-specific characteristics for assessing post-fire recovery of vegetation and further evaluating the long-term carbon budgets in burned regions.
We identified enlarged and persistent impacts of wildfire on photosynthetic carbon uptake across the Siberian boreal forests, emphasizing the growing influence of wildfires on the terrestrial carbon cycle. The spatial and temporal variability of post-fire GPP recovery, particularly the delayed recovery in ENF, highlights the importance of incorporating forest-specific characteristics to carbon dynamics after fire disturbances. These results can provide guidance for forest-type-adapted management. For example, the slow recovery of GPP in ENF suggests that management policy should prioritize fire prevention and post-fire regeneration support. For other forests with relatively fast recovery, managements need to focus on facilitating regrowth and reducing the risk of repeated burns. These type-specific strategies can raise the effectiveness of forest management on reducing fire impacts.
Our findings are restricted to GPP, focusing on wildfire-induced changes in photosynthetic carbon uptake. However, we acknowledge that post-fire carbon balance is also strongly influenced by heterotrophic respiration from soils, decomposition of coarse woody debris, and direct combustion emissions (Mack et al 2021, Fan et al 2023, Webb et al 2024). Neglecting these processes may lead to an underestimation of the total carbon loss associated with wildfires. Further, the GPP and other retrieved variables obtained from MODIS are suffer from the uncertainties relevant to coarse spatial resolution, cloud contamination, and retrieval errors (Turner et al 2006, Boschetti et al 2019). In particular, the fire-relevant products such as BA and maxFRP are known to be underestimated under the presence of dense aerosols, smoke plumes, and cloud, inducing signal attenuation and misclassification of fire pixels (Freeborn et al 2014, Giglio et al 2016). Hence, future research should integrate GPP dynamics with respiration and combustion fluxes, combining remote sensing, site-level observations and process-based modeling, to provide a more comprehensive understanding of wildfire impacts on the terrestrial carbon budget.
This study was supported by Korea Environment Industry & Technology Institute (KEITI) through Project for developing an observation-based GHG emissions geospatial information map, funded by Korea Ministry of Environment (MOE) (RS-2023-00232066) and the Research Program for the carbon cycle between oceans, land, and atmosphere of the National Research Foundation (NRF) funded by the Ministry of Science and ICT, South Korea (NRF-2022M316A1090965).
The moderate resolution imaging spectrometer (MODIS) monthly vegetation indices, daily albedo, gap-filled 8 d gross primary production, daily thermal anomalies and fire, burned area, land cover types, and land surface temperature data can be retrieved from the NASA EOSDIS Land Processes Distributed Active Archive Center at https://doi.org/10.5067/MODIS/MOD13C2.061, https://doi.org/10.5067/MODIS/MCD43C3.061, https://doi.org/10.5067/MODIS/MOD17A2HGF.061, https://doi.org/10.5067/MODIS/MOD14A1.061, https://doi.org/10.5067/MODIS/MCD64A1.061, https://doi.org/10.5067/MODIS/MCD12C1.061, and https://doi.org/10.5067/MODIS/MOD11C3.061, respectively.
Supplementary Tables and Figures available at https://doi.org/10.1088/1748-9326/ae1245/data1.
The authors declare no conflicts of interest.