1748-9326/20/11/113006
Abstract
Social vulnerability plays a critical role in shaping the impacts of flooding, yet the ways in which it is measured remain inconsistent and often disconnected from local realities. As climate-related flood events intensify globally, there is an urgent need to understand how social vulnerability is conceptualized and assessed to inform more equitable and effective risk reduction strategies. This paper reports the results of a systematic literature review on indicators and indexes used to assess social vulnerability to floods. Utilizing the PRISMA methodology, we identified and screened 1621 studies published between 2013 and 2023, selecting 36 peer-reviewed publications for examining how social vulnerability indices have been conceptualized, construct…
1748-9326/20/11/113006
Abstract
Social vulnerability plays a critical role in shaping the impacts of flooding, yet the ways in which it is measured remain inconsistent and often disconnected from local realities. As climate-related flood events intensify globally, there is an urgent need to understand how social vulnerability is conceptualized and assessed to inform more equitable and effective risk reduction strategies. This paper reports the results of a systematic literature review on indicators and indexes used to assess social vulnerability to floods. Utilizing the PRISMA methodology, we identified and screened 1621 studies published between 2013 and 2023, selecting 36 peer-reviewed publications for examining how social vulnerability indices have been conceptualized, constructed, and applied, as well as the range of indicators, and methodological approaches used. We identified 78 indicator sets across 22 thematic domains. Results indicate that most attention has been given to a small set of indicators focusing on at-risk populations, socioeconomic factors, housing, and employment, while other factors such as health conditions, disaster preparedness, social connectedness, gender minorities, and sexuality are consistently underrepresented. Many studies rely on established frameworks without adapting them to local socio-cultural contexts and use census and secondary data sources, providing limited household-level and qualitative insights. Lack of methodological transparency, particularly regarding normalization and weighting, is common as is insufficient validation and ground-truthing. Greater attention to these issues, along with empirical case studies, is needed to provide in-depth insights into the root causes of social vulnerability and inform policies better tailored to local realities. This review highlights significant conceptual and methodological gaps, calling for more context-sensitive, mixed-method, and empirically validated approaches to improve the robustness and local relevance of social vulnerability assessments in flood-prone areas.
Export citation and abstractBibTeXRIS
Climate science projects that extreme precipitation will become more frequent and intense [1], leading to increased riverine, coastal, and flash floods. These events already cause significant global losses [2] and their impacts are further amplified by land-use changes, especially rapid urbanization [3, 4]. The consequences of flooding, however, are not distributed evenly. They depend not only on biophysical exposure but also on the social vulnerability of affected populations [5]—an area of growing concern in both research and policy domains [6, 7].
Vulnerability is a multifaceted and evolving concept, interpreted differently across disciplines [8, 9], and epistemologically framed by the social, engineering, health, or biophysical sciences [10–12]. The IPCC, for example, has shifted its focus over time from threats to human well-being [13] to encompassing natural systems [14] and back to human systems as the primary domain of vulnerability [15]. Some frameworks emphasize biophysical exposure and sensitivity [16], while others the capacity of individuals and systems to anticipate, cope with, and recover from harm [17, 18]. The term social vulnerability captures the human dimension of risk, highlighting how societal, cultural, economic, and institutional factors shape the ability of individuals, groups, and communities to cope with hazards [19–21]. In flood contexts, socially vulnerable population often experience disproportionate harm due to structural inequalities, marginalization, and limited access to resources [22–24]. These dynamics are often measured using social vulnerability indices (SVI), which use a set of indicators to spatially assess and compare vulnerability across regions or populations [5, 21, 25].
While there is broad consensus on the importance of assessing social vulnerability, divergent epistemologies and purposes have led to widely different conceptualizations, indicator choices, and methodological practices [5, 26–30]. The study and application of SVIs have expanded significantly since the early 2000s [31], prompting a growing number of conceptual and empirical reviews synthesizing the contributions and limitations of this evolving scholarship e.g. [32–35]. While these reviews have advanced the field, most have focused on social vulnerability in the context of multi hazards [36], climate change [37], geophysical hazards [38], or emphasizing the methodological and empirical limitations in SVI applications [35, 39, 40]. Few reviews, however, have examined SVIs in the context of flooding [34, 41]. Rufat, et al [34] synthesized 67 studies published between 1997 and 2013, examining interrelationships among indicators and research needs, while Isia et al [41] reviewed 11 studies from 2010 to 2022 but remained geographically limited and discipline-specific, potentially missing broader contextual diversity.
There is yet to be a systematic evaluation of the methodological choices underpinning the flood SVIs—how vulnerability is conceptualized and operationalized, how indicators are selected, normalized, weighted, and validated, or how well these indices reflect the contextual complexity of flood vulnerability. This review addresses this gap by identifying and examining peer-reviewed publications from 2013 to 2023 focused on social vulnerability in the context of riverine, coastal, flash, and pluvial (urban) flooding—hazards that share overlapping risk pathways and for which vulnerability is commonly assessed using similar frameworks and indicators [34]. This review makes three key contributions: (1) it systematically maps recent empirical studies, offering an updated synthesis of how social vulnerability to flooding is conceptualized, measured, and applied; (2) examines thematic and methodological diversity in indicator selection, index construction, and data sources, highlighting dominant practices and persistent limitations; and (3) identifies under-researched or undertheorized areas, underrepresented indicators, and epistemological tensions in the literature.
The review was conducted using the five stage framework developed by Arksey and O’Malley [42], to ensure a transparent and comprehensive process and the reliability of the search strategy. We also adhered to the PRISMA checklist for reviews [43] to enhance transparency in reporting, and followed recommendations for conducting knowledge syntheses in environmental change focused research [44].
2.1. The search process
2.1.1. Search strategy
Searches were carried out in December 2023, using two complementary search strategies: a structured bibliographic search (Strategy A) and a snowballing method (Strategy B).
Strategy A—bibliographic search of Scopus, Web of Science and Google Scholar was used to obtain a comprehensive sample of published literature. To capture as much of the relevant evidence as possible, we used a combination of keywords related to ‘soci* vulnerab*’ or ‘soci* suscept*’ or ‘SoVI’ or ‘SVI’ combined with ‘flood*.’ A wildcard (*) was used (except in Google Scholar) to capture multiple word endings (e.g. flood* would capture floods, flooding etc. and ‘soci* vulnerab*’ would capture social vulnerability and socioeconomic vulnerability). In Google Scholar, a simplified keyword was applied due to search limitations. We used keywords ‘social vulnerability’ or ‘social susceptibility’ OR ‘socioeconomic vulnerability’ OR ‘socio-economic vulnerability’ AND ‘flood’ OR ‘floods’ OR ‘flooding’ for search. In Web of Science and Scopus we filtered results by language ‘English,’ document type ‘Article,’ and publication years ‘2013–2023.’ The Google Scholar search results were manually filtered by language ‘English’ and document type ‘Article.’ The searches were conducted using the credentials of the University of Leeds library. The search strings are indicated in table 1, and the Google Scholar search strategy is detailed in table 2.
Table 1. Final search strings used.
FiltersDatabaseSearch stringSearch results Document type: articlePublication years: 2013–2023 Language: EnglishScopusTITLE-ABS-KEY ((‘soci* vulnerab*’ OR ‘soci* suscept*’ OR ‘SoVI’ OR ‘SVI’) AND (flood*))479 Web of ScienceTS = ((‘soci* vulnerab*’ OR ‘soci* suscept*’ OR ‘SoVI’ OR ‘SVI’) AND (flood*))899 Google ScholarAllintitle: ‘social vulnerability’ OR ‘social susceptibility’ OR ‘socioeconomic vulnerability’ OR ‘socio-economic vulnerability’ OR ‘SoVI’ OR ‘SVI’ AND ‘flood’ OR ‘floods’ OR ‘flooding’243
Table 2. Google scholar search strategy.
Search oneWith the exact phraseSocial vulnerability With at least one of the wordsFlood OR floods OR flooding All sources extracted198
Search twoWith the exact phraseSocial susceptibility With at least one of the wordsFlood OR floods OR flooding All sources extracted1
Search threeWith the exact phraseSocioeconomic vulnerability With at least one of the wordsFlood OR floods OR flooding All sources extracted19
Search fourWith the exact phraseSocio-economic vulnerability With at least one of the wordsFlood OR floods OR flooding All sources extracted24
Search fiveWith the exact phraseSoVI OR SVI With at least one of the wordsFlood OR floods OR flooding All sources extracted1
Strategy B—snowballing sampling method was utilized in the full-text review and coding phases. This involved systematically reviewing the reference lists of all articles included after full-text screening to identify any additional relevant articles that might have been missed by the initial search. An additional 6 articles were identified using this approach and subsequently included in the review after assessment against the eligibility criteria.
2.1.2. Full text retrieval
The full texts of eligible articles were mostly retrieved using the University of Leeds library subscriptions. We used alternative strategies for articles that were not available from subscribed journals such as requests for full-text access to the corresponding authors or approached authors on ResearchGate to request full-text copies of articles. The results from the searches were imported into the endnote reference manager and aggregated into library files for systematic management and duplicate removal. When different versions of an article were found (e.g. a preprint and a published version), the published version was included. The results were then screened against the predefined eligibility criteria (see below) to identify relevant articles.
2.2. Summary of search
The systematic study selection process, adhering to PRISMA guidelines, is summarized in figure 1. A total of 479 records were retrieved from Scopus, 899 from Web of Science, and 243 from Google Scholar, resulting in 1621 records in total. After removing duplicates (n = 439) in EndNote, 1182 articles were advanced for title and abstract screening. A total of 931 articles were excluded at this stage due to irrelevance based on the pre-defined eligibility criteria (as detailed in section 2.3), which left 251 articles for full-text screening. During the full-text screening, 4 articles proved inaccessible, and 189 articles did not meet the inclusion criteria. The rigorous application of our eligibility criteria, particularly those regarding the specific focus on social vulnerability in flood contexts and the exclusion of integrated or overly broad vulnerability assessments, led to their exclusion. This left 58 articles for initial synthesis.
Figure 1. Flowchart of study selection: Reproduced from [45]. CC BY 4.0.
Download figure:
Standard image High-resolution image 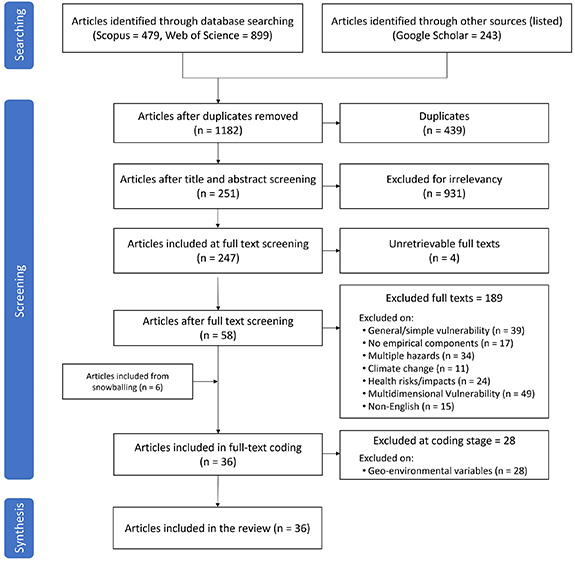
An additional 6 articles were identified and included through the snowballing search strategy. In the final, comprehensive data coding and synthesis phase, an additional 28 articles were excluded due to their focus on geo-environmental variables. This highly selective process resulted in a final set of 36 articles for data extraction and comprehensive analysis. The reduction from 1621 initial records to 36 final articles is an outcome of applying stringent, pre-defined eligibility criteria to ensure that only the most relevant and methodologically appropriate studies for our specific research questions were included. This narrowing process was not based on exclusion of specific geographic regions, methods, or themes; rather, studies from diverse locations and using varied approaches were included if they met the core pre-defined eligibility criteria. Table B1 in supplementary material B provides the complete list of articles included in the systematic literature review.
2.3. Screening and study eligibility criteria
The entire screening process (title/abstract screening, full-text review, and initial data extraction) was conducted primarily by the lead author. To ensure methodological rigor and minimize potential for bias, the eligibility criteria were developed and refined by all authors prior to commencing the screening. Furthermore, a pilot test of the data extraction form (as detailed in section 2.4) served as an internal consistency check. All the articles were then checked against the following pre-defined eligibility criteria: general eligibility criteria:
(1)
Written in English.
(2)
Focus on social vulnerability in flood contexts.
(3)
Peer-reviewed journal articles published between 2013 and 2023.
Rationale for general criteria: We only included English-language publications due to limited resources for working with other languages during screening, full review, and data extraction. Sources other than peer-reviewed journal articles such as grey literature (e.g. reports, policy briefs, and working papers), were excluded to ensure the review focused on academic work that has undergone peer-review process and methodological scrutiny. All included studies were evaluated for quality and potential biases, and there was no evidence of bias.
Exclusion criteria applied at title and abstract screening stage:
- Exclude non-English language articles.
- Exclude articles not specifically focusing on social vulnerability in the context of floods.
- Exclude articles which mention social vulnerability, but it is not the primary focus.
- Retain: If eligibility of articles was difficult to establish from the title and abstract alone, they were retained for full-text screening to ensure no relevant studies were inadvertently excluded.
Exclusion criteria applied at full-text screening stage:
- Exclude articles without an empirical component or without full text access.
- Exclude articles focusing on multiple hazards (e.g. drought, earthquake) or broader public health risks and climate change, where social vulnerability to floods was not the primary empirical focus.
- Exclude articles with integrated vulnerability analysis that combine social vulnerability with flood exposure/inundation or flood hazard characteristics (magnitude, duration, frequency, and severity). However, studies considering exposure indicators (relating to household and population) within the conceptualization and measurement of social vulnerability itself were included.
- Exclude articles conducting multi-dimensional vulnerability analysis unless multiple dimensions are specifically considered within social vulnerability analysis. For instance, studies considering economic dimension in conjunction with social dimension, conceptualized as socio-economic vulnerability analysis, were included.
- Exclude review articles, book chapters, and conference proceedings.
2.4. Data extraction and coding strategy
We used a pre-defined, standardized data extraction form covering bibliographic information, study location, flood and study type, vulnerability domains and indicators, as well as research design and methodological choices (e.g. quantitative, qualitative, mixed-methods, data sources, analytical techniques). The extraction form is provided in supplementary material A, table A1. To ensure reliability and consistency, a pilot test of the data extraction criteria and coding scheme was conducted on a small sample of articles (n = 5), with all authors involved in identifying ambiguities and refining the template. The finalized template was then used to systematically extract and code data into Microsoft Excel form, where regular meetings amongst co-authors were held to ensure consistency, resolve ambiguities, and ensure a shared interpretation of the coding criteria.
3.1. Geographical distribution of the studies
The geographical distribution of the studies is global, with publications appearing across various regions (figure 2). However, the overall number of studies remains low, with a relatively even spread across locations.
Figure 2. Geographical distribution of studies.
Download figure:
Standard image High-resolution image 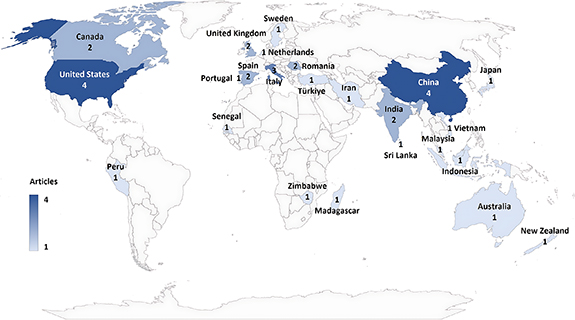
Most studies (n = 22) examined contexts encompassing both urban and rural areas (figure 3). Within this group, analyzes of riverine floods were present in 8 studies, multiple flood types in 8 studies, coastal floods in 3 studies, and 3 studies did not specify the flood type. Separately, among studies exclusively focusing on urban settings (n = 9), 4 studies focused on riverine floods, 2 studies on coastal floods, and one study each on urban floods, flash floods, and multiple flood types. For studies exclusively addressing rural settings (n = 5), riverine floods were the dominant focus (4 studies), with one study examining flash floods.
Figure 3. Study setting and flood type.
Download figure:
Standard image High-resolution image 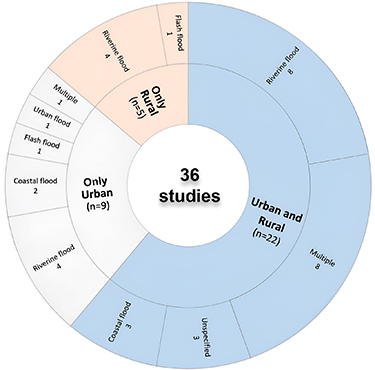
3.2. Methodological choices in research design
Most studies employ indicators of social vulnerability and aggregate them to create a vulnerability index. The construction of composite vulnerability indices involves several stages such as the selection of indicators, the normalization process, the weighting of indicators, and aggregation [46]. We synthesize results regarding these stages below.
3.2.1. Social vulnerability conceptualization
3.2.1.1. Definition
Most studies (n = 27) define vulnerability, while the rest (n = 9) lack a clear definition or define SVIs or vulnerability more broadly. The definitions of social vulnerability draw on published articles: 13 studies cited Cutter, et al [5] or Cutter and Finch [47], 5 studies refer to Wisner et al [48], 4 studies cited Adger [49] and Adger [50], and 3 studies refer to the IPCC [51, 52]. Other cited authors include Turner et al [53], Flanagan et al [26] and Cardona [54]. The definitions consistently emphasize factors that constrain specific groups’ ability to manage risks posed by floods, including challenges related to preparation, response, and recovery. Several studies (n = 9) used definitions considering exposure, susceptibility (or sensitivity), and resilience (or adaptive capacity) as components of vulnerability. For instance, vulnerability is defined as a function of exposure (of people and assets at risk), sensitivity (the level of impact on people and assets at risk), and resilience (the ability of the social system to resist, absorb, cope with, adapt, and recover from on impact) ([27, 55, 56], citing the IPCC [51, 52] and Cutter et al [57]).
3.2.1.2. Conceptual framework
Many reviewed studies (n = 19) employed a conceptual framework to guide analysis of social vulnerability. Most (n = 9) had frameworks incorporating components such as exposure, susceptibility (or sensitivity), and resilience (or adaptive capacity), guided by Birkmann et al’s [58] MOVE framework (n = 4) and the IPCC framework [51, 52, 59] (n = 5). The place-hazard model and Social Vulnerability Index (SoVI) based on Cutter [60] and Cutter et al [5], were the second most referenced (n = 8) frameworks. Across the studies reviewed, the application of these frameworks was often referential rather than reflective—many authors cited SoVI, MOVE, or IPCC without articulating how these models were adapted or critically assessing their relevance to specific geographic or sociopolitical contexts. In particular, 17 studies did not elaborate on their conceptual framework at all, and lacked clear definitions of their key concepts, the underlying dimensions, and explanations of how these dimensions interact to generate vulnerability. Even among those that did, theoretical engagement was often superficial. For example, some articles cited Cutter et al’s SoVI as their inspiration without detailing its key assumptions and components. Nevertheless, many of these studies e.g. [61–63] referenced a diverse set of vulnerability theories, indices or broader work on vulnerability as starting points of their own work.
3.2.2. Methodological approaches for social vulnerability measurement
3.2.2.1. Methods for operationalizing vulnerability indicators
Deductive, inductive, hierarchical, and normative approaches were used in the articles to operationalize the conceptual frameworks and to select vulnerability indicators. The deductive approach is theory-driven and often involves fewer than ten indicators based on frameworks, theories, or models. The hierarchical approach often considers up to twenty indicators, which are separated into groups of sub-indices. The data-driven inductive approach is based on large datasets of more than twenty indicators. The list of indicators is generated from a large set of variables and reduced to a smaller number with statistical methods such as principal component analysis (PCA) [39]. The normative approach selects indicators based on expert judgment, stakeholder input or community consultations. Indicator development is usually based on one or a combination of these approaches. Most studies (n = 29) combined multiple methods to identify or select indicators (table 3). Fewer studies used exclusively the inductive (n = 3), hierarchical (n = 2), or deductive (n = 2) method. A combined deductive and hierarchical approach (alone or together with other approaches) was the most common, used in 16 studies. Deductive and inductive approach combination (alone or together with other approaches) was used in 13 studies. Only 8 studies used normative approach with other approaches.
Table 3. Approaches to operationalizing social vulnerability.
Operationalization approachWith frameworkWithout clear framework Deductive11 Hierarchical—2 Inductive21 Mixed1613
Total1917
The articles used many approaches for selecting indicators. About half of the studies (n = 17) relied only on literature review. Eight studies used a qualitative approach alone or together with interviews and focus groups in communities or with first responders, emergency managers, or experts on social vulnerability measures. Some interviews were part of identification or development of indicators, while others were used to check or inform these measures. Seven studies used secondary sources such as reports or databases alone or alongside a literature review to develop an indicator set. The remaining studies (n = 4) used personal judgment and a literature review.
3.2.2.2. Adaptation to local context
The frameworks used in the articles, such as the MOVE framework [58] or SoVI [5], were designed in the Western contexts and may not fully capture the social, economic, cultural, and environmental dynamics of other contexts. A total of 20 articles attempted to adapt their frameworks and indicator sets to the geographic, social, or cultural contexts of their study regions. This was done by e.g. adding or excluding dimensions, adapting indicators to better represent local conditions, or weighting or ranking the indicators to reflect local priorities.
However, the methodology for undertaking these adaptations was typically not explicit. For instance, Roder et al [23] modified SoVI by excluding housing characteristics, critical infrastructure, awareness and coping capacities, focusing solely on socioeconomic and demographic variables in Italy, arguing that it is important to focus on fewer dimensions of social vulnerability to highlight a particular context under flood hazard. Tellman et al [64] in turn modified SoVI by adding rurality % and interactions of race and class based on literature indicating their association with fatalities and damages during a flood event. Török [65] adapted SoVI for Romania by selecting 27 socioeconomic, demographic, and built infrastructure variables, based on their critical influence on social vulnerability to flood hazards on the basis of the literature. Lianxiao and Morimoto [66] adapted the MOVE framework to assess social vulnerability to floods by incorporating 11 local indicators to the exposure, susceptibility, and resilience components, on the grounds that they are important local drivers of social vulnerability. Mason et al [67] also adapted the MOVE framework by identifying further potential indicators for measuring exposure, susceptibility, and lack of resilience—based on earlier used indicator sets, expert advice, and testing with stakeholders.
Some studies (n = 8) used qualitative approaches alone or in combination with other approaches. They often involved interviews and focus groups in communities or with experts and practitioners to establish indicator importance in the local context. For instance, Oulahen et al [68] presented their SoVIs, developed for five North American municipalities, to local practitioners in them to gather feedback on the relevance of their variables and their grouping, use in decision-making, and variable weight. Practitioner feedback was then used to develop a second version of the SoVIs. Liu and Li [22] also used interviews with experts and farmers to identify indicators, while Chen, et al [69] utilized interviews and field research to identify indicators. Karunarathne and Lee [70] conducted interviews with flood-affected households to check the suitability of selected variables for social vulnerability to flooding. Mavhura et al [71] conducted interviews and focus groups with experts and long-term residents to screen indicators for social vulnerability. Englund et al [56] engaged stakeholders using three workshops, interviews, and informal exchanges, to identify indicators of social vulnerability specific to different contexts and locations.
Few studies used ranking of indicators or assigning different weights to them as a form of contextual adaptation. In some studies, local experts were consulted to decide context-dependent weights or ranking of indicators based on their importance, while other studies appealed rather informally to the authors’ experience or previous studies as the ground for assigning weights.
3.2.3. Spatial resolution and data sources
Ten studies focused on statistical and census units, while 9 studies analyzed data at broader administrative and local levels (e.g. municipalities, towns, cities, counties). Additionally, 10 studies had higher spatial resolutions, comprising neighborhood-level (n = 5) and household-level (n = 5), a low number considering they are crucial for understanding localized, individual and family-specific vulnerabilities. Figure 4 presents the relationship between the geographic units of data collection and analysis and the sources of data used in the reviewed studies. There is a notable distinction between studies that rely on surveys and those that use census data or a combination of sources. Most studies employed a mix of census data and secondary sources. The depth provided by household-level surveys seems underutilized, with only 5 studies focusing on the household level and 4 utilizing surveys exclusively. Surveys are valuable for obtaining detailed, context-specific information that complements quantitative data, underscoring a significant gap in capturing comprehensive individual and household level insights.
Figure 4. Spatial resolution of analysis units and corresponding data sources used across studies.
Download figure:
Standard image High-resolution image 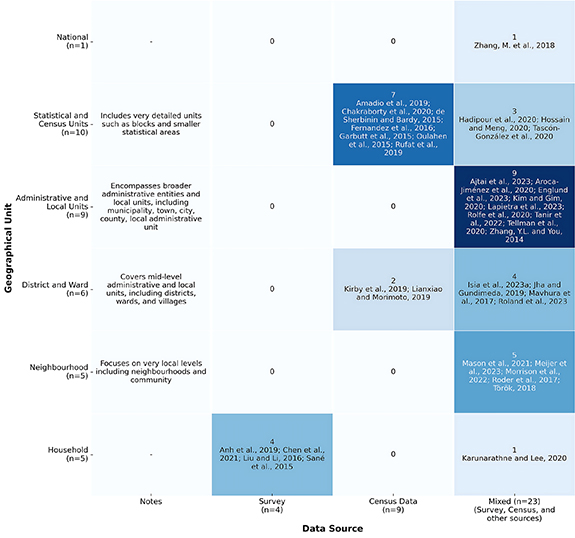
3.2.4. Thematic domains and indicators
We identified 78 indicators from the articles, covering 22 thematic domains (see table 4). There is uneven attention to domains and indicators, with some areas more often studied than others. A breakdown of indicators within each domain is provided in supplementary material C, table C1.
Table 4. Classification of all domains by descending proportion.
Domainsn% Domains in >60% of studies
At risk population36100% Micro level socioeconomic2467% Housing2569% Employment and occupation2467% Education2364% Household composition2261% Density and population dynamics2261%
Domains in 30%–60% of studies
Transportation2056% Race or ethnicity and migration1953% Healthcare infrastructure and accessibility2053% Literacy and language1850% Macro level socioeconomic1336% Flood exposure and impacts1336% Essential community services1336%
Domains in <30% of studies
Urban-rural dynamics and land cover925% Disaster preparedness719% Social connectedness719% Community social and welfare services617% Educational facilities411% Health condition and behavior26% Crime13% Marital age13%
Note: see table C1 in supplementary material C for detailed list of indicators and their variables.
The domain of at-risk populations was addressed in all studies (n = 36) and received most attention, reflecting a consensus on the importance of vulnerable groups such as children, the elderly, and people with disabilities or special needs. Indicators related to the elderly, children, and females were most often included, appearing in 75% (n = 27) of the studies. Indicators regarding housing were included in 69% (n = 25) of studies through variables related to housing tenure, size, quality, stability, and facilities. Indicators related to socioeconomic status and employment and occupation were included in 67% (n = 24) of studies. Indicators of socioeconomic status such as income and economic status, poverty, welfare benefits, and assets are a key for understanding individual and household vulnerabilities. This differs from macro-level markers of socioeconomic status were addressed in 36% (n = 13) of studies through indicators of e.g. community living standards and economic status, gross domestic product, and regional budget and investments.
Transportation was addressed in 56% (n = 20) of studies, with a focus on vehicle ownership and usage, accessibility, connectivity, and transportation infrastructure, due to their role in evacuation and access to resources during floods. For instance, vehicle ownership affects the ability of individuals to evacuate during flood events, while the state of transportation infrastructure affects emergency response and recovery. Healthcare infrastructure and accessibility were addressed in 56% (n = 20) of studies with indicators related to healthcare facilities, public health, accessibility, distance to healthcare, workforce, health insurance, and expenditure. These support immediate medical needs and long-term health care, as proximity to healthcare facilities impacts the speed and quality of medical responses during a flood emergency. Race, ethnicity and migration were covered in 53% (n = 19) of studies. Marginalized racial or ethnic groups often have limited access to resources and may live in more flood-prone areas which increases their vulnerability. For example, immigrant populations may face language barriers and have limited access to social networks, which impedes their ability to respond to flood warnings and recovery efforts. Literacy and language were addressed in 50% (n = 18) of studies, using indicators of literacy rates and language barriers that can affect communication and access to information during flood events. Macro-level socioeconomic indicators, such as community living standards, GDP, and budget and investments were included in 36% (n = 13) of studies to help understand how economic resilience at the community or regional level influences recovery post-flood: regions with higher GDP and stronger economy are better equipped to invest in flood defenses and recovery.
Marital age (3%) and crime (3%) were each addressed by only one study through indicators related to the age at which women get married and local crime rates. Health status and behavior (6%) was another omitted domain, with only 2 studies directly addressing health behaviors (e.g. high alcohol consumption) and pre-existing mental health conditions (e.g. psychological distress, anxiety, depression, recent mental health service use, or medication for mental illness) or physical health conditions (e.g. heart disease, respiratory conditions, or pregnancy). Indicators on educational facilities (11%) such as the presence and condition of schools and educational infrastructure were included in just four studies although they are important for assessing the impact of floods on educational outcomes and community resilience. Community social and welfare services (17%), social connectedness (19%), and disaster preparedness (19%) were also infrequently addressed although they are vital for understanding the broader social dynamics that influence vulnerability and resilience. Social connectedness and networks provide support during emergencies, while isolation can exacerbate vulnerability. Similarly, understanding community disaster preparedness such as access to hazard information and training, community preparedness and response, evacuation plans, and emergency services is critical for reducing flood impacts and improve resilience [72–75].
A closer look at the temporal distribution of 78 social vulnerability indicators across 36 reviewed studies (see figure 5) suggests a gradual diversification in both the number and diversity of indicators used over time, particularly from 2018 onward. In the earlier years (2014–2016), the literature predominantly relied on a narrower subset of demographic and socioeconomic indicators. Over the decade, there is a modest but notable shift toward multi-dimensional approaches that recognize the intersectional and systemic nature of vulnerability. Frequently utilized indicators throughout the period include ‘Female,’ ‘Dependent Persons,’ ‘Employment,’ ‘Education,’ ‘Household Size,’ ‘Income and Economic Status,’ ‘Housing Tenure,’ ‘Elderly,’ and ‘Children.’
Figure 5. Year-wise distribution of indicators across studies.
Download figure:
Standard image High-resolution image 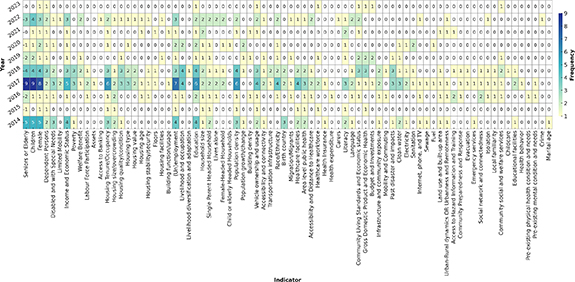
Beginning around 2019, we observe a more visible—though still limited—uptick in the inclusion of structural and institutional indicators, some of which were rarely or not previously used. Indicators such as ‘Transportation Infrastructure,’ ‘Community Preparedness and Response,’ ‘Social Networks and Connectedness,’ ‘Educational Facilities,’ ‘Poverty,’ and ‘Labor Force Participation’ begin to appear more frequently. Similarly, indicators like ‘Healthcare Facilities,’ ‘Area Level Public Health,’ ‘Accessibility and Distance to Healthcare,’ ‘Internet, Phone, and Television,’ ‘Isolation,’ ‘Lives Alone,’ and ‘Housing Size/Overcrowding’ were present in earlier years but appear more consistently after 2019. These developments indicate a conceptual broadening in the field, expanding beyond demographic and household-level variables to include access to services, institutional support, and community infrastructure as critical dimensions of flood vulnerability. The year 2020 does show the highest number of unique indicators (64), yet this is distributed across a relatively small number of studies. Thus, while these shifts are noteworthy, they should be interpreted cautiously given the limited sample size and incremental year-to-year differences. Moreover, several potentially important indicators—such as ‘Carers,’ ‘Child or Elderly Headed Households,’ ‘Marital Age,’ ‘Local Familiarity,’ and ‘Educational Facilities’—remain underutilized.
To deepen our understanding of how social vulnerability indicators are conceptualized and operationalized in the literature, we conducted a combined analysis of Jaccard co-occurrence and Pearson correlation patterns for 78 indicators across 36 flood vulnerability studies. The Jaccard similarity analysis highlights how often pair of indicators are used together in the same studies. Focusing on the 35 indicators appearing in at least six studies—ensuring that the visualization focuses on repeatedly operationalized and thematically relevant indicators in empirical research—the co-occurrence heatmap (see figure 6) revealed several clustered themes. Each cell in the matrix captures the proportion of joint occurrences between two indicators relative to their individual appearance. Scores range from 0 (no co-occurrence) to 1 (perfect co-occurrence), providing a standardized and interpretable measure of conceptual overlap. A particularly strong cluster was demographic dependency, where Children, Seniors or Elderly, and Female consistently co-occurred, (Jaccard = 0.64–0.80), suggesting these groups are commonly framed as socially dependent or at-risk populations. This cluster extended to include Female-Headed Households, Single Parent Headed Households, and Dependent Persons, underscoring the emphasis on caregiving roles and household vulnerability. Other high-similarity grouping was education and employment: (un)employment–education (0.64), (un)employment–income and economic status (0.62), education–female (0.67), and education–income and economic status (0.50), reflecting the consistent framing of socioeconomic vulnerability as a compound of human capital and financial precarity. Several less frequently used but still conceptually important indicators, such as language, lives alone, and community living standards, appeared in multiple moderate-to-high co-occurrence pairs, often connected to themes of social isolation, marginalization, and access to information or support. While an example of less tightly clustered indicators healthcare facilities, area-level public health, and accessibility and distance to healthcare. At the opposite end, several indicators exhibited no or minimal co-occurrence with others: they were treated independently, used in context-specific studies, or under-integrated in broader vulnerability frameworks. In contrast, indicators that appeared in fewer than six studies—such as social network and connectedness, access to hazard information and training, and internet, phone, and TV—still tended to co-occur where used, emphasizing the importance of communication infrastructure and relational ties in shaping preparedness and adaptive capacity. A full list of all 78 indicators and their frequency of appearance is available in supplementary material C, table C1.
Figure 6. Jaccard co-occurrence heatmap (top 35 indicators mentioned in ⩾6 studies).
Download figure:
Standard image High-resolution image 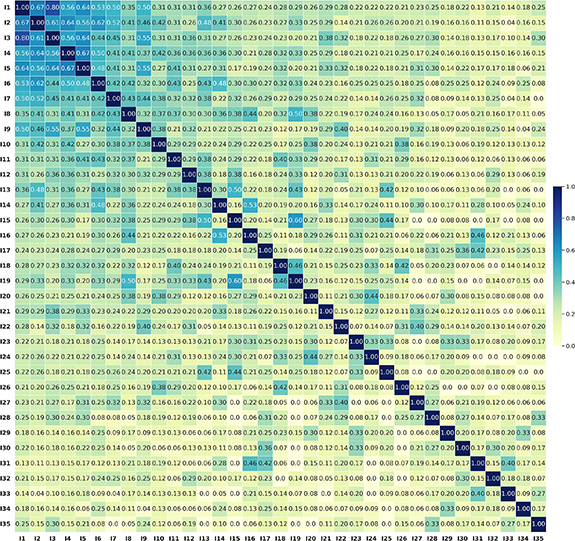
The correlation analysis (see figure 7), computed for the same subset of 35 indicators, further supported these groupings, while also revealing strong linear associations that may not always co-occur frequently. For example, language and housing size/overcrowding showed a strong correlation (r = 0.69), suggesting a shared latent dimension of sociolinguistic and housing disadvantage. Likewise, single parent headed household and language (r = 0.59), and Seniors or Elderly and Children (r = 0.56) reflected recurring pairings of demographic and caregiving vulnerability. Strong correlations also appeared among core socioeconomic indicators: Education, (Un)employment, and income and economic status (r = 0.50–0.53), consistent with their frequent conceptual pairing as structural vulnerability dimensions. These correlations may reflect overlapping constructs or shared inclusion criteria within vulnerability frameworks. Some pairs with moderate Jaccard co-occurrence exhibited stronger correlations—indicating that while not always jointly reported, these indicators tend to follow similar empirical patterns. Conversely, some co-occurring indicators had weak correlations, suggesting they are often used together conceptually but applied in diverse combinations across contexts, possibly due to varying contextual interpretations or measurement strategies. Taken together, the Jaccard and correlation analyzes reveal a multi-layered landscape of how vulnerability indicators are operationalized. While co-occurrence sheds light on thematic consistency in the literature, correlation helps identify coherent measurement patterns. These insights on indicators usage offer both a synthesis of past empirical focus and a roadmap for more integrated, multidimensional vulnerability frameworks in future flood risk research.
Figure 7. Pearson correlation heatmap (top 35 indicators mentioned in ⩾6 studies).
Download figure:
Standard image High-resolution image 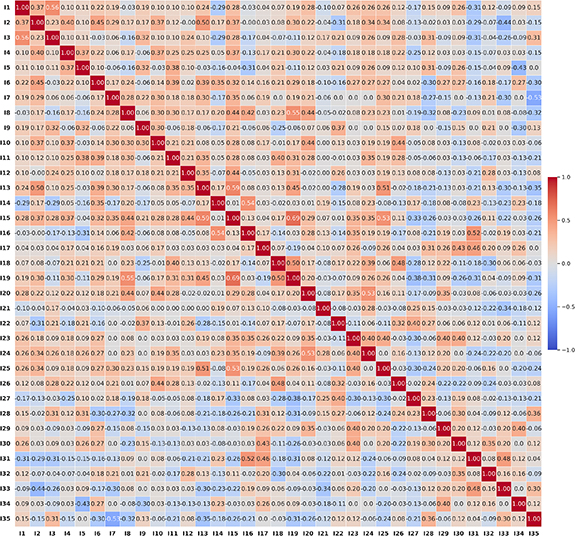
3.2.5. Indicator normalization, weighting, and aggregation
3.2.5.1. Normalization
Min–max normalization was the most common normalization method, employed in 16 studies (table 5). The technique scales data to a fixed range such as from 0 to 1 for easy comparisons. The second most common method was Z-score standardization, applied in 11 studies. It transforms data into a standard normal distribution with a mean of 0 and a standard deviation of 1. It is useful with datasets that have varying units or scales, as it allows for the comparison of data points based on their deviation from the mean. Two further studies employed a combination Z-score and min–max normalization. One study employed binary standard normalization for categorical data by assigning simple Boolean values (0 or 1) based on the presence or absence of a characteristic. Another study used linear fuzzy set membership functions, which assigns degrees of membership based on fuzzy logic principles [62]. They standardized data by transforming raw values into a 0–255 scale, where 0 represents the lowest vulnerability and 255 the highest. Five studies either did not apply any normalization or did not specify the normalization method used. The lack of a clear normalization strategy impacts the reliability and comparability of findings.
Table 5. Normalization methods.
Normalization Methodn% Min–max normalization1644 Z-score standardization1131 Multiple (*Z-*score, min–max)26 Binary standard13 Linear fuzzy set membership functions13 No26 Unspecified38
Total36100
3.2.5.2. Weighting
Statistical methods are the most often used weighing approach, used in 13 studies (table 6). PCA-based weights (PCA) were used in 8 of them. PCA is a statistical technique that reduces data dimensionality while retaining as much variance as possible, thereby helping to identify and weigh key components in vulnerability assessments. The entropy method was used in 3 studies: it quantifies the uncertainty or disorder within a dataset, assigning weights based on the variability and informational content of each indicator. Inverse variance and Variance weighting were used in 1 study each. They assign weights based on the variability of indicators, higher weights given to variables with lower variance or those contributing more to overall variability.
Table 6. Weighting methods.
CategoryWeighting methodDescriptionStudy example Statistically basedPCA-based weights (n = 8)Reduces data dimensionality by identifying components that drive variation. Weights are derived from these components based on their explained variance, with higher variance components receiving greater weight due to their larger contribution to overall variability[24] Inverse variance weights (n = 1)Weights are inversely proportional to indicator variance—higher variance indicators get lower weights, preventing any one indicator from dominating the overall contribution[76] Variance-weighting (n = 1)Weights are directly based on each indicator’s variance, with higher variance indicators receiving more weight. The goal is to emphasize indicators that contribute more to overall variability[77] Entropy method (n = 3)Weights are based on the variation in indicator values, with higher weights assigned to more unpredictable indicators. This method prioritizes indicators that provide more unique information[78]
Participatory or expert-basedFuzzy logic (n = 1)Uses fuzzy logic to address data uncertainty by applying membership functions and decision rules. Indicators are evaluated with linguistic terms (e.g. high, m