1748-9326/20/11/114068
Abstract
Future sea level (SL) change in the Mediterranean Sea is one of the major climate hazards for populations living in coastal areas. In this study, we analyze projections of relative SL (RSL) rise in the Mediterranean Sea until the end of the 21st century. For the first time, we provide a detailed characterization of regional patterns of future SL change using an ensemble of three multi-decadal SSP5-8.5 scenario simulations with high-resolution fully coupled regional climate system models (RCSMs) of the Med-CORDEX initiative and their driving global climate models (GCMs). At the basin-scale, RCSMs do not significantly modify the GCM-projected RSL changes by 2100, with a mean RSL change of 69 cm (60–93 cm, 17th-83rd percentiles) relative to 1…
1748-9326/20/11/114068
Abstract
Future sea level (SL) change in the Mediterranean Sea is one of the major climate hazards for populations living in coastal areas. In this study, we analyze projections of relative SL (RSL) rise in the Mediterranean Sea until the end of the 21st century. For the first time, we provide a detailed characterization of regional patterns of future SL change using an ensemble of three multi-decadal SSP5-8.5 scenario simulations with high-resolution fully coupled regional climate system models (RCSMs) of the Med-CORDEX initiative and their driving global climate models (GCMs). At the basin-scale, RCSMs do not significantly modify the GCM-projected RSL changes by 2100, with a mean RSL change of 69 cm (60–93 cm, 17th-83rd percentiles) relative to 1995–2014. Among the RSL components, the sterodynamic (primarily driven by the global thermal expansion) and the surface mass balance drive the basin-scale RSL rise, with the latter being the largest source of uncertainty. We find that the RSL rise in the Mediterranean is expected to be 4%–12% lower than the global mean due to differences in the surface mass contribution, and 6%–15% lower than in the nearby Atlantic as a result of dynamic adjustments within the semi-enclosed basin. While dynamic SL drives the mean regional patterns, vertical land motion introduces the greatest local spatial variability along coasts, resulting in a projected local RSL rise by 2100 of −26 cm to +178 cm in GCMs and −39 cm to +170 cm in RCSMs. Furthermore, compared to GCMs, RCSMs incorporate local details that result in greater spatial variability, which is important to consider in risk assessments and adaptation planning.
Export citation and abstractBibTeXRIS
Since 1900, global mean sea level (GMSL) has risen by 1.5 mm·yr−1, accelerating to an average rate of +3.7 mm·yr−1 over the last three decades (Dangendorf et al 2024), largely due to thermal expansion and ice-mass loss (Frederikse et al 2020). However, this rate is projected to increase to 11.2–15 mm·yr−1 by the end of the 21st century under high and very high-emission scenarios (Church et al 2013, Oppenheimer et al 2019, Fox-Kemper et al 2021). The combined contributions of dynamic SL (DSL), global-mean thermosteric expansion (GMTS), surface mass balance (SMB) effects (land to ocean mass transfer) including gravitational, rotational, and deformational (GRD) adjustments, vertical land motion (VLM) including glacial isostatic adjustment (GIA), and atmospheric pressure gradients lead to non-uniform spatial patterns of future SL changes (Fox-Kemper et al 2021), especially at regional scales. Characterizing future SL rise (SLR) and its associated risks (flooding, coastal erosion, salinity intrusion, etc.) is essential for developing adaptation strategies in a highly vulnerable climate change region such as the Mediterranean Sea (Giorgi 2006, Cherif et al 2020, Ali et al 2022), where more than 12.3 million people (Jiménez et al 2024) live in low-elevation coastal zones (⩽10 m above mean SL, Neumann et al 2015).
To date, several studies have analyzed SL variations and trends in the Mediterranean Sea, as well as the relative contributions of its different components during the recent past and present climate (Calafat et al 2010, 2012, Jordà and Gomis 2013, Adloff et al 2018, Mohamed and Skliris et al 2022). However, predicting future SL changes and their associated uncertainties in the Mediterranean is challenging, and the robustness of the projections is not yet fully clear. Although global circulation models (GCMs) used in the Coupled Model Intercomparison Project Phase (CMIP) can reasonably reproduce mean SL at the basin-scale in the Mediterranean (Melet et al 2024), their coarse spatial resolution limits the representation of local dynamics. As a result, the role of these processes in shaping relative SL (RSL, Gregory et al 2019) rise patterns remains largely uncertain. On the other hand, regional climate models (RCMs) have shown good ability to reproduce regional patterns (Parras‐Berrocal et al 2024), but they lack information on the connection to the global ocean (Adloff et al 2018).
Most previous works based on Mediterranean SL projections (see supplementary material table S1) have focused on steric SL changes driven by density variations in the water column (Tsimplis et al 2008, Carillo et al 2012, Gualdi et al 2013a, 2013b, Jordà and Gomis 2013, Adloff et al 2015). Sannino et al (2022) used a tidally forced and high-resolution regional oceanic model to investigate basin-averaged sterodynamic SL (SDSL; Gregory et al 2019) changes, along with the contribution of SMB and GIA under the RCP8.5 emission scenario (Taylor et al 2012). They found that projected SDSL changes fall within the uncertainty range of CMIP5 GCMs assessed by the Intergovernmental Panel on Climate Change (IPCC) in the AR5 report (Church et al 2013). Jabnoun and Harzallah (2024) reconstructed RSL changes from five simulations of a single regional ocean model, projecting a 50–80 cm increase by 2100. Using CMIP6 (Eyring et al 2016) scenario simulations, Melet et al (2024) projected a mean Mediterranean RSL rise of 57 cm (44–79 cm, 17%–83% percentiles) under SSP2-4.5 and 79 cm (64–106 cm) under SSP5-8.5 by 2100, based on a multi-model ensemble of GCMs. Vecchio et al (2024) showed that revised SL projections from VLM measurements in the northern Mediterranean coasts lead to average differences of 8 cm by 2100 with respect to the IPCC results. Only the study by Anav et al (2024) examined the future evolution of RSL in the Mediterranean with three climate projections performed by a high-resolution (10 km) and fully coupled regional climate system model (RCSM) under the CMIP6 scenarios. For 2100, their results are within the uncertainties of the CMIP6 multi-model ensemble. From the aforementioned literature, spatial patterns of projected SLR in the Mediterranean Sea have been analyzed only for individual components, such as steric (Tsimplis et al 2008), dynamic (Anav et al 2024, Jabnoun and Harzallah 2024), and sterodynamic (Sannino et al 2022) contributions. While Melet et al (2024) investigated regional patterns that incorporate the combined effects of all RSL terms along the northern Mediterranean coastline, a comprehensive map covering the entire basin is still lacking.
Therefore, a dedicated study that integrates all RSL components from various sources, combined with high-resolution regional climate multi-model simulations, is needed to improve the understanding of the future SL changes in the Mediterranean Sea. Such a study is also crucial to address the regional spatial patterns and associated uncertainties. Based on these premises, this work aims to:
1.
Assess future RSL rise and its spatial pattern in the Mediterranean Sea using an ensemble of coupled RCMs under very high-emission scenarios by the end of the 21st century.
2.
Quantify the main drivers of Mediterranean RSL rise at the basin to local scale and the main sources of uncertainty.
3.
Investigate the influence of the Atlantic Ocean on the Mediterranean SLR and determine the extent to which dynamical adjustments shape regional SL patterns.
4.
Address the information added by regional climate system models (RCSMs) at the basin and regional scales by comparing them with their driving GCM.
2.1. Description of scenario simulations
In this study, we collect all fully-coupled RCSM simulations driven by CMIP6 GCMs available through the Med-CORDEX initiative (Ruti et al 2016; www.medcordex.eu/) along with their driving GCMs to perform a multi-model analysis. Specifically, we use a total of eight multi-decadal simulations from three RCSM/GCM pairs (CNRM-RCSM6/CNRM-ESM2-1, ENEA-REG2/MPI-ESM1-2-HR, CCLM5-0-9-NEMOMED12-3-6/EC-EARTH3-Veg) representing contributions from three institutes involved in the initiative (table S2). Of the eight simulations, three are historical runs, three are projections based on the SSP5-8.5 scenario, and one each is based on the SSP2-4.5 and SSP1-2.6 scenarios. Projections under moderate and low-emission scenarios are provided in the supplementary material. In addition, a total of twelve simulations driven by CMIP5 GCMs were collected and are presented in the supplementary material. Further details on model parameterization and setup, as well as single-model reference papers, are presented in table S2.
For our analysis, we focus on the variables (monthly outputs) required for the calculation of the sterodynamic term: DSL, mean SL pressure, and global mean thermosteric SL. The RCSMs used in this study were previously used and evaluated in Parras‐Berrocal et al (2024), while the comparisons and performance of the GCMs are detailed in text S1. All RCSM datasets were bilinearly interpolated onto a common 0.11° regular grid (OMED-11i grid, extended over the nearby Atlantic), while the GCM datasets were bilinearly interpolated onto a common regular 1° × 0.5° grid. For comparisons with regional models, the GCM data were also interpolated to the OMED-11i grid and then extrapolated using the nearest-neighbor method to fill gaps, especially in coastal regions.
2.2. Contributions to SL change
Future SL change results from multiple contributing components (see appendix: Terms of SL budget). Here, we follow the methodology used in AR6 (Fox-Kemper et al 2021) to project RSL rise, accounting for contributions from GMTS, ocean DSL, atmospheric pressure gradients, SMB, and VLM.
From the GCM outputs, we calculate the SDSL contribution, which is the change in SL that can be simulated by ocean components of climate models. The SDSL term is defined as the sum of the DSL (including the inverse barometer (IB) correction) and the GMTS, i.e. the total SL changes due to changes in ocean density and circulation (Gregory et al 2019). In contrast, RCSMs only provide regional DSL, which, after applying a correction (text S2), becomes comparable to the GCM-derived DSL. To compute SDSL from RCSMs, we therefore combine the corrected DSL from the regional model with the GMTS obtained from its driving GCM. Further details on the SDSL calculation are provided in text S2.
Contributions from SMB (Greenland and Antarctic ice sheets, glaciers, and land water storage; including GRD effects) and AR6 SDSL estimates, were obtained by combining time-series probability boxes of SL change levels from the FACTS project (https://zenodo.org/records/6382554; Garner et al 2021, Kopp et al 2023) and fingerprints from IPCC AR6 (Fox-Kemper et al 2021). All SL terms projected from 2020–2100 are provided with at least medium confidence relative to the 1995–2014 baseline and for different SSP scenarios (https://sealevel.nasa.gov/ipcc-ar6-sea-level-projection-tool). The AR6 data are provided on a regular 1° × 1° grid, so all contributions were interpolated to a common OMED-11i grid and added offline to the SDSL of the GCMs/RCSMs. Further details about the different SL contributions can be found in the IPCC AR6 report (Fox-Kemper et al 2021).
As previous studies have reported significant discrepancies between AR6 VLM rates and observations along Mediterranean coastlines (Thieblemont et al 2024, Vecchio et al 2024, Anzidei et al 2025), here the VLM contribution (including GIA and other relevant solid Earth processes) is estimated by combining (i) the GIA from Frederikse et al (2019), based on the model of Caron et al (2018) built from an ensemble of 128 000 simulations, and (ii) coastal VLM rates derived from global navigation satellite systems (GNSS) observations (Vecchio et al 2024). At grid points where GNSS-based VLM rates are available, these observations directly replace the GIA values. Following Vecchio et al (2024), we assume that VLM evolves linearly through 2100 at the same current observed rates, which is reasonable on centennial timescales for signals dominated by regional tectonics and GIA. The VLM projection was interpolated onto the OMED-11i grid and referenced to 1995–2014.
In this work we focus on the very high-emission scenario due to: (i) the availability of multi-model regional simulations, and (ii) the fact that management strategies are usually based on the most pessimistic scenario. However, projections from a single-model pair under moderate and low-emission scenarios are presented in figure S3.
3.1. Basin-averaged SL change
The mean Mediterranean RSL rise projected by the SSP5-8.5 scenario and contributions from the different SL terms relative to the reference period (1995–2014) are shown in figure 1. The basin-averaged SLR, simulated by the IPCC CMIP6 ensemble of GCMs, closely follows the GMSL change (figure 1(a)). The three GCMs analyzed in this study fall within the uncertainty of the full IPCC ensemble. Notably, the multi-model ensemble mean (MMEM) of these GCMs closely matches the IPCC best estimate, indicating that our ensemble of opportunity effectively captures the central estimates of the broader IPCC ensemble. Although the RCSMMMEM shows slightly lower values compared to the GCMs, the differences at basin-average scale are not significant (95% confidence level according to Student’s t-test). By 2100, ENEA-REG2 and CCLM5-0-9-NEMOMED12-3-6 simulate a lower SLR than their driving GCMs, while CNRM-RCSM6 projects higher values than its driving model, CNRM-ESM1-2.
Figure 1. Basin-averaged projections of relative sea level (RSL) change in the Mediterranean sea under the SSP5-8.5 scenario (2020–2100) relative to the 1995–2014 baseline, along with individual contributions to sea level change. (a) Contributions from surface mass balance components [glaciers (blue), Antarctic Ice Sheet (orange), Greenland Ice Sheet (green), and land water storage (red) are derived from IPCC AR6] and vertical land motion (VLM, brown). Solid gray and black lines with point markers represent sterodynamic sea level and RSL projections from the IPCC AR6 ensemble for the Mediterranean basin, respectively, while the thin black line indicates global mean sea level rise. Dashed lines show the global climate multi-model ensemble mean, and solid lines show the regional climate multi-model ensemble mean (gray for sterodynamic, black for RSL). Symbols on the right indicate central estimates for 2100, with unfilled symbols representing global models and filled symbols representing regional models. Bars denote the 17th–83rd percentile likely range; with uncertainty in regional projections estimated via quadratic error propagation of surface mass balance uncertainties and VLM. (b) Same as (a) for the components of sterodynamic (gray) sea level change: global mean thermosteric (GMTS, olive), dynamic sea level (DSL, cyan), and inverse barometer (IB, purple).
Download figure:
Standard image High-resolution image 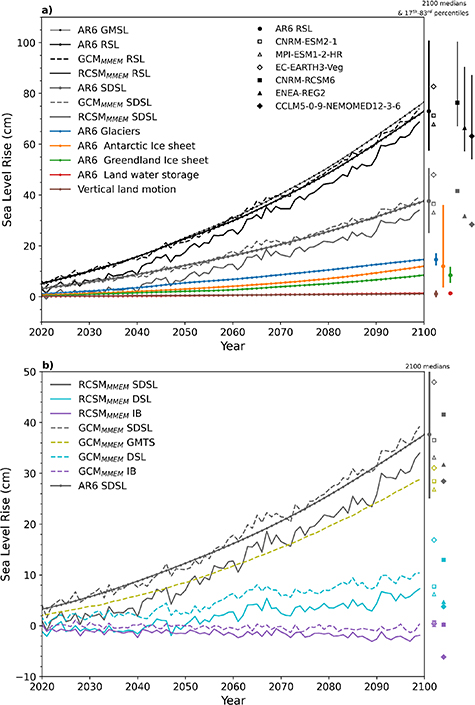
Over the 21st century, the AR6 RSL is projected to rise at a rate of +8.4 mm·yr−1, while the GCMMMEM and RCSMMMEM project very similar rates of +8.5 mm·yr−1 and +8.2 mm·yr−1, respectively, suggesting consistent behavior across the three ensembles at the basin-scale. By 2100, the central estimate (50th percentile) of the AR6 RSL is projected to be 73 cm (57–101 cm, 17th-83rd percentiles) higher than during the 1995–2014 period (figure 1(a)). Among the GCMs, the highest projected SL change comes from EC-EARTH3-Veg (83 cm), while the lowest is from MPI-ESM1-2-HR (68 cm); the GCMMMEM is 74 cm (65–98 cm). For the RCSMs, the maximum RSL rise is projected by CNRM-RCSM6, with a central estimate of 76 cm (67–100 cm), while the minimum is projected by CCLM5-0-9-NEMOMED12-3-6, with 63 cm (54–87 cm); the RCSMMMEM is 69 cm (60–93 cm).
For the period 2080–2099, RSL rise in the Mediterranean is projected to be ∼4% lower than the GMSL rise according to AR6 and GCMMMEM projections, and about 12% lower based on RCSMMMEM. This signal is consistent across most models, with the exception of EC-EARTH3-Veg, which projects a RSL rise 7% higher than the GMSL. In contrast, for the nearby Atlantic (Atlantic box resolved in figure 2), RSL rise is projected to exceed GMSL rise by 2% and 3% according to GCMMMEM and RCSMMMEM (not shown). Consequently, when compared to the nearby Atlantic, the Mediterranean RSL rise is 6% lower in the GCMMMEM and 15% lower in the RCSMMMEM. The difference relative to GMSL rise is due to a lower SMB fingerprint in the Mediterranean than the global mean (Fox-Kemper et al 2021), while the difference with the nearby Atlantic stems from DSL (see section 3.2).
Figure 2. Mean (a)–(d) dynamic sea level change (cm) for 2080–2099 relative to the present climate (1995–2014) under the SSP5-8.5 scenario, as projected by the multi-model ensemble mean and individual RCSMs. The near Atlantic average (ATL) as well as the Mediterranean minus near Atlantic average (MED-ATL) dynamic contribution are indicated. The near Atlantic average is computed from the Atlantic box resolved in figure 2.
Download figure:
Standard image High-resolution image 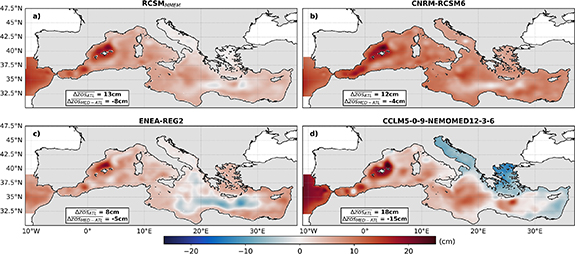
Among all SL components, the SDSL (gray lines) and the SMB (sum of the blue, orange, green, and red lines, central estimate of +36 cm by 2100) are identified as the major contributors to the Mediterranean SLR, each accounting for about 50% of the projected future change. In contrast, at basin-scale, the VLM (brown line) is negligible. The AR6 SDSL is expected to increase at a rate of +4.3 mm·yr−1, with the GCMMMEM and RCSMMMEM projecting similar rates (+4.5 mm·yr−1 and +4.2 mm·yr−1). Analysis of the individual SDSL components (figure 1(b)) identifies that GMTS is the primary driver, contributing +31 cm (EC-EARTH3-Veg), +28 cm (CNRM-ESM2-1), and +27 cm (MPI-ESM-1-2-HR) to the total SDSL change by 2100. The IB effect is generally negligible (table S3), except for CCLM5-0-9-NEMOMED12-3-6, where it contributes −6 cm. The DSL is therefore responsible for the differences between GCMs and RCSMs at the basin-scale, as it represents the SDSL term that shapes regional patterns. By 2100, the projected DSL change is +13 cm/+8 cm for CNRM-RCSM6/CNRM-ESM2-1, +5 cm/+6 cm for ENEA-REG2/MPI-ESM1-2-HR, and +4 cm/+17 cm for CCLM5-0-9-NEMOMED12-3-6/EC-EARTH3-Veg.
Among the contributors to SLR from mass budget changes, glacier mass loss is the largest (47%), followed by the melting of the Antarctic ice sheet (29%), the Greenland ice sheet (20%), and changes in land water storage (4%). Beyond the inherent uncertainties associated with the downscaling model chain and the choice of emission scenarios, the main source of uncertainty found in the Mediterranean SLR projections is related to Antarctic ice mass loss, due to its potential for rapid and non-linear response. This result is consistent with the findings of Melet et al (2024), who found that high-end estimates of SLR in Europe are particularly sensitive to this source of uncertainty.
By 2100, under SSP1-2.6 scenario, RSL projections are 41 cm (28–61 cm) for AR6, 39 cm (29–56 cm) for MPI-ESM-1-2-HR, and 41 cm (32–58 cm) for ENEA-REG2; under SSP2-4.5, projected rises are 53 cm (40–75 cm), 52 cm (42–71 cm), and 50 cm (39–68 cm), respectively, with SMB dominating the SL budget (figure S3).
Under the RCP8.5 scenario (figure S4), relative to the 1986–2005 period, relative SL is projected to rise by 64 cm (46–81 cm, 5th-95th percentiles) according to AR5, 62 cm (59–69 cm) according to GCMMMEM, and 64 cm (49–78 cm) according to RCSMMMEM. Projections for each individual model pair are presented in table S3. Following IPCC AR6 (Fox-Kemper et al 2021), a 3 cm correction should be applied to account for differences in the baselines periods used in the CMIP5 and CMIP6 exercises, enabling consistent comparison between their results. Compared to the SSP5-8.5 scenario, the RCP8.5 projections have a weaker uncertainty range, possibly due to the smaller contribution of the Antarctic ice sheet in AR5 (Church et al 2013).
3.2. Mediterranean dynamic adjustment
The projected changes in mean DSL change at 2080–2099 relative to 1995–2014 are shown in figure 2. By the end of the century, the DSL changes are not robust across models. Regional circulation patterns result in local spatial deviations from the basin-average, with values reaching +16 cm (−9 cm) for CNRM-RCSM6, +18 cm (−14 cm) for ENEA-REG2, and +25 cm (−16 cm) for CCLM5-0-9-NEMOMED12-3-6. The largest deviations are localized in the open-sea. Although model responses within the Mediterranean are diverse, especially for CCLM5-0-9-NEMOMED12-3-6 circulation, a common signal emerges in the Balearic Sea, where DSL increases by up to +16 cm in the RCSMMMEM, consistent with findings of Parras‐Berrocal et al (2024).
The DSL is projected to increase more rapidly in the near Atlantic than in the Mediterranean. Specifically, the Atlantic DSL increases by 8 cm to 18 cm ( , with ENEA-REG2 and CCLM5-0-9-NEMOMED12-3-6 representing the lowest and highest increases, respectively. However, a dynamic adjustment of the Mediterranean Sea, ranging from −15 cm to −4 cm (
 , partially compensates for the Atlantic signal. This adjustment can be caused by steric or mass imbalances between the Mediterranean and the nearby Atlantic. As a result, the DSL difference between the Atlantic and Mediterranean basins becomes larger compared to the reference period, leading to an increased slope of DSL through the Strait of Gibraltar. The dynamic adjustment does not show robust differences between GCMs and RCSMs (figure S5). To better understand the DSL increase projected by RCSMs and GCMs in the near Atlantic, we investigated the role of the Atlantic Meridional Overturning Circulation (AMOC) on DSL using available data from CNRM-ESM2-1 and MPI-ESM1-2-HR. The DSL increase in the near Atlantic regresses significantly (higher than +1.5 cm Sv−1 of AMOC decrease) with a future reduction in AMOC maximum at 30°N by the end of the 21st century (figure S6). This relationship was shown to be a robust response across GCMs in both the CMIP5 and CMIP6 ensembles (Chen et al 2018, Little et al 2019, Pardaens 2023, Jesse et al 2024). Recent observations also show a negative correlation between AMOC and Mediterranean DSL at interannual timescales (Volkov et al 2018). Therefore, we interpret the basin-scale DSL contribution to projected RSL trends as largely AMOC-driven.
3.3. Regional SL change
The regional patterns of SL change in the Mediterranean for the period 2080–2099 under the SSP5-8.5 scenario compared to the 1995–2014 baseline are shown in figure 3. Future global changes in the SMB, driven by the redistribution of mass from land to ocean due to ice loss from glaciers and ice sheets, as well as changes in land water storage, trigger GRD effects through the process known as self-attraction and loading. These GRD effects produce distinct regional SL patterns on a global scale. In the Mediterranean Sea, they result in a meridional gradient with SL changes ranging from +25 cm along the northern coasts to +32 cm along the Libyan coast in the south (figure 3(a)).
Figure 3. Regional projections of mean sea level change components (median estimates) for 2080–2099 relative to 1995–2014 under SSP5-8.5: (a) surface mass balance, (b) vertical land motion, (c) sterodynamic from the regional ensemble mean, and (e) sterodynamic from the global ensemble mean. Multi-model ensemble mean anomaly of mean relative sea level (cm) for 2080–2099 relative to 1995–2014 is shown for (d) regional models and (f) global models. Note that the non-linear colorbars are used in (b), (d), (f) to highlight spatial variability.
Download figure:
Standard image High-resolution image 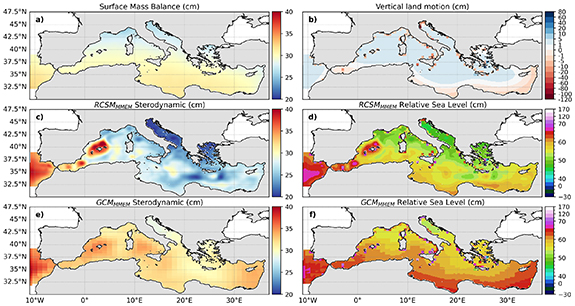
At the basin-scale, the VLM contribution to RSL change is small, but locally it can have a significant impact (figure 3(b)). The coastal subsidence and uplift driven by tectonics, sediment compaction, or anthropogenic effects, among others, can modify the RSL in the range of +115 cm (northern Adriatic) to −83 cm (southern Aegean Sea). The GNSS-based VLM rates from Vecchio et al (2024) also identify additional hotspots of pronounced subsidence, not accounted for in GIA simulations, such as the Po Delta, the Aeolian Islands, and eastern Sicily (Italy), as well as the Nile Delta (Egypt), thereby increasing the vulnerability of these coastal areas (figure S7).
The SDSL shows a different magnitude between the RCSMMMEM and the GCMMMEM. In the near Atlantic, the patterns are similar, but they are significantly different in the Mediterranean (figures 3(c) and (e)). The coarse representation of regional circulation and mesoscale structures by the GCMs (figure S1) leads to differences of up to +8 cm in the northern Balearic and Alboran Seas and −11 cm in the southern Adriatic, Bonifacio Gyre, and Cretan Passage. To the best of our knowledge, these are the first maps of the entire Mediterranean RSL rise obtained by combining all SL components with a set of GCMs and RCSMs (figures 3(d) and (f)). Under the SSP5-8.5 scenario, by the end of the century, the RCSMMMEM projects a RSL rise ranging from −29 cm to +162 cm, while the GCMMMEM projects changes ranging from −23 cm to +170 cm. The largest RSL rise is projected along the northern Adriatic coast, while the smallest occurs at small islands in the southern Aegean, both primarily driven by VLM contributions. For RCP8.5 projections the spatial variability ranges from −35 to +177 cm RCSMMMEM and from −35 to +179 cm in GCMMMEM with respect to 1995–2014 baseline (not shown).
The future RSL change simulated by each pair of models shows highly variable behaviors (figure S8), driven by DSL as previously shown in figure 2. Even at the local coastal scale (figure S7), the differences between RCSMs and GCMs pairs are highly variable. However, using normalized probability density functions of the RSL change for the period 2090–2099 in the Mediterranean basin (figure S9), we find that RCSMs show a higher spatial spread of the RSL response than GCMs, which is consistent with the larger spatial variations in RSL changes (compare figure 3(d) with figure 3(f)).
Projected RSL rise along the Mediterranean coast and major islands shows basin-wide increases of ∼15–30 cm by 2050 and ∼60–90 cm by 2100 under SSP5-8.5, relative to 1995–2014 (figure 4). Regional and global ensemble means are broadly consistent, although the GCMMMEM projects higher values than the RCSMMMEM. Localized amplification near subsiding regions such as Venice, Milazzo (Sicily) and Alexandria underscores the uneven coastal exposure to future SLR. Variability is stronger along northern coasts, where dense VLM observations capture uplift and subsidence, whereas southern coasts and Cyprus are mostly constrained by GIA-only contributions. The observed peaks are primarily driven by VLM rather than oceanographic processes, with subsidence amplifying relative rise and uplift dampening it.
Figure 4. Relative sea-level rise (cm) along the accumulated distance (km) of the (a) Mediterranean coast from Algeciras (Spain) to Tangier (Morocco), and (b) major islands (Mallorca, Sardinia, Corsica, Sicily, Crete, and Cyprus). Solid lines (regional multi-model ensemble mean) and dashed lines (global multi-model ensemble mean) show projected median changes by 2050 (blue) and 2100 (red) under the SSP5-8.5 scenario, relative to 1995–2014. Shaded areas indicate the 17th–83rd percentile uncertainty range. Vertical markers denote major coastal cities, and in (a) the top bar shows coastlines of United Nations member and permanent observer states.
Download figure:
Standard image High-resolution image 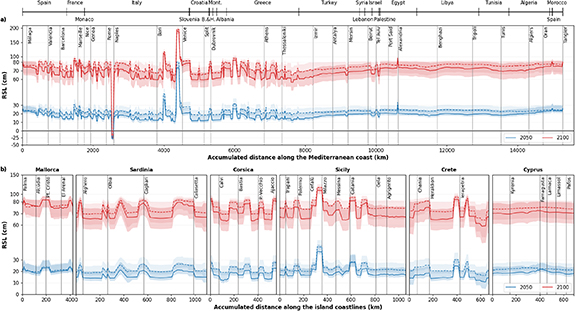
For the first time, we analyze regional patterns of future RSL change in the Mediterranean under different emission scenarios by combining the latest SL component datasets, which are not reproduced by ocean models, with a set of high-resolution (6–15 km) and fully coupled RCSMs. Alongside these regional simulations, we examine future RSL in the Mediterranean using GCMs, which drive the RCSMs. This integrated, multi-model approach represents a significant advancement over previous studies, which have either focused solely on the multi-model evolution of the steric component (Gualdi et al 2013a); relied on single-model regional simulations for specific contributors or RSL at the basin-scale (Sannino et al 2022, Anav et al 2024, Jabnoun and Harzallah 2024); or used global ensemble mean projections (Melet et al 2024). Using a set of nine RCSMs (CMIP5 and CMIP6 simulations), we provide: (i) more accurate results since RCSMs better reproduce regional circulation and exchanges at the Strait of Gibraltar than GCMs, and (ii) a more reliable characterization of future SL rise since we evaluate different model and scenario responses.
By 2100, the ensemble mean of the GCMs and RCSMs analyzed in this study simulates a RSL rise in the Mediterranean that closely resembles the CMIP6 ensemble simulation. At the basin-scale, the central estimates of the GCMs (50th percentile) project a RSL increase ranging from 68 to 83 cm, while RCSMs range from 63 to 76 cm. From CMIP5 simulations, total SL is projected to rise by 62–72 cm from GCMs and 61–71 cm from RCSMs, with respect to the 1995–2014 period. Out of the nine model-pairs (considering CMIP5 and CMIP6 simulations), four RCSMs project a greater increase than their driving GCMs, while the remaining five project a smaller increase. Therefore, based on the whole ensemble, we find that RCSMs do not fully modify the GCM signal at the basin-scale. The sterodynamic term and SMB are identified as the major contributors to future basin-scale RSL change, each accounting for approximately 50% of the total increase. In contrast, under low and moderate-emission scenarios, the ENEA-REG2(MPI-ESM-1-2-HR) model projects a substantially lower RSL rise (41 cm (39 cm) for SSP1-2.6 and 50 cm (52 cm) for SSP2-4.5); while the reduced contribution of thermal expansion to the sterodynamic term means that sea-level rise becomes dominated by the mass component. The largest source of uncertainty is associated with Antarctic ice mass loss, highlighting the potential for rapid, non-linear changes in future SL projections.
Mediterranean RSL is expected to be 4%–12% lower than the global mean due to differences in the surface mass contribution, and 6%–15% lower than in the nearby Atlantic as a result of dynamic adjustments within the semi-enclosed basin.
Under the SSP5-8.5 scenario, RSL rise shows strong spatial variability, ranging from −26 to +178 cm in GCMs and −39 to +170 cm in RCSMs. VLM has been identified as the primary driver of this variability, leading to localized SL adjustments, particularly along the coasts of the southern Aegean Islands and the northern Adriatic Sea. At the regional scale, DSL shapes the future sterodynamic SL change patterns, especially in open-sea regions. This circulation-driven component accounts for the differences observed between GCMs and RCSMs in the Mediterranean Sea, as other SL contributors are derived from the global ocean and added offline. RCSMs introduce greater spatial variability and capture more local extrema compared to GCMs. Although GCMs provide a robust estimate of basin-wide average SL, RCSMs reveal local deviations of about ±15 cm due to DSL effects; variations that are important to consider when assessing future extreme SL scenarios. Thus, future studies should adopt this regional multi-model approach to analyze extreme water levels by adding high-frequency processes (tides, waves, and storm surges) to more accurately assess coastal risks and vulnerability in the Mediterranean Sea by the end of the century.
This study has received funding from Agence Nationale de la Recherche under Grant Nos. ANR-21-CE02-0017 (PopNCo) and ANR-22-POCE-0003 (MEDIATION). This work is part of the Med-CORDEX (www.medcordex.eu) initiative. We thank AWI/GERICS, CMCC, CNRM, ENEA, GUF and LMD for providing model data.
Regional model outputs used in this study are or will be freely available in the Med-CORDEX database (www.medcordex.eu/), while global model outputs are available at https://esgf-node.ipsl.upmc.fr/projects/esgf-ipsl/. Sea level projections from IPCC AR6 are available at https://zenodo.org/records/6382554 and from AR5 at www.cen.uni-hamburg.de/en/icdc/data/ocean/ar5-slr.html. The results from the GIA model are available at https://doi.org/10.5194/se-2018-128, whereas the vertical land motion rates on the geographical grid at www.savemedcoasts2.eu/index.php/en/results. The altimetric satellite observations (https://doi.org/10.48670/moi-00141) and the reanalysis data (Escudier et al 2021) are publicly available at the Copernicus Marine Environment Monitoring Service (https://marine.copernicus.eu/).
Supplementary data 1 available at https://doi.org/10.1088/1748-9326/ae15a5/data1.
| AR5 | Fifth Assessment Report of the IPCC |
| AR6 | Sixth Assessment Report of the IPCC |
| CMIP5 | Coupled Model Intercomparison Project Phase 5 |
| CMIP6 | Coupled Model Intercomparison Project Phase 6 |
| DSL | Dynamic sea level |
| GCM | Global circulation model |
| GIA | Glacial isostatic adjustment |
| GMSL | Global-mean sea level |
| GMTS | Global-mean thermosteric expansion |
| GRD | Gravitational, rotational and deformational |
| IB | Inverse barometer |
| IPCC | Intergovernmental Panel on Climate Change |
| MMEM | Multi-model ensemble mean |
| RCM | Regional climate model |
| RCSM | Regional Climate System Model |
| RCP | Representative concentration pathways |
| RSL | Relative sea level |
| SDSL | Sterodynamic sea level |
| SMB | Surface mass balance |
| SL | Sea level |
| SLR | Sea level rise |
| SSP | Shared socioeconomic pathways |
| VLM | Vertical land motion |
| Terms of sea level budget | Acronym | Name | Formula (see also Gregory et al 2019) |
|---|---|---|---|
| SDSL | Sterodynamic sea level | SDSL = GMTS + (DSL + IB) | |
| SMB | Surface mass balance | SMB = Greenland Ice Sheet + Antarctic Ice Sheet + Glaciers + Land Water Storage + GRD | |
| VLM | Vertical land motion | VLM = GIA + other relevant solid Earth processes (e.g. tectonics, sediments compaction, etc.) | |
| RSL | Relative sea level | RSL = SDSL + SBM + VLM |