1748-9326/20/11/114078
Abstract
Significantly reducing greenhouse gas (GHG) emissions from agricultural production is crucial to limiting climate change. Fertilized soils are a major source of nitrous oxide (N2O), a potent GHG. Reducing N2O emissions is a key interest for many countries, including Denmark, where approximately 90% of N2O emissions originate from agricultural soils. Although the link between nitrogen (N) fertilization and N2O emissions is well-known, quantitative evidence for the efficiency of mitigation options in the relevant local context is scarce. This is often due to high flux variation over time scales ranging from hours to a few days. Previous studies have mostly neglected to perform measurements that could to account for this variation. Furthermore,…
1748-9326/20/11/114078
Abstract
Significantly reducing greenhouse gas (GHG) emissions from agricultural production is crucial to limiting climate change. Fertilized soils are a major source of nitrous oxide (N2O), a potent GHG. Reducing N2O emissions is a key interest for many countries, including Denmark, where approximately 90% of N2O emissions originate from agricultural soils. Although the link between nitrogen (N) fertilization and N2O emissions is well-known, quantitative evidence for the efficiency of mitigation options in the relevant local context is scarce. This is often due to high flux variation over time scales ranging from hours to a few days. Previous studies have mostly neglected to perform measurements that could to account for this variation. Furthermore, reducing N2O fluxes can result in increased losses through ammonia (NH3) volatilization and N leaching, as well as reduced yields. Thus, establishing tangible mitigation strategies requires a holistic understanding of N2O fluxes in the context of the annual, field-scale N balance, translation of findings into modeling approaches, use of models to identify emission hotspots, and scaling interventions from the field to regional and national levels. Here, we introduce the SmartField initiative, which aims to reduce national N2O emissions in Denmark by 20%–30% by 2030 by testing and providing verified, field-tested mitigation options. The initiative includes accurate and transparent N2O emissions accounting at the field, farm, and national levels and a setup to test management technologies for N2O emissions. It also involves developing a monitoring, reporting, and verification system for N2O emissions based on a Tier 3 methodology. Furthermore, SmartField collaborates closely with farmers, value chain actors, and policy makers to identify synergies and trade-offs between reducing GHG emissions and their effects on the environment, food production, and farm profitability.
Export citation and abstractBibTeXRIS
The human perturbation of the nitrogen (N) cycle, mainly driven by using N fertilisers to increase food production, has led to dramatically increased losses of reactive N compounds to the environment (Erisman et al 2013). Minimizing environmental N losses from agriculture is crucial for protecting the climate, biodiversity, and air and water quality (Galloway et al 2008). Agriculture is the main source of anthropogenic nitrous oxide (N2O) emissions, largely due to the use of N fertilisers (Cui et al 2021). Significant reductions of N2O emissions from agricultural systems are required to achieve the 1.5 °C and 2 °C climate change targets of the Paris Agreement (Clark et al 2020). Other N losses, which indirectly contribute to N2O emissions, must also be significantly reduced to maintain environmental integrity (Schulte-Uebbing et al 2022). This must be done without compromising crop production or causing pollution swapping (Smerald et al 2023a, 2023b).
However, N2O emissions from agricultural soils vary greatly over time and space. Several studies have shown that short-lived pulse emissions, which last a few days and are triggered by events such as heavy rainfall or spring thaw, can dominate annual N2O emissions (e.g. Abalos et al 2016, Wagner-Riddle et al 2020, Song et al 2021). Accurately quantifying these pulses requires continuous sub-daily measurements of fluxes, as well as simultaneous observations of soil environmental conditions, microbial activity, and crop performance (Anthony and Silver 2024). An additional challenge is the high spatial variability of N2O fluxes. Hotspots of N2O production and emission may be formed due to the uneven distribution and accumulation of residues, inorganic or organic nitrogen fertilizer, or animal urine. Indeed, N2O fluxes can vary significantly in otherwise homogeneous agricultural fields within a one-meter spatial scale (Kravchenko et al 2017). Additionally, differences in land use and management significantly impact soil environmental conditions and, consequently, soil N2O emissions (Groffman et al 2009). Thus, a large number of measuring plots may be needed to determine the significance of a potential mitigation measure (Wangari et al 2022).
The most important challenge is contextualizing N2O fluxes within the broader scope of N fluxes. According to the IPCC (Hergoualc’h et al 2019), the contribution of N2O fluxes to the total N balance of a field is approximately 1% of the applied fertilizer on a global scale. Most countries use this estimate for reporting N2O emissions from fertilized land (Tier 1 accounting methodology). However, accurate accounting of emissions presents a significant modeling challenge because other critical components of the N balance must be considered as well, such as plant N uptake, changes in soil N stock, microbial immobilization, and N losses in various forms through hydrological and gaseous pathways (Butterbach-Bahl et al 2013). These pathways include NH3 volatilization, nitrate (NO3–) leaching, N2O and nitric oxide (NO) fluxes, as well as the deposition of NO and NH3 to agroecosystems. Quantifying dinitrogen (N2) fluxes is the most challenging aspect, whether due to N fixation by legumes or free-living microorganisms fixing atmospheric N2, or as a major loss pathway, as N2 is the main end product of the microbial process of denitrification (Groffman et al 2006). Ultimately, understanding N processes, the N balance of agroecosystems, and identifying mitigation options will be impossible without also understanding and quantifying carbon (C) fluxes and the C balance because C and N biogeochemistry are closely coupled (Gruber and Galloway 2008).
Thus, it is urgent to understand and predict small N2O fluxes in the context of other major N (and (C)) fluxes, and without compromising yields or risking pollution swapping. All of these fluxes are affected not only by climate but as well by soil and crop properties, management, and landscape features, such as topography as it affects lateral water fluxes, erosion, and N deposition. However, in order to incorporate reductions in agricultural nitrous oxide (N2O) emissions into greenhouse gas (GHG) emissions trading and national GHG mitigation plans in Denmark and elsewhere, verifiable reductions in N2O emissions from agricultural fields are needed by 2030 and beyond without unduly affecting crop yield or shifting N pollution to other sources (Searchinger and Waite 2024). To address this challenge, we developed and implemented the SmartField concept.
SmartField establishes an innovative, field-scale platform for testing and validating solutions that mitigate N2O emissions from agricultural fields in Denmark. The country aims to reduce GHG emissions by 70% from 1990 levels by 2030 and to achieve net-zero GHG emissions by 2050. This includes reducing N2O emissions, as 89% of Denmark’s total N2O emissions originate from agriculture (Danish Emission Inventories for Agriculture, Albrektsen et al 2021). To develop N2O mitigation strategies, we will assess N2O fluxes in the context of the total N (and C) balance. SmartField also provides the necessary quantitative modeling tools for scaling, designing, and targeting incentives to be incorporated into frameworks supported through food value chains and through national regulations. These frameworks can incentivize the adoption of knowledge and solutions by farmers and ensure these measures are accurately reflected in national inventories.
SmartField is based on three major task groups: (a) a robust measurement component closely linked to (b) modeling that serve (c) a science–policy–practice (SPPI) that develops accurate farm to national accounting that integrates effective incentives to reduce emissions.
SmartField aims to provide benchmark datasets to:
(a) Assess the effectiveness and environmental benefits of N2O mitigation options in field trials, considering the N balance as well as the magnitude of N2O and other significant environmental N losses while evaluating yield effects.
(b) Allow for the thorough testing and further development of comprehensive ecosystem models such as DayCent (Parton et al 1998), LandscapeDNDC (Haas et al 2013) and Daisy (Abrahamsen and Hansen 2000) that are used to predict N2O emissions from agricultural soils.
Since these models simulate all major N and C processes and fluxes, the datasets must provide as many measured variables as possible for validation. Specifically, the datasets must provide information on the N balance, crop N uptake, and crop development; environmental N losses by leaching (NO3−, dissolved organic N [DON] and ammonium (NH4+) ions; gaseous emissions by NH3 volatilization; and N2O and NO fluxes. Regarding the C balance, the datasets must provide information on crop biomass growth, net ecosystem exchange, and leaching of dissolved organic carbon and, if possible, dissolved inorganic carbon. Additionally, detailed information on all field management activities (e.g. fertilization, tillage, and irrigation) must be recorded. Auxiliary, continuous measurements of environmental parameters (e.g. temperature and soil moisture at different depths) are necessary to drive and constrain the models.
The concept of establishing measurement benchmark datasets is implemented at two spatial scales at two sites in Jutland, Denmark (referred to as Supersites hereafter):
(a) At the plot scale, N2O is measured with automatic chambers at a sub-daily resolution of approximately four to six fluxes per day and plot to test and compare eight different treatments with four replicates. These treatments represent current land management practices and the most effective mitigation options available.
(b) At three larger fields, each approximately one to two hectares in size, N2O is measured using the flux gradient method (Wagner-Riddle et al 2007). These fields repeat some of the plot treatments to eliminate small scale spatial variations. Footprint analyses of the measurements will be used to understand the spatial heterogeneity of N2O emissions.
(c) The Supersites will enable exploration of remotely and proximal sensing indicators of plants and soils that may serve as direct or indirect proxies for N2O and environmental N losses. These indicators include the field-scale dynamics of soil moisture as measured by cosmic rays (Fersch et al 2020), gross photosynthesis as an indicator of plant N uptake as measured by solar-induced fluorescence sensors (Mohammed et al 2019), and field-scale dynamics of N2O isotopomer signals to discern N2O source processes (Denk et al 2019). In addition, DUALEM measurements and drone overflights monitor soil physical and plant growth parameters.
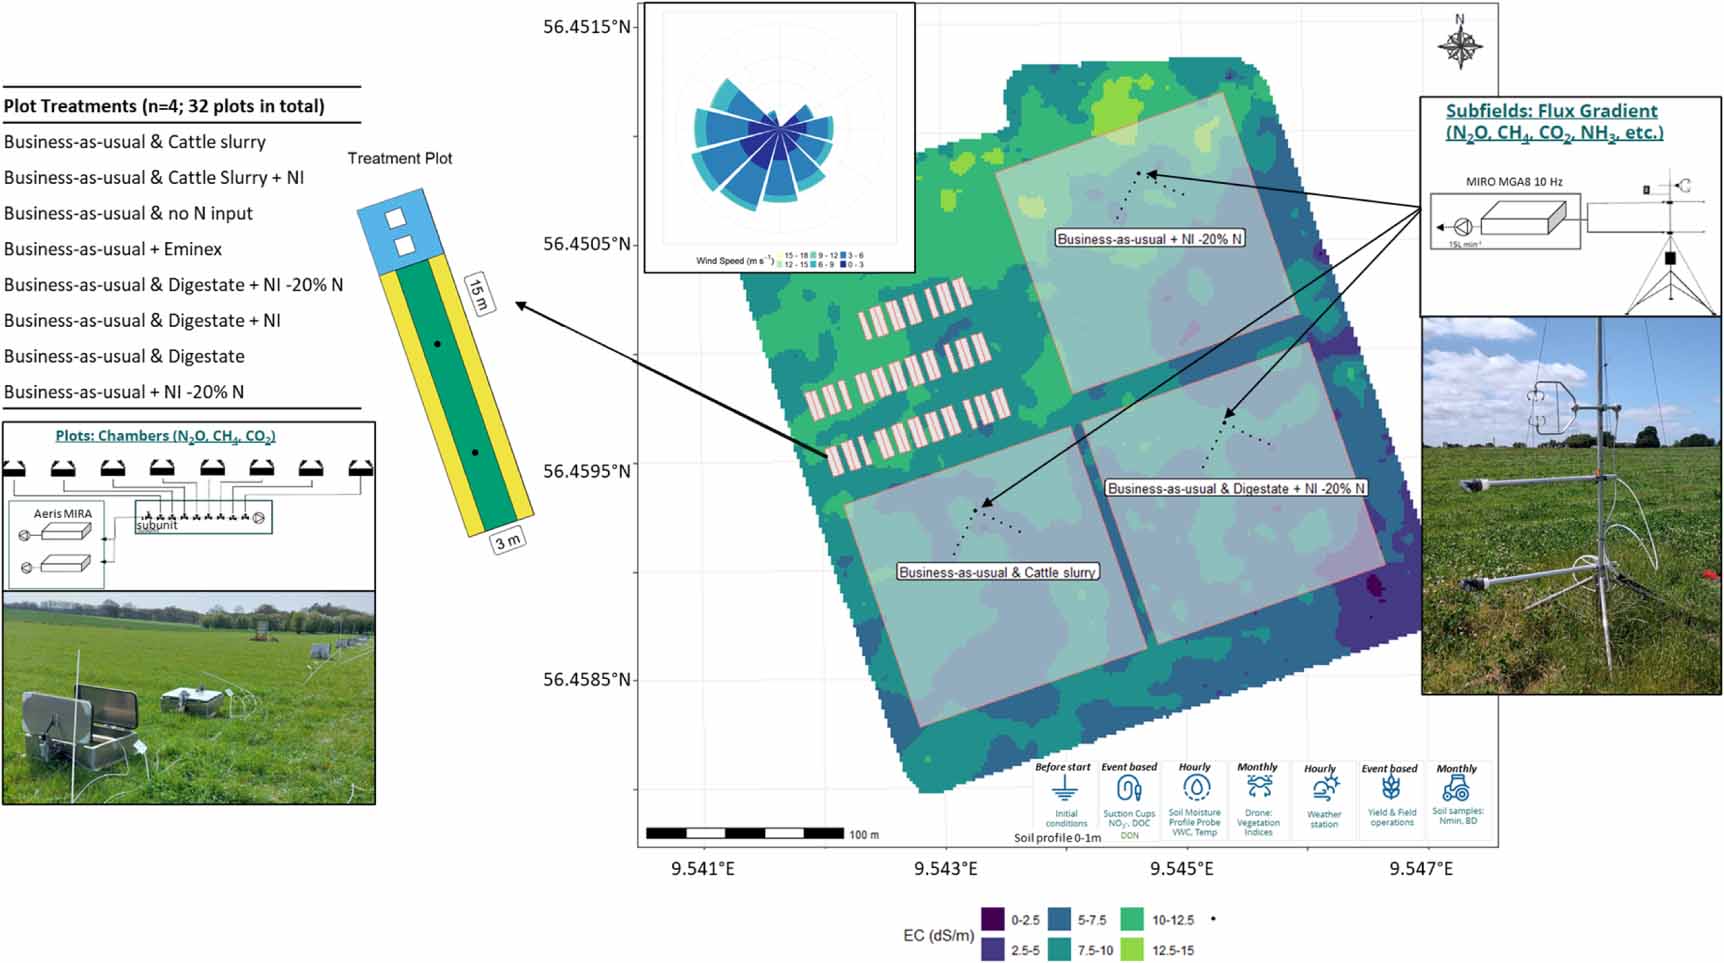
Figure 1 illustrates the measurement concept at one of the two SmartField supersites. The figure also provides an overview of the initial results of a soil survey conducted before N (and C) flux and balance measurements were established.
Figure 1. Outline of the SmartField Supersite ‘Foulum’ showing the field site, instrumentation, and treatments. A survey of soil electric conductivity indicates differences in soil properties. The yellow, green, and blue colors on the treatment plot refer to the following: yellow: boundary areas not used for measurements. Green: area for yield measurements. Blue: area for chamber GHG flux measurements. The two points within the green area indicate the locations where soil water NO3– concentration measurements are taken with suction cups. NI: nitrification inhibitor, Eminex: suppresses methane and CO2 emissions from slurry (www.alzchem.com/en/brands/eminex/). Note: SmartField sites are established on arable land. The picture shows the fields in spring of 2025, when they are covered with crops.
Download figure:
Standard image High-resolution image 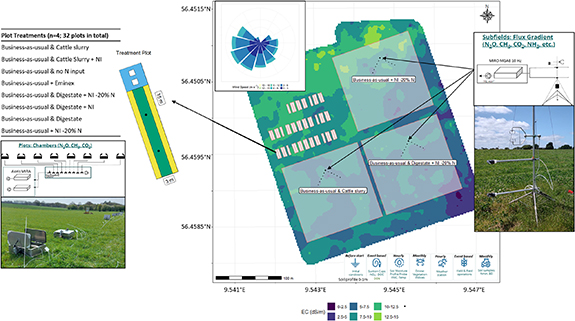
In addition to the supersites, SmartField operates a mobile GHG measuring system. It is impossible to cover all the situations in which mitigation options can be implemented in Denmark with two supersites, so SmartField includes a mobile system. The mobile system can be implemented on any farm in Denmark and serves the following purpose:
(a)
Cover important situations, soil types, environmental conditions, etc, that are not covered by the Super Sites.
(b)
Cover important mitigation technologies not covered by the super sites and make use of existing experiments testing these techniques.
(c)
Investigate landscape gradients, such as the transition from agricultural land to forest or from a well-drained area to a poorly drained area.
The mobile site is equipped with an eddy-covariance tower to take measurements at the field scale, as well as a set of automatic chambers to take flux measurements in plot experiments and along landscape gradients. The site also has sensors to take supplementary measurements.
Data from the mobile site will be collected and used for subsequent SmartField modeling and analysis.
The modeling in SmartField aims to simulate N2O emissions, field-based N balances, and yields as affected by soil properties, field managements, and weather conditions. These modeling activities will identify the effectiveness of spatial-explicit mitigation and strategies of climate change adaptation. SmartField modeling tools are essential for scenario and impact assessments. These tools will explore ways for farmers to adapt their practices in response to climate change, reducing environmental impact while ensuring food production.
Generally, three different modeling approaches have been followed in the past and will be used as well in SmartField:
(a)
A simplistic approach represented by the IPCC emission factor (EF) approach. This approach scales agricultural soil N2O emissions as a fraction of applied or mineralized nitrogen (N).
(b)
Machine learning (ML) to predict soil N2O emissions based on a few environmental parameters.
(c)
Complex biogeochemical models that consider soil, environmental, and plant growth dynamics in order to predict water, N, and C fluxes at the ecosystem scale, as well as associated N2O emissions and NH3 volatilization and N leaching processes.
Approach (a) is considered robust at large scales (national to global), but it is inaccurate at smaller scales (field to regional) (Del Grosso et al 2008). It also fails to represent interannual variations due to weather conditions, legacy effects of crops and soil management in crop rotations, and poorly represented soil properties, such as pH, that affect N2O fluxes (Liu et al 2014). In addition, this approach is generally not suitable for scenario studies testing mitigation practices beyond reductions in fertilizer rate. However, there are possibilities for improving the emissions factor approach by differentiating emissions factors between fertiliser and crop types and weather conditions (Petersen et al 2023).
Approach (b) is generally challenged because any ML model can only reproduce what has been observed. However, the vast majority of current N2O flux measurements do not represent the observed high temporal variability so that annual N2O budgets remain highly uncertain. Significant progress with ML models can only be made with better data, as the one provided by the SmartField supersites.
Approach (c) is also associated with major uncertainties because most N2O-focused field studies do not report the full N budget. Therefore, model calibrations to date have focused on simulating N2O emissions and sometimes yields while ignoring other important environmental N losses and changes in soil N (and C) stocks. This means that models are calibrated to represent a flux equivalent to approximately 1% of the N input to agricultural fields. Other loss pathways, such as NH3 volatilization, NO3– leaching, and N in the crop, are often not reported or remain unknown. Therefore, such information is often not used in model assessment. SmartField supersites aim to deliver unprecedented benchmark datasets collected at our supersites to improve the representation of N cycling processes and partitioning between N losses in biogeochemical models. We expect SmartField to open a new era of biogeochemical modeling, accelerating the changes needed for more sustainable agriculture and food production.
Although approach (c) is currently favored, approaches (a) and (b) will also be followed, focusing on the further development and testing of three advanced models (LandscapeDNDC, DayCent, and Daisy). Approach (a) will be used for a national-scale comparison and to explore whether the Tier 3 modeling approach represented by (c) can replace the current simple agricultural soil N2O EF concept for national reporting. Approach (b) will be used to explore whether SmartField benchmark data with high temporal resolution or biogeochemical model outputs can be used to train ML models with predictive capabilities. Ultimately, the latter may allow us to develop more user-friendly software for farmers and agricultural advisors or it may allow developing sets of differentiated emissions factors with improved accuracy.
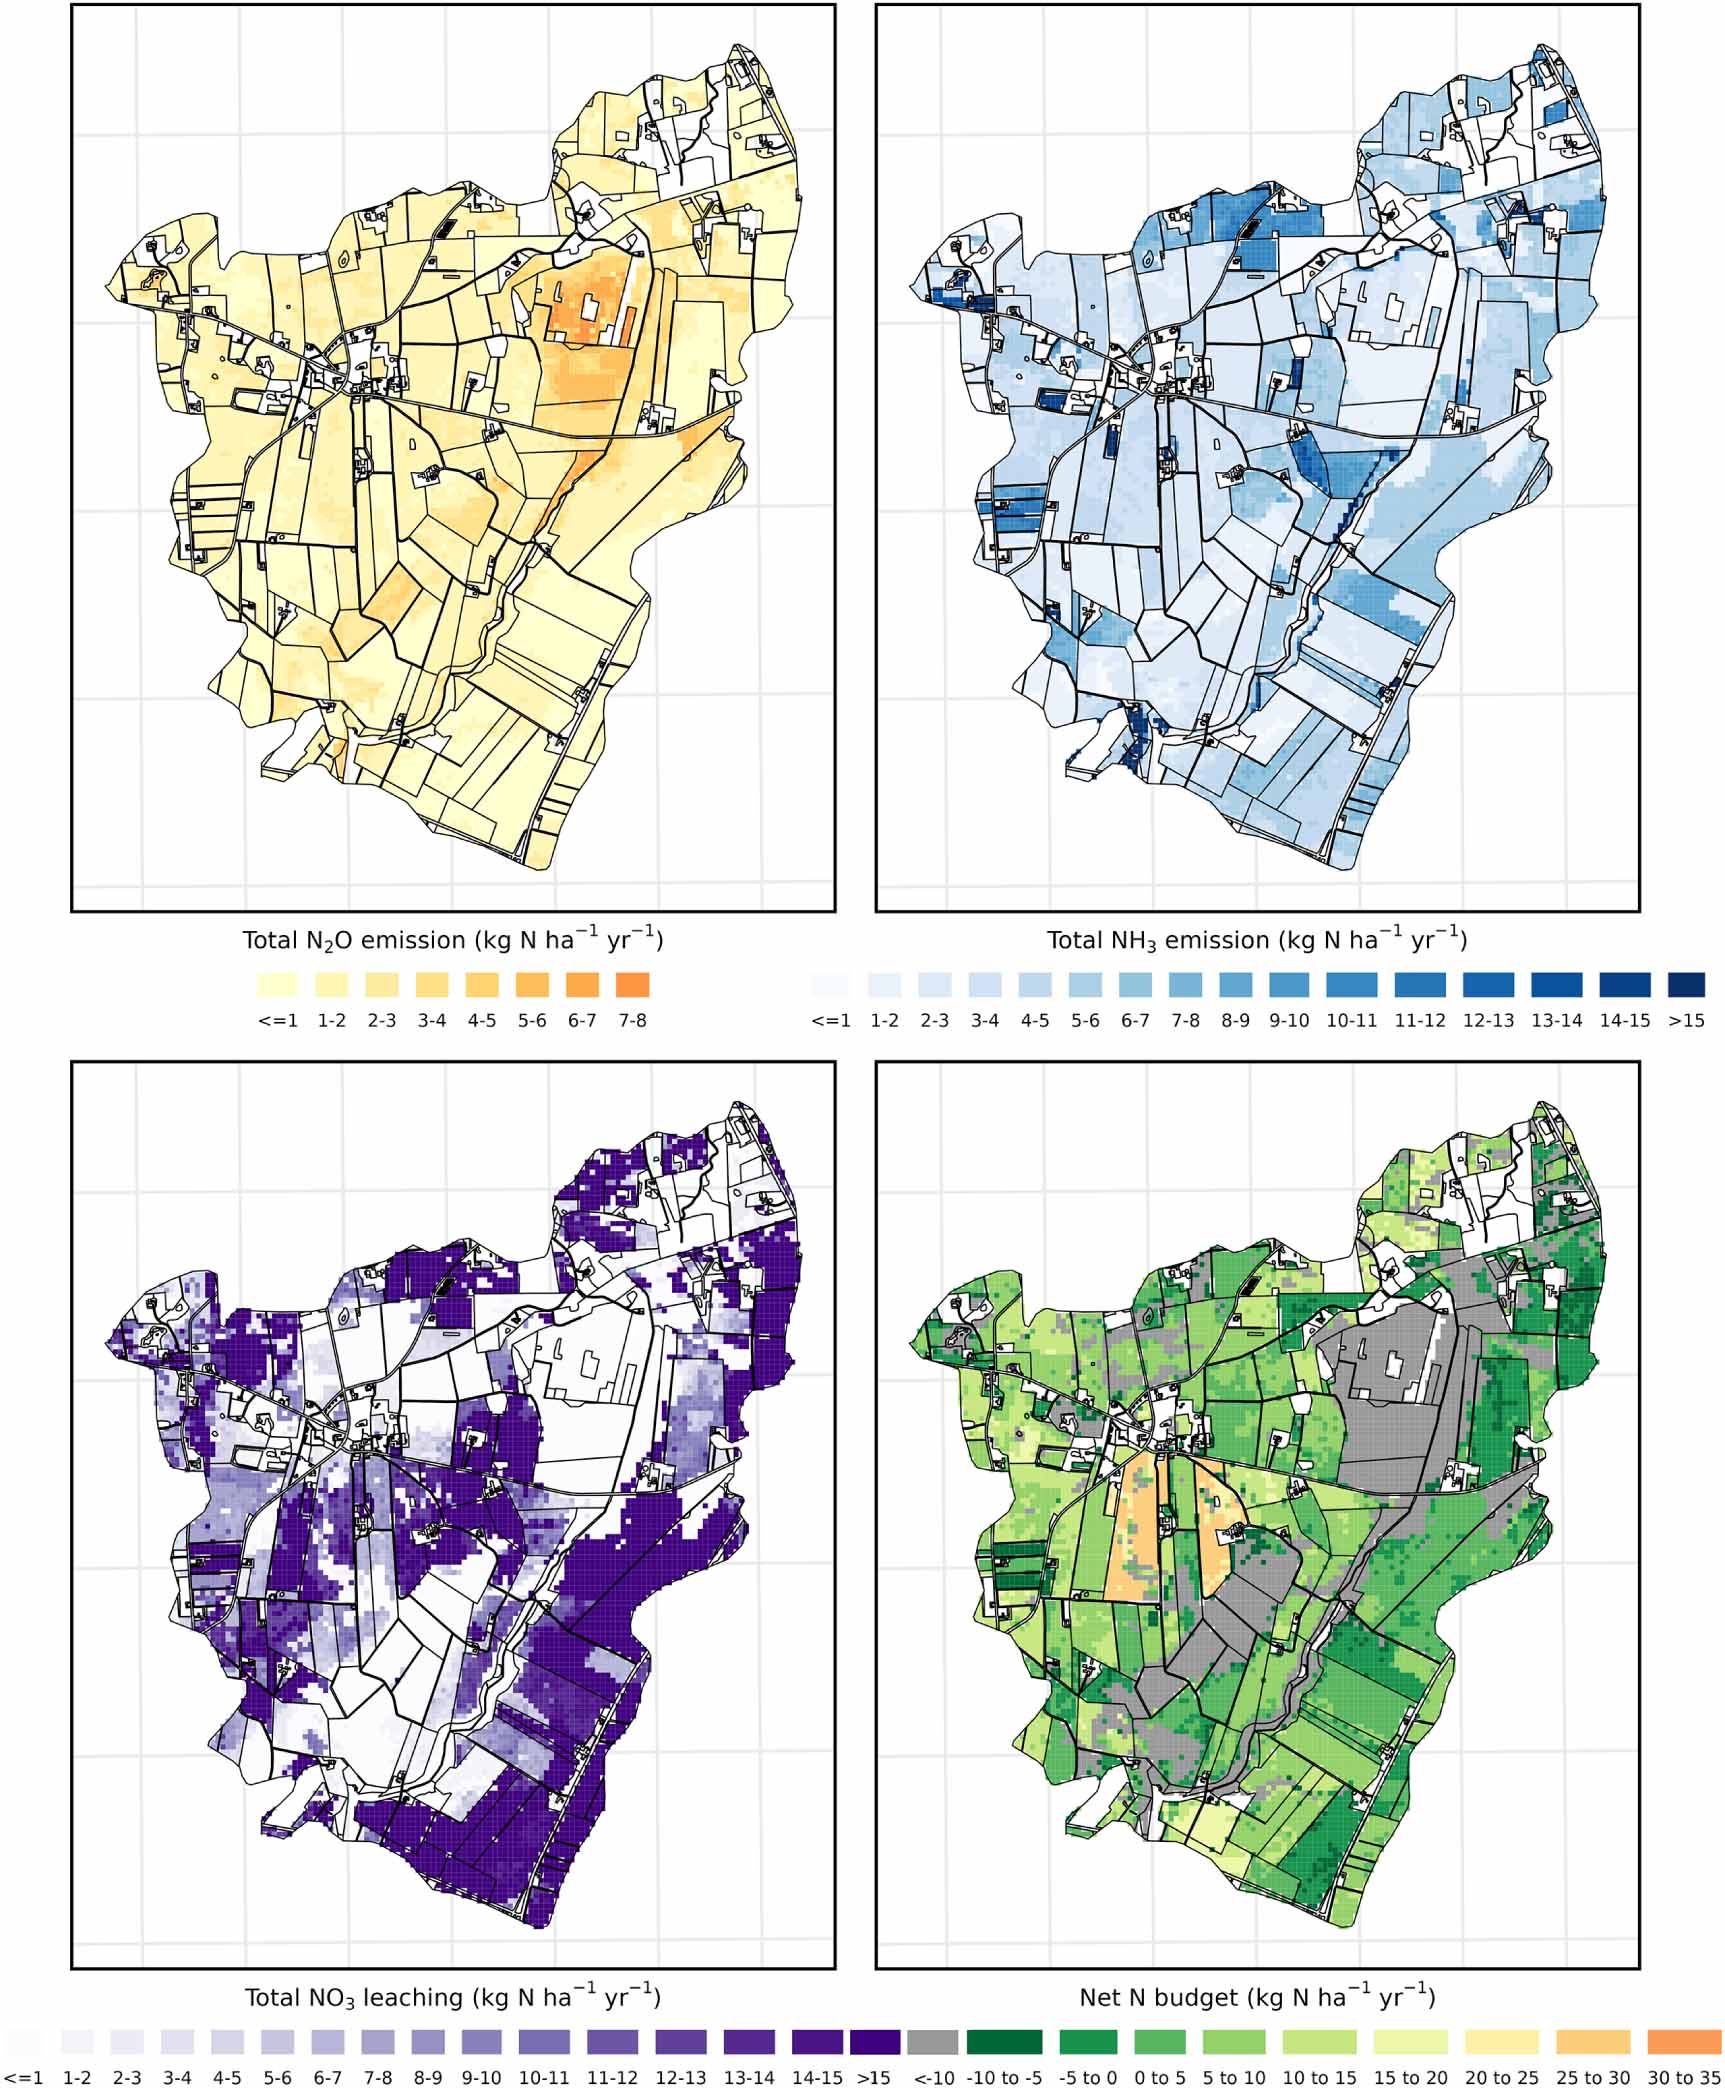
To upscale fluxes from the plot to the national level, detailed information on field management is required, including cropping systems, the use of synthetic and organic fertilizers, soil properties, weather, and ancillary information, e.g. on yields and N leaching, for assessing model performance. Among all EU countries, Denmark is likely the one where such data are reported in the most detail and over the longest period of time. For example, detailed information on soil profile properties down to 1 m is available on a 30.4 m grid (Adhikari et al 2014a, 2014b), and information on crops and application rates of synthetic and organic fertilizers can be found in the public domain at the farm level. Rahimi et al (2024) used some of these datasets to explore how the aggregation of model inputs may result in uncertainties at the regional scale. In SmartField, we will use this information to quantify N2O fluxes by modeling from the subfield to the national scale (figure 2).
Figure 2. LandscapeDNDC model simulated mean annual emissions of N2O and NH3 and leaching of NO3 at a spatial resolution of 30.4 m over a 10 year simulation period (2011–2020) for a catchment area in central Denmark. See Rahimi et al (2024) for details.
Download figure:
Standard image High-resolution image 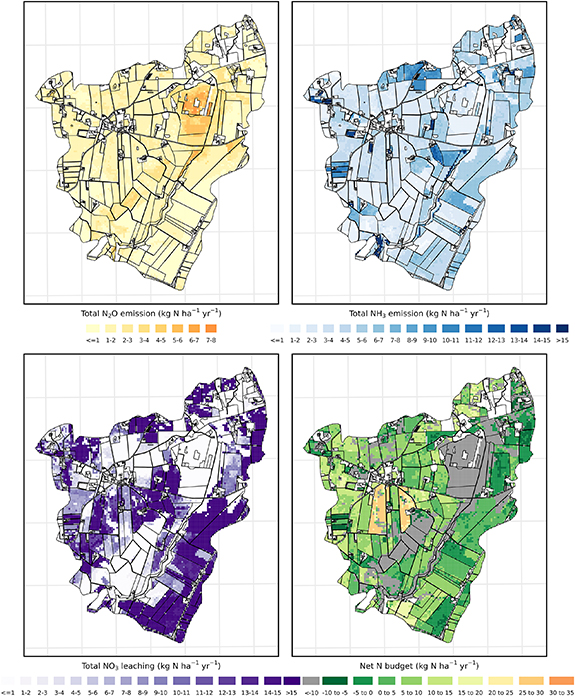
SmartField includes an interface of SPPI to ensure that progress in identifying and quantifying mitigation and adaptation strategies translates beyond the academic environment in a dialogue with key stakeholders that include the farming community, agricultural advisory, farm input providers, food chain actors, and authorities and regulators.
The SPPI aims to support the development of mitigation and quantification technologies, policy design, and policy instruments that reduce N2O emissions and other forms of environmental N loss at low cost in accordance with the new European Sustainability Reporting Standards. The SPPI ensures the exchange of knowledge and provides food chain actors and authorities with evidence-based advice, including guidance on effective incentives as well as policy and regulatory design. It also ensures that the platform supports the development of technologies and management measures backed by relevant modeling tools and observational networks. Specifically, it aims to support accurate and transparent GHG emissions accounting at the field, farm, and national levels while providing a testing ground for a monitoring, reporting, and verification (MRV) system for N2O emissions based on a Tier 3 methodology. The SPPI’s scope extends beyond the development of verifiable mitigation technologies and management measures that reduce N2O emissions. It also aims to provide insights on synergies and trade-offs between GHG emission reductions and their effects on the environment, food production, and farm profitability. To this end, the SmartField SPPI has established a discussion forum consisting of actors and stakeholders from various disciplines, including social sciences, farmer and nature associations, NGOs, and stakeholders from the food value chain and policy making arena in Denmark.
This forum is structured into various groups addressing different topics, including (a) MRV and inventory design, (b) technology testing and validation, (c) data and modeling advisory (d) policy, measures and incentives, (e) practice change and adoption, and (f) agri-food industry and (g) market incentives. These groups meet regularly to discuss concepts and requirements for an MRV platform from the perspective of different stakeholder groups. The forum also assesses the feasibility of pathways to achieve emissions reductions through changes, and identifies barriers to implementing low-emission management systems and technologies. Further discussion points include the data and modeling requirements needed to evaluate potential incentives and policy scenarios for management changes and technology implementation, as well as strategies for continuing an MRV platform for N2O emissions after the SmartField initiative ends.
SmartField’s vision is to reduce N2O emissions by 20%–30% in Danish agricultural fields by 2030, all while maintaining high productivity and avoiding N pollution. Currently, a thorough assessment of N2O mitigation options is lacking because most measurement approaches cannot quantify N2O pulse emissions or understand its role in ecosystem N cycling and N exchange processes with the atmosphere and hydrosphere. This shortcoming introduces major uncertainties: observed variations in N2O fluxes, coupled with a lack of understanding of the fate of applied N fertilizer, render nearly all potential mitigation options insignificant in a meta-analysis on a global scale, except for the use of nitrification inhibitors (Grados et al 2022). The SmartField initiative aims to address this issue by developing a comprehensive measurement and modeling framework. Furthermore, SmartField aims to raise public awareness of N2O and N research by explicitly including practitioners and politicians. SmartField also aims to discuss cost-effective incentives for reducing N2O emissions and environmental N pollution with farmers and authorities by applying a range of measures and technologies at the field and farm levels. Thus, SmartField has the potential to be a groundbreaking project that improves our understanding of how to best validate mitigation measures, of modeling of, and communication about N2O emissions from agricultural systems. Furthermore, SmartField will help identify practical, spatial-explicit mitigation strategies and technologies for current and future environmental conditions, enabling us to adapt to climate change while reducing N2O and other reactive N losses to the environment.
The SmartField initiative receives funding by the Novo Nordisk Foundation under Grant No. NNF24SA0091172. We would like to thank our partners in SmartField: the Danish Technological Institute, Aarhus University, University of Copenhagen, SEGES Innovation, and Colorado State University. Special thanks go to Triven Koganti and Jaber Rahimi for providing the figures for this paper, and to Mette Walter for her contributions to the development of the SmartField concept. Note, one author is a current employee at the Novo Nordisk Foundation and was involved in co-creation of the SmartField project.
All data that support the findings of this study are included within the article (and any supplementary files).