1748-9326/20/11/114086
Abstract
Reducing within-region income inequality is a global priority that must be urgently addressed to promote human development and enhance global access to energy and food. This could lead to higher energy-related emissions by lower-income consumers, potentially creating some conflicts with climate change mitigation objectives. Using an enhanced version of the Global Change Analysis Model, we simulate reductions of within-region income inequality that allow for narrowing differences in energy and food demand across deciles by 2050 in a Paris-compliant world. The energy demand increase by lower-income consumers is greater than the decline in demand by wealthier and more satiated income groups, leading to an overall rise in total demand. Nevertheless, the…
1748-9326/20/11/114086
Abstract
Reducing within-region income inequality is a global priority that must be urgently addressed to promote human development and enhance global access to energy and food. This could lead to higher energy-related emissions by lower-income consumers, potentially creating some conflicts with climate change mitigation objectives. Using an enhanced version of the Global Change Analysis Model, we simulate reductions of within-region income inequality that allow for narrowing differences in energy and food demand across deciles by 2050 in a Paris-compliant world. The energy demand increase by lower-income consumers is greater than the decline in demand by wealthier and more satiated income groups, leading to an overall rise in total demand. Nevertheless, the projected higher energy demand in the proposed more egalitarian societies only slightly increases the regional carbon prices and mitigation costs associated with the emission targets, therefore posing minimal impact on the achievement of the existing portfolio of climate pledges.
Export citation and abstractBibTeXRIS
Reducing within-region inequality is a societal priority that has been defined as one of the sustainable development goals (SDG; SDG10 [1]) adopted by the United Nations in 2015 to ‘end poverty and inequality, protect the planet, and ensure that all people enjoy health, justice and prosperity’. At a global level, the bottom 50% receives around 8.5% of total income, while the top 10% earns around 52% [2]. While there are large differences across regions, the observed within-region income inequalities in most countries are high, and on the rise [3].
Decreasing the differences between wealthier and poorer population segments will reduce some pressures that are usually concentrated in lower-income groups [4, 5], including lack of access to clean and modern energy [6]. While global action against income inequality is needed, it is particularly urgent for developing economies with high poverty rates. In these regions, inclusive economic growth is crucial to make vulnerable consumers achieve decent living standards, which represent the fundamental conditions for basic human wellbeing [7–12]. Recent studies show that, if there is no targeted policy to explicitly reduce within-region income inequalities, existing differences in household energy access may persist- or even exacerbate- in the future [13, 14]. Likewise, reducing within-region income inequalities will lower undernutrition in the global South and could potentially improve overweight and obesity rates all over the world [15, 16].
Despite the clear need to meet the basic energy requirements and nutritional needs of poorer population groups, mainly, but not only [17], in developing economies, higher energy demand will have multifaceted environmental implications, including additional challenges for climate change mitigation [18]. Some research suggests that climate change mitigation and reducing income inequality are two social priorities in conflict [19, 20], but recent studies question whether such a trade-off truly exists, or to which extent it depends on different factors such as the initial level development of the country [21–25]. In addition, the potential increase in energy-related emissions by poorer consumers in developing economies could be compensated by larger mitigation efforts by high-income regions [26], so that there would be moderate impacts on total carbon emissions, and existing climate targets would not be jeopardized [27–31].
While the relation between income distribution, greenhouse gas (GHG) emissions, and climate change has largely been analysed in existing literature, it has been particularly focused on carbon inequality [32–35] and on how a warming climate can exacerbate income inequality [36–39]. However, there is less scientific consensus on the implications of reducing within-region inequalities on GHG emissions and climate change. There is also limited work exploring the future effects of reducing inequalities for the existing climate objectives. In this study, we explore the multisector and multiscale effects of alternative Paris-compliant scenarios where within-region income inequalities are exogenously reduced, for a range of energy services that include residential cooling, heating, and non-thermal services (e.g. appliances), and domestic and international transportation. We also explore the implications of the different inequality scenarios for the food demand of different population groups, with a particular focus on lower-income deciles in developing regions. Then, we analyse the changes in carbon prices and mitigation costs required by each region to achieve existing climate policies and emission pledges in these alternative scenarios. For that purpose, we use an enhanced version of an integrated assessment multisector model (the Global Change Analysis Model [40]) that includes consumer heterogeneity in three end-use demand sectors, namely residential energy, transportation, and food.
2.1. The Global change analysis model (GCAM)
GCAM is a multisector integrated assessment model designed to quantify human and physical Earth-system dynamics, by exploring the interdependencies between the economy, energy, water, climate, and agriculture, forestry, and land use systems [40–42]. GCAM allows quantification and exploration of the implications of alternative uncertain ‘what-if’ type scenarios within a single computational platform. The model outcomes can be used to explore the implications of alternate futures, so they can inform stakeholders in the design or implementation of different climate policies or transformational strategies. Therefore, the model has been widely applied for both national and international assessments. These include the IPCC scenarios [43], the shared socioeconomic pathways (SSPs) [44], the network for greening the financial system scenarios [45], or the US. decarbonisation strategy [46]. More information can be found in online documentation: https://github.com/JGCRI/gcam-doc. The version of the model used in this study—GCAM_GRAPHICS—includes consumer heterogeneity in the form of income deciles in three end-use demand sectors, namely residential energy, transportation, and food. The model is completely available and accessible in an open GitHub repository: https://github.com/jonsampedro/gcam-core. For the implementation of the multiple consumers, GCAM_GRAPHICS exogenously reads in population, gross domestic product (GDP) growth, and income inequality projections. Income inequality is measured as the income shares of different consumer groups. The projections of income shares for different consumers (deciles) in each region are generated based on a non-parametric principal component analysis (PCA)-based projection model in which the first principal component is driven by the region-specific Gini coefficient [47].
Residential energy service demand per unit of floorspace is calculated by period (t), region (r), service type (h,c,o), and income decile (i), and varies by energy source. Modern fuels (e.g. electricity, gas) are more prevalent in developed regions, with demand rising alongside income until reaching a satiation point. Demand for modern heating (h), cooling (c) and non-thermal/other (o) services is determined by the heating/cooling degree days; shell efficiency (η); floorspace-to-surface ratio (R); internal gains associated with the heat released by non-thermal energy services (differentiated by region, λ); satiation coefficient (k), GDP per capita (GDPpc); average service price (P); and two calibration parameters that represent historical preferences (µ and a).
Demand (d) for traditional energy sources (i.e. coal and traditional biomass) for fuel (f) and service (s), decline in use as income increases as indicated by recent data. Note that X and Y represent calibration parameters:
Total residential energy service demand is calculated as the value per unit of floorspace multiplied by total floorspace demand, which grows with income up to a saturation point, modelled using a Gompertz function (SI, equation (1)). A modified logit model governs fuel and technology competition [48, 49]. Full model details are documented in the SI and in Sampedro et al [14].
The transportation module in GCAM [48, 49] is disaggregated into four end-use demands: domestic passenger travel, international passenger air travel, freight transportation, and international freight shipping. Focusing on the passenger sector, it is structured hierarchically by mode, with road transport divided into buses and light duty vehicles, then into two/three-wheelers and four-wheelers, and finally into cars, mini-cars, and trucks. The passenger sector also includes walking and cycling, which are not represented as energy consumers. In GCAM_GRAPHICS, domestic passenger transport demand (D) in period t, region r, and decile i is determined by per capita income GDPpc, aggregated service price (P), price elasticity (b), and population (N).
Mode and technology competition in each sector follows GCAM’s logit model [48], based on technology price and a ‘shareweight’ parameter reflecting preferences and historical trends. The choice of a transportation mode will also be influenced by initial technology shares, wage rate (GDPpc divided by annual working hours), a time value multiplier (from literature, [50]), and average door-to-door speed (SI, equation (7)). In addition, transport services are provided by energy-using technologies, with costs accounting for fuel, load factor, non-fuel costs (like capital and maintenance), and annual vehicle utilization (SI, equation (8)).
The food demand model follows the framework developed by Edmonds and Reggiani [50], which differentiates between staple and non-staple commodities and how their demand shifts with income and prices. Staple crop demand rises with income at very low-income levels, peaks around $1,000 per capita, and then gradually declines. In contrast, demand for non-staple foods continues to grow steadily with income. Overall food demand (staple plus non-staple) eventually reaches a satiation point at higher income levels. More details on the functional forms of the demand for staple and non-staple food are provided in the SI (equations (9) and (10) and in Waldhoff et al [51].
GCAM is designed to include different approaches to model emission-related policies, namely direct CO2 or GHG prices, emission constrains, or long-term climate constrains (e.g. temperature or radiative forcing). In this study, we apply regionally defined GHG emissions constrains, and the model endogenously calculates the carbon prices needed to reach the constraint in each time period. The GHGs included in the linked multi-gas policy are CO2, methane (CH4), nitrous dioxide (N2O), and different F-gases, including hydrofluorocarbons (HFCs), and perfluorocarbons (PFCs). The model also produces the total cost of GHG emissions mitigation. While there are several methods to compute the mitigation costs, GCAM is based on the ‘deadweight loss’ approach, which is a widely-applied approximation to measuring welfare loss from emissions reduction efforts [52, 53]. A detailed description on method used by the model to estimate the policy costs can be found in the online model documentation (https://github.com/JGCRI/gcam-doc/blob/gh-pages/policies.md).
2.2. Scenarios
In this study, we simulate three alternative scenarios, Baseline, Gini25, and Gini50, that are aligned with existing climate policies and Paris Agreement targets, and only differ in their income inequality projections. All scenarios incorporate the current portfolio of emission reduction pledges, including the nationally determined contributions (NDCs) for 2030, submitted or announced by June 2022. These NDCs are implemented as region-level GHG emission caps, with the model endogenously calculating region-specific carbon prices to meet the targets. For the longer term (2050), additional emission constraints are included for regions that have articulated long-term decarbonisation strategies (LTTs), such as net-zero targets, whether legally binding, policy-based, or only announced (see [12], table S2). In regions lacking long-term commitments, NDCs are extrapolated to 2050 based on emission intensity trends from existing literature [54, 55]. As a result, all three scenarios follow similar GHG emission trajectories, as shown in figure S1.
The sole distinction among the scenarios lies in their assumptions about future income inequality. The Baseline scenario adopts income inequality projections based on SSP2, while the Gini25 and Gini50 scenarios are more egalitarian, assuming a 25% and 50% linear reduction, respectively, in each country’s Gini coefficient by 2050 relative to 2015 levels (table 1).
Table 1. Overview of the scenarios.
| Scenario | Description |
|---|---|
| Baseline | Income inequality projections follow the “middle-of-the-road” (SSP2) trajectories in Narayan et al [47]. The scenario includes the current portfolio of emission reduction pledges. |
| Gini25 | All regions linearly reduce their Gini coefficients 25% by 2050, compared to 2015 levels. The scenario includes the current portfolio of emission reduction pledges. |
| Gini50 | All regions linearly reduce their Gini coefficients 50% by 2050, compared to 2015 levels. The scenario includes the current portfolio of emission reduction pledges. |
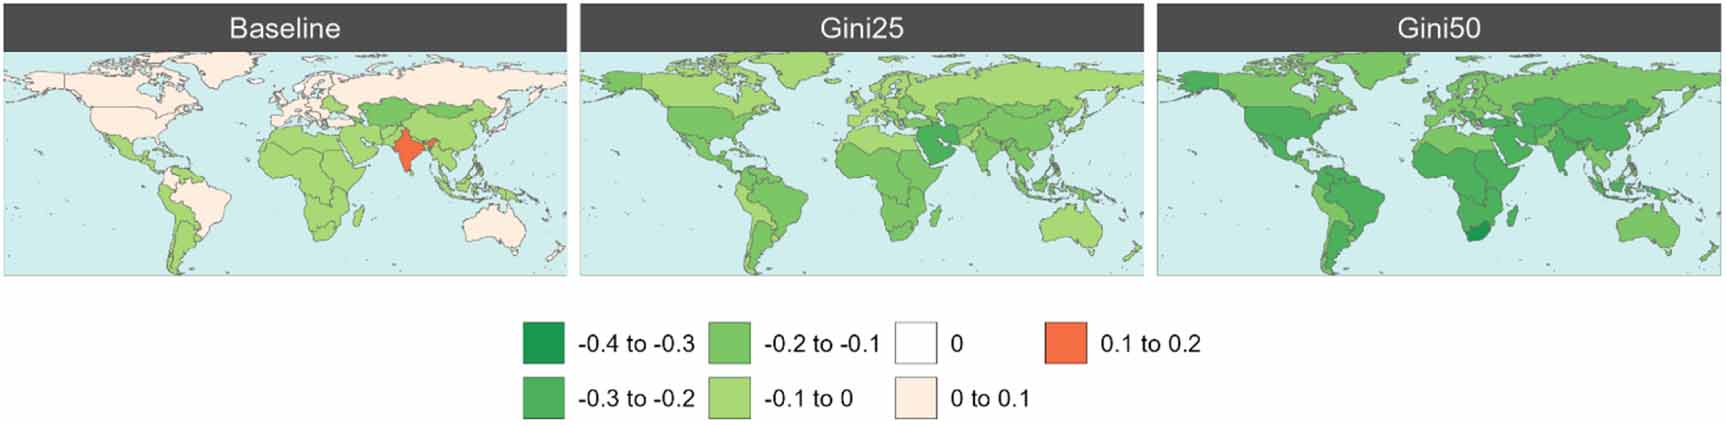
These alternative scenarios are built on two guiding principles: (1) long-term inequality trajectories should align with historical region-specific trends observed since 1967 (figure S2); and (2) by 2050, the average per capita income of the lowest income decile in each GCAM region should exceed the UN extreme poverty threshold of $2.15 d (figure S3). For instance, in India, the lowest-income decile remains below $1 d in the Baseline, but exceeds the threshold in the alternative Gini scenarios. Despite the reductions in income inequality, the per capita energy use of low-income groups in all scenarios remains below the ‘Decent Living Energy’ benchmark of 16 GJ/person in final energy consumption (figure S4) [23], indicating a conservative approach relative to more ambitious redistribution scenarios found in other studies [12]. This scenario design assumes that regions starting with higher levels of inequality are expected to experience larger absolute shifts in income distribution (figure 1 and table S1), which implies heterogeneous redistributive efforts across regions.
Figure 1. 2050–2015 change in Gini coefficient per GCAM region and scenario.
Download figure:
Standard image High-resolution image 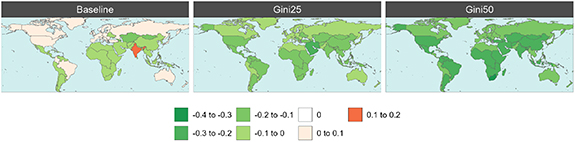
In terms of implementation, as explained in the previous subsection, the model reads in income shares for each decile in every region in order to produce the outcomes at decile-level. Using the open-access pridr package (https://github.com/JGCRI/pridr), we transform SSP-specific future Gini coefficient projections into income decile-specific shares, based on a non-parametric PCA-based approach, as described in Narayan et al [47]. The estimated future income shares for a representative subset of regions are presented in figure S5. We recognize that projecting the evolution of income inequality is inherently challenging, as it is influenced by a wide range of uncertain socioeconomic and geographic factors. Consequently, producing precise near- and long-term regional inequality projections is difficult. In this study, the Gini reductions used to construct the Gini25 and Gini50 scenarios are applied exogenously, serving as a basis for exploring their potential multisector implications. However, it is important to note that GCAM does not model the policy mechanisms required to achieve these reductions. As such, these projections should be viewed as a conceptual exercise, a way to explore possible outcomes under different inequality trajectories, holding other factors constant.
Finally, we acknowledge that, while the implementation of the current portfolio of emission reduction pledges provides a useful framework to quantify the incremental mitigation costs associated with reducing within-region income inequality, this setup may also mask certain system dynamics that would manifest in the absence of climate policy interventions. Therefore, we performed a sensitivity analysis by simulating three additional counterfactual scenarios (Baseline, Gini25, and Gini50) without climate policy constraints (‘NoClimPol’), thereby enabling us to capture additional dynamics, such as potential emission rebound effects, that are otherwise suppressed under policy-driven pathways.
3.1. Implications of reducing inequality for the energy system and food demand
Reducing within-region income inequality results in a moderately higher final energy demand. As shown in figure 2, the additional energy demanded under a more equitable distribution of income within societies by 2050 would be around 5.5 exajoules (EJ) in the Gini25 scenario and 10.4 EJ in the Gini50 scenario. While it represents a large increase in residential energy consumption for lower income groups, it only increases total global final energy demand by 1%–2%, which is comparable to the total energy consumed by countries like Spain or Germany, respectively (see supplementary information -hereinafter SI-, figure S6).
Figure 2. Changes in global final energy demand by scenario, period, and sector, compared to the Baseline scenario (EJ). Black dots represent the net changes. The percentages show the changes as percentage of total energy demand.
Download figure:
Standard image High-resolution image 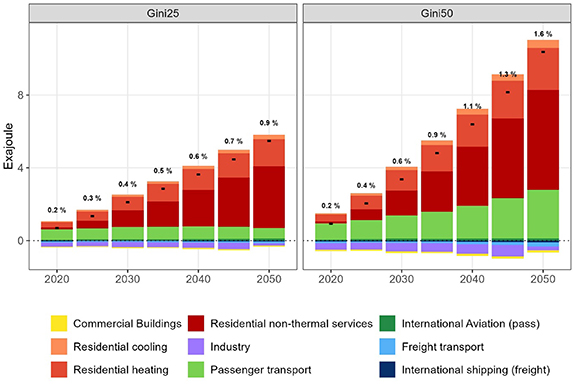
These changes in final energy demand can be broken down by sectors. Residential service demand models assume that the income elasticity of demand declines as income rises (implemented as a ‘satiation level’). Therefore, with a more egalitarian income distribution, lower-income consumers increase their demand for heating, cooling, and especially, non-thermal services. The increase in demand by lower-income consumers outweighs the decline in energy use by wealthier, more satiated income groups. At a global level, we find that, by 2050, lowered income inequality increases the total demand of residential heating by 1.49 and 2.30 EJ, cooling 0.23 and 0.43 EJ, and non-thermal services 3.4 and 5.9 EJ, in the Gini25 and Gini50 scenarios, respectively. The reduction of within-region income inequality also impacts energy demand in the transportation sector. In the Gini25 and Gini50 scenarios, energy demand for domestic transportation increases around 0.58 and 2.68 EJ by 2050, respectively, while the effect is substantially lower for international aviation (0.11 and 0.13 EJ).
In the residential sector, the largest increases are observed in lower-income deciles, which are far from the satiation levels, and their demand rapidly increase as they become relatively wealthier (figure S7). Indeed, due to the satiation principle, the demand increase by lower-income deciles is greater than the small demand reductions observed in wealthier consumers, which results from their lowered per capita income in 2050 (compared to the Baseline). In the transportation sector, both for domestic transport and international aviation, the observed increase in demand by lower-income groups is compensated by the reductions from the income reduction in wealthier consumers, so the net effect is smaller (figure S7). We note that these demand changes produce some indirect changes in other sectors, such as industry or commercial buildings, due to price equilibrium impacts (figure 2). These changes in energy demand also affect the composition of the energy mix. Due to the carbon price required to meet the implemented climate policies and emission pledges, the additional energy requirements associated with lowered income inequality come from non-emitting fuel/technology options, such as biomass (BECCS), solar, wind, or nuclear. The deployment of the different technological options largely differs by region, considering different preferences and technology costs (figure S8). In the absence of climate policies, the total change in energy service demand under the Gini25 and Gini50 scenarios is comparable to that in the narrative where climate policy portfolios are in place (figure S9). However, the composition of energy sources differs substantially given that, without climate policies, most of the additional energy demand is satisfied by fossil fuels (figure S10).
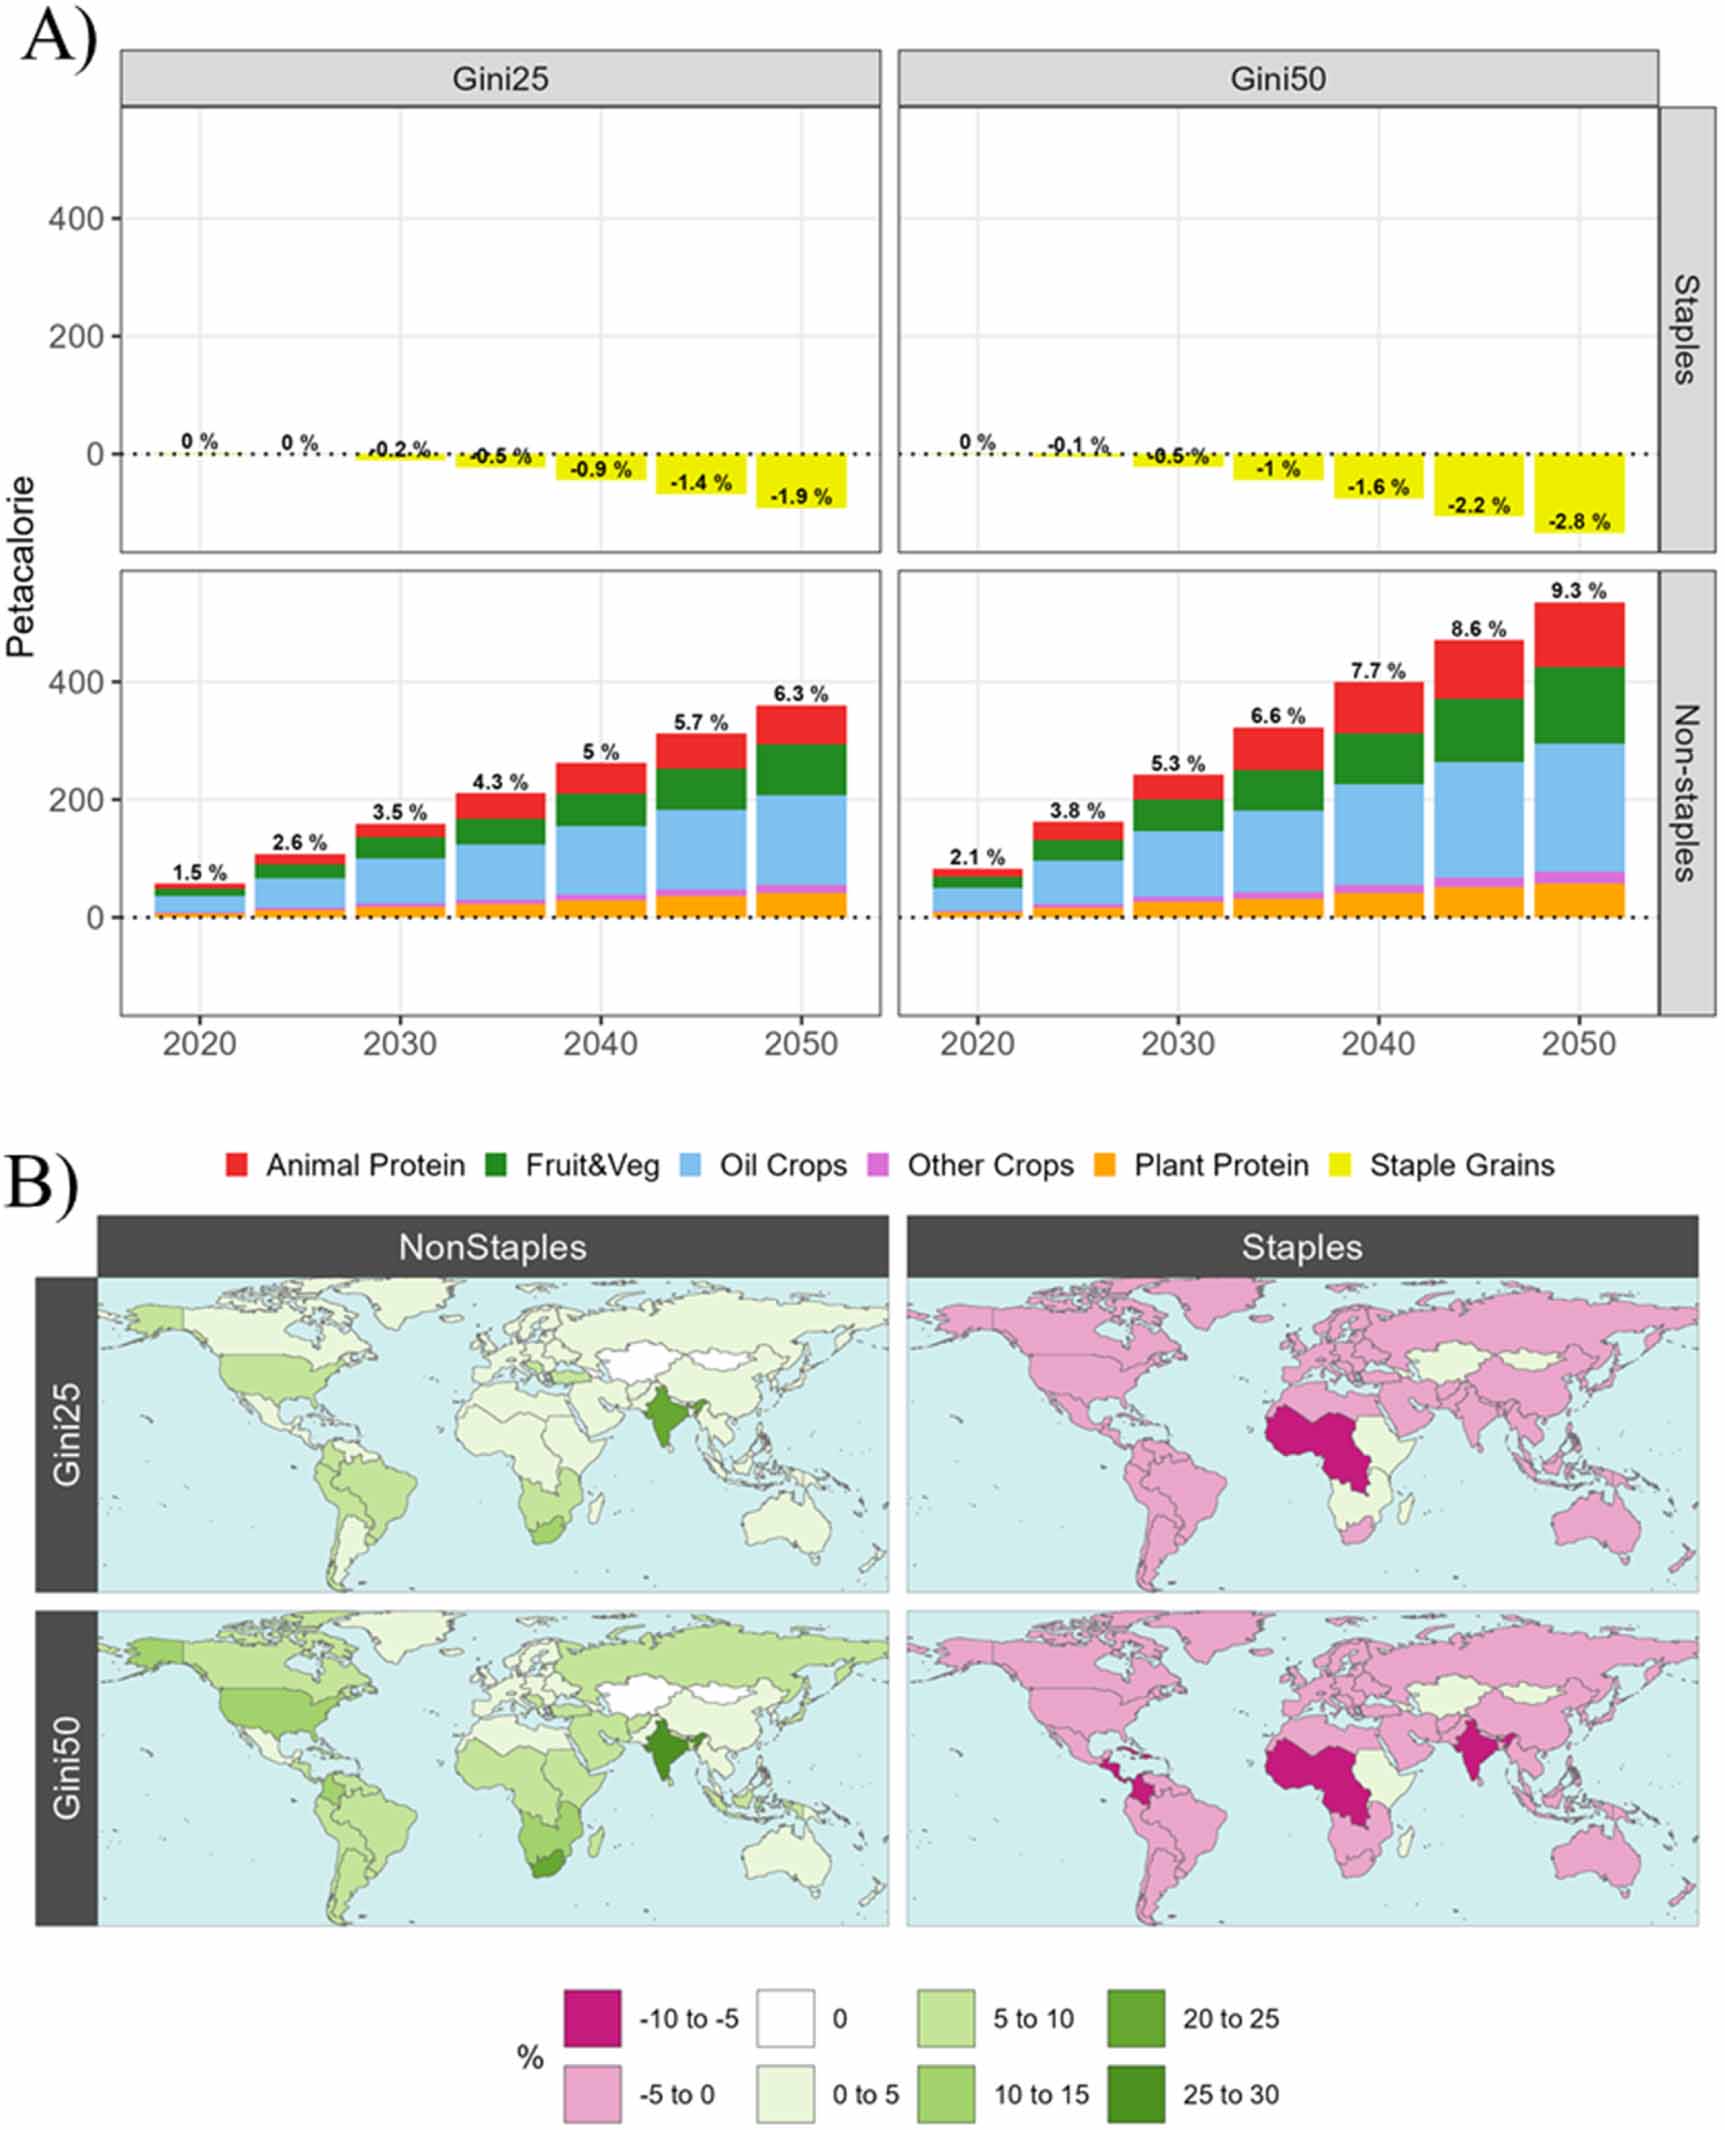
The reduction of within-region income inequality has also positive effects for food consumption and human nutrition. In the Gini25 and Gini50 scenarios, the total global calorie consumption increases by 2050 by 269 Pcal yr−1 and 402 Pcal yr−1, respectively, compared to the Baseline. This represents an increase of 2.5%–4% in total calorie consumption at a global level (figure S11), with the largest demand increases concentrated in India and China due to their large population sizes.
In addition, in most regions we observe a shift from staple commodities to non-staple food sources, which will produce some nutritional co-benefits, considering that an increased share of calories from non-staple foods generally represents a more diverse and nutritious diet. The demand for staple commodities—namely corn, rice, root tubers, wheat, and other basic grains—peaks at low income levels and, in some developing regions, low-income groups are below this peak [56]. Therefore, their demand for staple food sources increases as their per capita income rises. Particularly in Africa and India, there is an increase of the demand of staple commodities by the lowest-income groups (i.e. decile 1 and, to a lesser extent, decile 2), which it is more pronounced in the near-term (2030). This has a direct benefit on human nutrition, as we observe that, by 2050, every consumer group in every region is close to the desirable caloric sufficiency values, measured by the average dietary energy supply adequacy [57] (figure S12). Nevertheless, except for these income groups below the peak, we observe an overall decrease in the consumption of staple food sources, which represents around −91 petacalorie (Pcal) yr−1 and −134 Pcal yr−1 in 2050, in the Gini25 and Gini50 scenarios, respectively. On the contrary, the demand for non-staple food sources—including fruits, legumes, nuts, oil crops, sugar crops, vegetables, and animal protein—increases globally by 360 Pcal yr−1 and 535 Pcal yr−1 in the Gini25 and Gini50 scenarios, respectively, by 2050. This increase in the demand of non-staple food sources is mainly driven by the higher demand of lower-income deciles (figure S13). Global changes on food consumption can be found in figure 3(A), while the regional distribution of the changes is summarized in figure (B).
Figure 3. Changes in food demand per scenario, compared to the Baseline scenario. Panel A shows the global differences in staple and non-staple food consumption by scenario and period (Pcal). Panel B shows regional changes in food consumption by scenario, sector, and region in 2050 (%). Results for the scenarios with no climate policies are shown in Figure S14.
Download figure:
Standard image High-resolution image 
Focusing on within-region inequality in energy and food consumption, we find that reducing income inequalities decreases the existing differences in consumption across deciles, resulting in a more egalitarian residential energy consumption. These effects vary across regions and sectors, and largest changes are observed in some developing economies, where energy demand is now heavily concentrated in the wealthiest deciles. In India, Central Asia, the Middle East, and Northern Africa, residential heating and non-thermal energy demand for low-income groups (d1) is projected to double or even triple by 2050 in the Gini25 and Gini50 scenarios, compared to 2020 levels. Cooling service demand is projected to increase 10–20 times by 2050 compared to 2020, while per capita income during the same period grows at a comparatively lower rate of 5–8 times. These increases in household energy demand by low-income groups are higher than changes in the Baseline scenario. A similar pattern is observed in the transportation sector, where demand growth by lower-income groups in the Gini25 and Gini50 scenarios exceeds the increases observed in the Baseline scenario.
To quantify the evolution of these energy service and food inequalities, in order to focus on the differences between top and bottom income deciles, most results are illustrated with the Palma ratio [32], which represents the demand of the top decile divided by the sum of the demand of the bottom 40%, within each region (Palma ratios shown below do not quantify the inequality in average incomes across regions). For example, the Palma ratio for residential cooling in India in 2050 decreases from 22 in the Baseline to 1.2 in the Gini50 scenario (figure 4). Lower income inequality also decreases existing differences in transportation demand, both for domestic transportation and international aviation, in all regions over the world. Likewise, the demand for non-staple food commodities also becomes more egalitarian in the Gini25 and Gini50 scenarios: while in the Baseline scenario there are still large differences in non-staple food consumption in 2050 in some developing economies, these are drastically reduced in the proposed scenarios (Gini25 and, especially, Gini50), where the consumption of total non-staple calories of the top decile does not outweigh the consumption of the bottom 40% in any region (Palma ratio < 1). To offer additional metrics of energy and food inequality, we have also calculated sector-specific Gini coefficients. The changes in Gini coefficients across sectors, scenarios, regions, and time periods, supporting the findings based on the Palma ratio, are presented in the SI (figure S15).
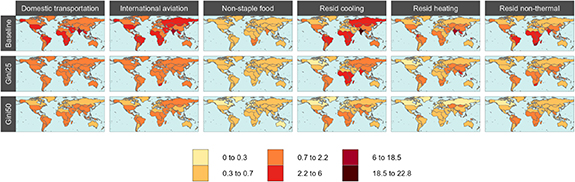
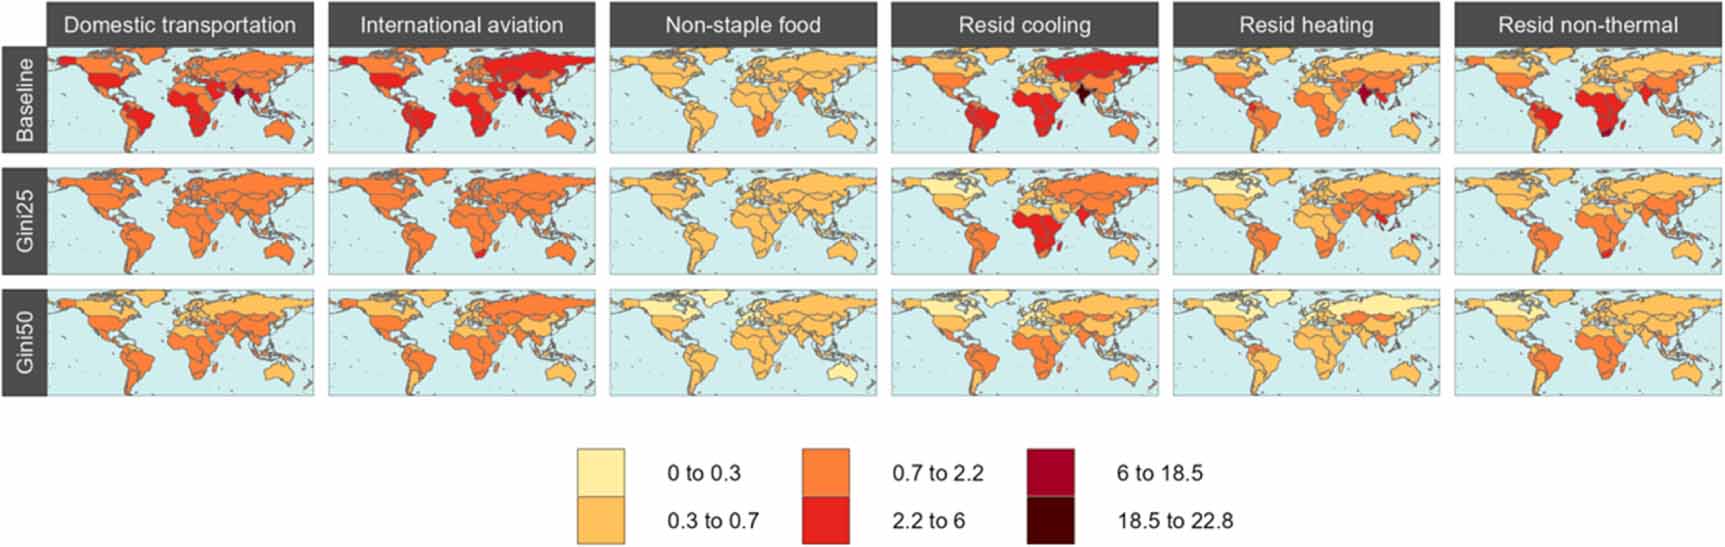
Figure 4. Projected inequalities in the demand of different sectors by region and scenario in 2050, measured as the Palma ratio, which represents the demand of the top decile divided by the demand of the bottom 40%:  .
.
Download figure:
Standard image High-resolution image
3.2. Impacts of reducing inequality for climate change mitigation
Considering the implications of reducing income inequality for energy and food demand, we explore how these changes affect existing climate policies and emission pledges. The increased energy demand, along with the changes in food systems, observed in the proposed more equal societies have direct impacts for the deployment of different non-emitting technologies required to achieve the targets. As shown in figure S8, the deployment of the different technologies varies by region, with some countries showing more reliance on carbon capture and storage (CCS) technologies (e.g. USA), while other regions have a more pronounced deployment of non-biomass renewable energy sources (e.g. India). However, in absence of climate policies, the additional energy requirements would be satisfied with fossil fuels (figure S10), which could create an increase in CO2 emissions (figure S16). In any case, when the current portfolio of climate polices is implemented, the higher energy demand and the changes on the energy mixes will have direct implications for the regional carbon prices and mitigation costs required to achieve existing emission targets.
We first observe that, considering the increase in energy demand associated with lowered income inequalities, the carbon prices in the Baseline scenario do not result in the same level of emissions reduction with either the Gini25 or the Gini50 income distribution scenarios (figure S17). Although the emission levels are similar across all three scenarios, to ensure that the climate targets are identical, we impose Paris-compliant GHG emission constraints for different regions in all timesteps, and the model endogenously calculates a carbon price that accomplishes the targets. With this implementation we can analyse how the carbon prices and mitigation costs required to achieve the emissions targets increase in the Gini25 and Gini50 scenarios, compared to the Baseline.
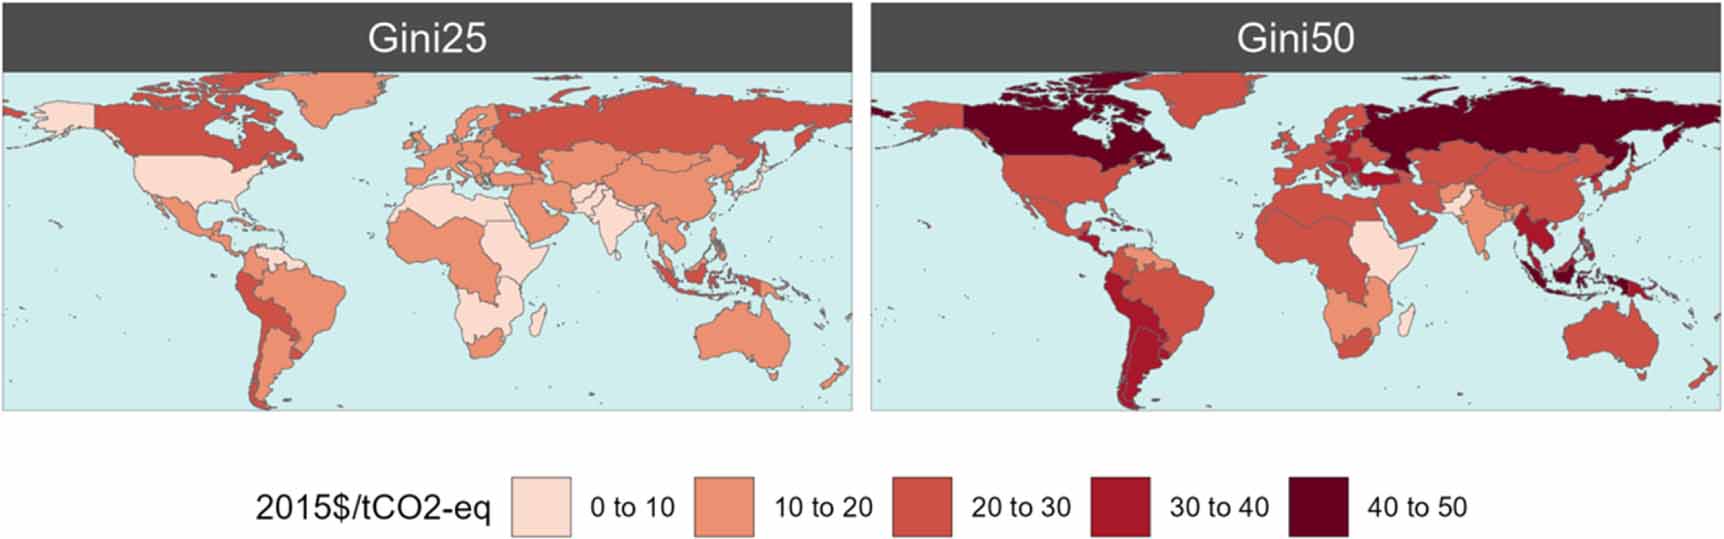
In absolute terms, we observe that the transition to more egalitarian scenarios produce moderate increases in regional carbon prices, which are higher with the more drastic income inequality reduction (Gini50). There are some regions, such as Indonesia, Canada, Russia or South America, where we observe the largest increase in the carbon price to achieve the target, representing between 40–45$/tCO2-eq (in 2015 US. dollars, undiscounted), in the Gini50 scenario, by 2050 (figure 5). These values are smaller in the Gini25 scenario, accounting for 20–22$/tCO2-eq. Nevertheless, the carbon prices required to achieve the climate targets are already high in those regions, so the additional increases associated with lowered income-inequality are small in relative terms, accounting for 2%–3% and 4%–6% in the Gini25 and Gini50 scenarios, respectively (figure S18). However, in some regions with low carbon prices in the Baseline, namely Africa Eastern, Africa Northern or Pakistan, we observe a pronounced relative (percentage) increase in the carbon prices, particularly in the Gini50 scenario, where percentage increases by 2050 account for 64% (from 15 to 25$/tCO2-eq), 50% (from 42 to 68$/tCO2-eq), and 47% (from 16 to 26$/tCO2-eq), respectively (table S1). It is important to note that the largest per cent increases are in low-income regions.
Figure 5. Projected differences in the carbon prices required to achieve existing GHG emission targets associated with the income inequality reductions in 2050 by scenario and region (2015$/tCO2-eq). Relative changes are shown in the SI (Figure S18).
Download figure:
Standard image High-resolution image 
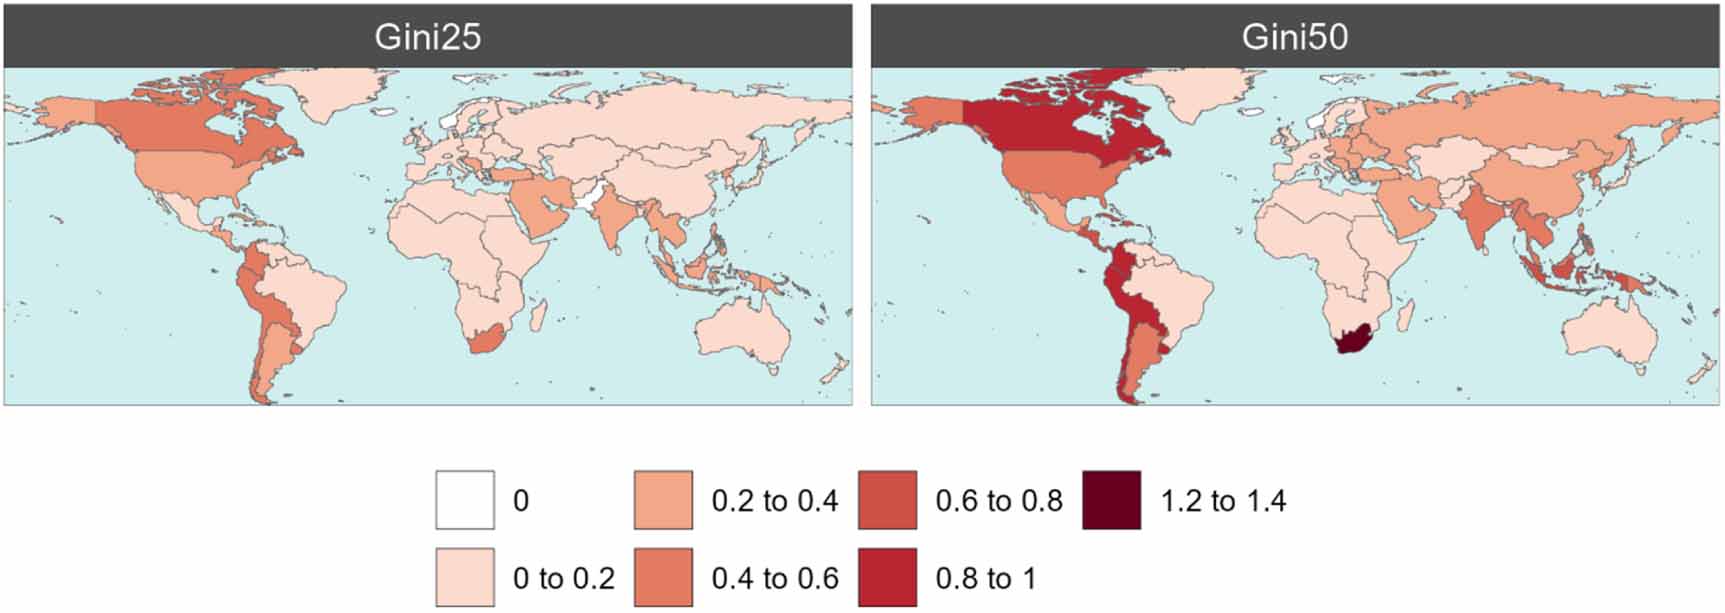
To evaluate the macroeconomic implications of the higher carbon prices attributable to lower income inequality, we also analyse the total cost of mitigation, measured as the welfare loss from GHG reduction efforts [52]. For a better comparison, we show these policy costs relative to each region’s GDP. At a global level, the additional cumulative (2025–2050) policy cost relative to the GDP associated with lower inequality represents around 0.2% and 0.4%, in the Gini25 and Gini50 scenarios, respectively. These values vary across regions and scenarios, as summarized in figure 6. South Africa (0.6%; 1.2%), Canada (0.5%; 1%) or South America (0.5%; 0.9%), show the largest increases in their policy cost in the Gini25 and Gini50 scenarios. However, in most of regions the increase in the policy cost relative to their GDP represents less than 0.5%. These minor increases in policy costs show that transitioning to more equal societies may not necessarily compromise the accomplishment of the emission targets.
Figure 6. Projected differences in the policy costs associated with the accomplishment of existing GHG emission targets attributable to the income inequality reductions, by scenario and region (%).
Download figure:
Standard image High-resolution image 
Finally, we acknowledge that the changes in energy and food observed in the Gini25 and Gini50 scenarios have some implications for non-CO2 GHGs and air pollutants (figure S19). Although GHGs are included in the emission caps by design (see section 2), and thus overall effects are limited. For example, since CH4 emissions are constrained, the additional demand for animal protein is largely met by non-beef sources such as poultry. However, moderate increases occur in nitrous oxide (N2O) and ammonia (NH3), mainly due to dietary shifts driven by fertilizer use, feed production, and livestock composition.
This study shows that, at global level, reducing within-region income inequality increases the demand of energy services and nutritious food by lower-income deciles, reducing existing differences across consumer groups. This higher energy demand by lower-income groups outweighs the reduction observed in wealthier consumers, and therefore there is a net increase in absolute energy consumption. When emissions constraints consistent with the Paris Agreement are imposed, this additional energy demand would be satisfied by non-emitting energy technologies, namely biomass, solar, wind, CCS, and nuclear, thereby avoiding the potential increase in CO2 emissions observed under a narrative without climate policy. We find that the implementation of income inequality reductions on top of decarbonisation policies slightly increases the carbon prices required to achieve the existing climate targets. Moreover, the total mitigation costs associated with these climate objectives only marginally increase when income inequality is reduced, with these additional expenses accounting for less than 1.5% of each region’s GDP across the analysed scenarios. These results are aligned with existing literature that concludes that reducing inequality does not necessarily jeopardize climate objectives [27, 28, 30, 31, 58].
Nevertheless, we observe some relevant dynamics and identify some additional aspects that cannot be captured, which are planned to be explored in further research. The higher carbon prices observed in some developing economies could have some economic impacts in these regions that cannot be explored with the model used here. A combination of top-down multisector models with bottom-up household-level microsimulation models could allow to deep-dive into these price impacts, and inform policymakers in the design of strategies that guarantee an equitable and inclusive low-carbon transition [59]. At the same time, increasing energy and food access among lower-income deciles can reduce their vulnerability to climate impacts, representing an important co-benefit, particularly for developing economies. Reducing inequality also has the potential to enhance the political feasibility of climate action, as poverty, extreme wealth concentration, and income inequality can generate barriers to effective climate action [60–62]. Given the complexity of quantitatively capturing social phenomena, including social tipping points or the effect of power relationship, these dynamics are not considered in the alternative scenarios. Likewise, the study focuses exclusively on within-region inequality, overlooking the important aspect of inequality across regions. In addition, the limited number of scenarios simulated in this study does not permit the derivation of a robust relationship between income inequality, energy demand, and mitigation costs. While a more comprehensive exploration of these interlinkages is planned to be explored in further research, the SI includes a sensitivity analysis aimed at getting additional insights on the shape of these relationships (figures S20 and S21).
There are also some limitations associated with the proposed modelling framework. In this study, consumer heterogeneity is limited to the form of income deciles. Considering additional heterogeneity dimensions, such as gender or the urban/rural categorization, would allow us to analyse intersectional inequality aspects, that are being increasingly explored in scientific literature [63, 64]. Likewise, the analysis is based on the SSP2 ‘Middle of the Road’ socioeconomic narrative [65], in which income inequality is moderately reduced due to ‘policies that shifted income growth from the top to the middle class’ [66]. Conducting the analysis under a more egalitarian narrative, such as the SSP1 [67], which explicitly incorporates ambitious inequality‐reducing policies for different regions, would directly affect the results. While the proposed scenarios, particularly Gini50, are more ambitious than the inequality projections in all SSP narratives (figure S22), starting from a Baseline scenario with already low inequality (i.e. SSP1) would reduce the impact of further decreases in the Gini coefficient. Another limitation is that the multiple consumers are implemented in the food, residential energy, and transportation sectors, and therefore we do not consider the income effect on the demand of industrial and commercial energy. Moreover, while it is out of the scope of this paper to assess the multi-dimensional feasibility of the proposed Paris-compliant scenarios, we acknowledge there are certain uncertainties that need to be considered, including the large-scale deployment of BECCS [68, 69], or the magnitude of future carbon prices, which are significantly higher than current Effective Carbon Rates [70]. Finally, the analysed scenarios represent dramatic inequality reductions that would require ambitious policy interventions, such as progressive tax reforms, redistribution measures, expanded social safety nets, higher minimum wages, or greater investments in education and health. While it is out of the scope of this study to address the challenges of implementing such a transformative strategy, we recognize that it would demand significant societal effort. This underscores the importance of designing policy pathways that are efficient, fair, and equitable, minimizing potential political and social barriers.
Reducing within-region inequality is crucial for ensuring that the global population can meet the fundamental conditions for human well-being. However, rising energy and food demands may lead to environmental pressures across multiple sectors and scales, potentially posing additional challenges to climate change mitigation. The analysis of the potential conflict between climate change mitigation and inequality is at the heart of social and political debate. This study directly contributes to the emerging body of scientific literature aimed at highlighting the need for considering inequality in climate policy design [71–75]. Our findings, showing that within-region inequality reduction does not necessarily conflict with existing emissions pledges or long-term climate targets, offer valuable insights for policymakers aiming to develop fair, equitable, and socially sustainable transition strategies. Furthermore, the results underscore the urgent need to align environmental objectives with principles of social justice, thereby paving the way for policy frameworks that are not only effective but also publicly legitimate.
This research is supported by María de Maeztu Excellence Unit 2023-2027 Ref. CEX2021-001201-M, funded by MCIN/AEI /10.13039/501100011033; and by the Basque Government through the BERC 2022-2025 program. JS acknowledges financial support from the European Union’s Horizon research program under Grant Agreement 101060679 (GRAPHICS project). The authors also acknowledge financial support from the Horizon Europe European Commission Projects ‘IAM COMPACT’ (Grant No. 101056306) and ‘DIAMOND’ (Grant No. 101081179). The views and opinions expressed in this paper are those of the authors alone.
The data that support the findings of this study and the code for reproducing the results and generating the figures are openly available at the following URL/DOI: https://github.com/bc3LC/Sampedro_etal_ERL.
The analysis has been developed using an enhanced version of the open-source Global Change Analysis Model, which can be downloaded from the following open-access online repository: https://github.com/jonsampedro/gcam-core/tree/GCAM_GRAPHICS_v7_paperInequality. The repository includes all the equations, assumptions, and parameters that are read in by the model. A detailed documentation for all these input assumptions used in the GCAM model can be found in the following open-access repository: https://github.com/JGCRI/gcam-doc. The latest projections of the net income distribution used for this analysis are publicly available on Zenodo here: https://zenodo.org/records/7474549.