2515-5172/9/11/307
Abstract
A new three-dimensional reconstruction of the Local Group (142 confirmed members) and nearest galaxies (6 members) is presented, addressing the lack of up-to-date visual representations that reflect the rapid pace of discoveries in the field. While numerous studies have refined distance measurements and catalogued newly discovered dwarf galaxies, most existing educational-graphic visualizations remain not updated or fragmented. This project offers a comprehensive view based on published data and the constantly updated Local Volume Galaxies database, using a Cartesian visualization to depict accurate spatial relationships among the galaxies of the Local Group. The resulting map not only updates previous visualizations by incorporating new members and …
2515-5172/9/11/307
Abstract
A new three-dimensional reconstruction of the Local Group (142 confirmed members) and nearest galaxies (6 members) is presented, addressing the lack of up-to-date visual representations that reflect the rapid pace of discoveries in the field. While numerous studies have refined distance measurements and catalogued newly discovered dwarf galaxies, most existing educational-graphic visualizations remain not updated or fragmented. This project offers a comprehensive view based on published data and the constantly updated Local Volume Galaxies database, using a Cartesian visualization to depict accurate spatial relationships among the galaxies of the Local Group. The resulting map not only updates previous visualizations by incorporating new members and refined distances, but also highlights the growing challenge of maintaining a consistent nomenclature and reference system for the Local Group. It is both visually attractive, and serves as a scientific and educational tool aimed at reflecting the evolving structure of our galactic neighbourhood.
Export citation and abstractBibTeXRIS
The Local Group (LG) represents our immediate galactic environment and a natural laboratory for understanding galaxy formation and evolution on small cosmological scales. Despite decades of research, its spatial structure remains difficult to visualize intuitively, especially as new discoveries continuously reshape our perception of its boundaries. Published works have traditionally represented the LG in two-dimensional projections or as tabulated datasets (A. W. McConnachie 2012; H. M. Courtois et al. 2013; M. S. Pawlowski & S. S. McGaugh 2014; E. Patel et al. 2020; A. B. Pace 2024; D. Makarov et al. 2025). These representations, although accurate at the time of publication, often fail to convey the true spatial depth of the system and to reflect the rapid evolution of distance measurements and membership definitions.
In recent years, the discovery of ultra-faint dwarfs and improved astrometric data have revealed a more crowded picture of the LG, reached 142 members, yet comprehensive and regularly updated visualizations remain rare. Nomenclature often becomes chaotic from one version to another, favouring some names over others. This condition also affects the coordinate systems used, which often differ from one another and are reproduced from various viewpoints, creating confusion for intuitive visualisation. This work, based on a previous visualisation of the LG originally created by the author and distributed under an open access licence via Wikimedia Commons (CC BY-SA 4.0) (https://commons.wikimedia.org/wiki/File:Local_Group_and_nearest_galaxies.jpg), addresses these issues by presenting a revised best 3D visualisation that combines modern data with a consistent framework of coordinates and nomenclature, with the aim of providing clarity and continuity in observational updates.
The R.A., decl., and Distance (Dkpc) data used for this visualization have been derived primarily from the Local Volume Galaxies database (A. B. Pace 2024). For each of 148 galaxies (142 of LG and 6 nearest), galactocentric distances (Dkpc) and astronomical positions (R.A., decl.) in the J2000 equatorial system were converted into Cartesian coordinates (x, y, z). When multiple distance estimates were available, the most recent and reliable measurements, particularly those based on resolved stellar populations or the tip of the red giant branch method, were preferred (A. W. McConnachie 2012). Typical distance uncertainties range from 5% for large spirals to 15%–20% for faint dwarfs. Although non-negligible, these do not significantly affect the qualitative spatial interpretation. The calculation process includes conversion of sexagesimal celestial coordinates (00h00m00s, ±00°00′00″) into decimal degrees (α°, δ°) (1) and application of trigonometric Cartesian transformation formulas (2).


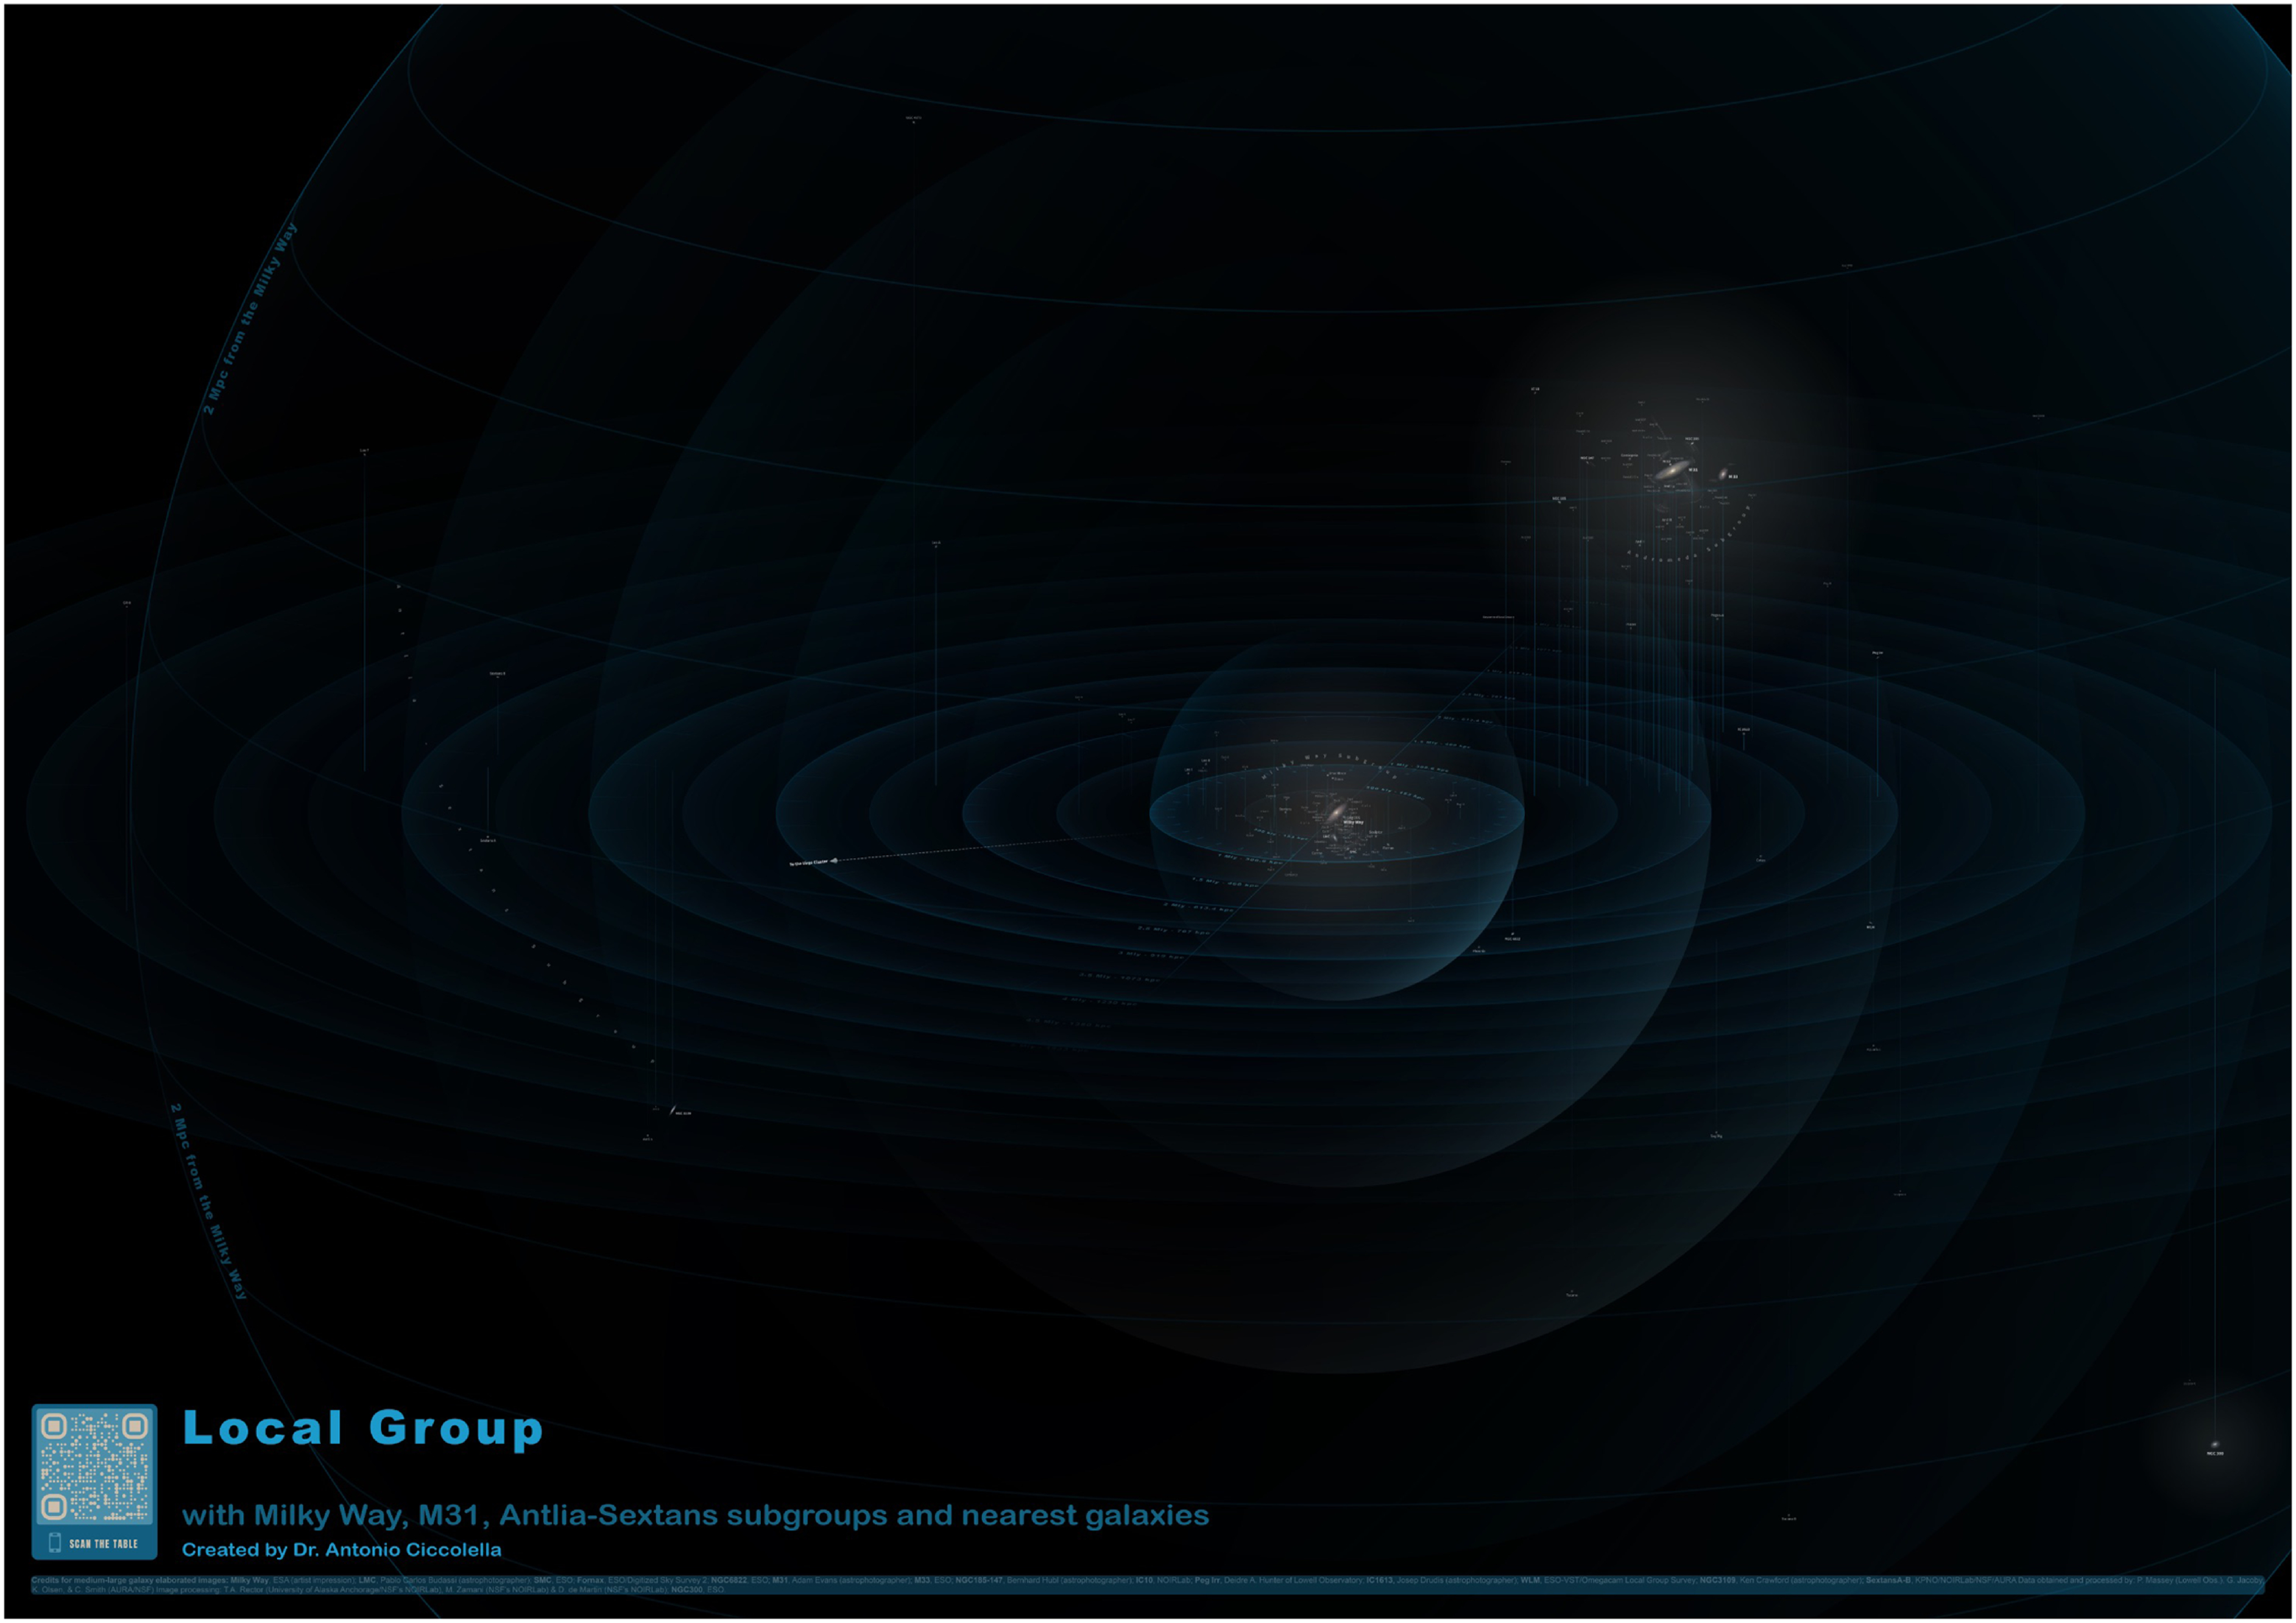
All computations and Cartesian positions (x, y, z) were produced using MATLAB software. The software was employed to transform celestial coordinates into 3D space and render the full distribution of galaxies through a perspective projection that preserves relative positions and scales. The Milky Way was placed at the origin (x0, y0, z0), with the XY and YZ planes rotated by −15° and +15°, respectively, for a best perspective. The final map was designed and refined using Adobe Illustrator and exported as a high-resolution JPEG suitable for print and screen visualization (Figure 1). The apparent sizes and luminosities of galaxies were selectively enhanced to improve visibility, particularly for faint dwarfs, while larger systems retained realistic scaling. The visualization also includes a QR code linking to an extended table of the 148 galaxies represented, listing R.A., decl., Cartesian coordinates, morphology, size (kly), distance (kpc), and subgroup classification.
Figure 1. A three-dimensional representation of the Local Group, showing the relative positions of the Milky Way, Andromeda (M31), the Antlia–Sextans subgroups and the nearest galaxies. Note that this is a low-resolution version for display purposes. High-resolution copies are available in Zenodo and Flikr under a CC BY-NC license. The positional, morphological, and size information used to make this Figure is available in machine readable format as the data behind the figure.(The data used to create this figure are available.)
Download figure:
Standard image High-resolution image 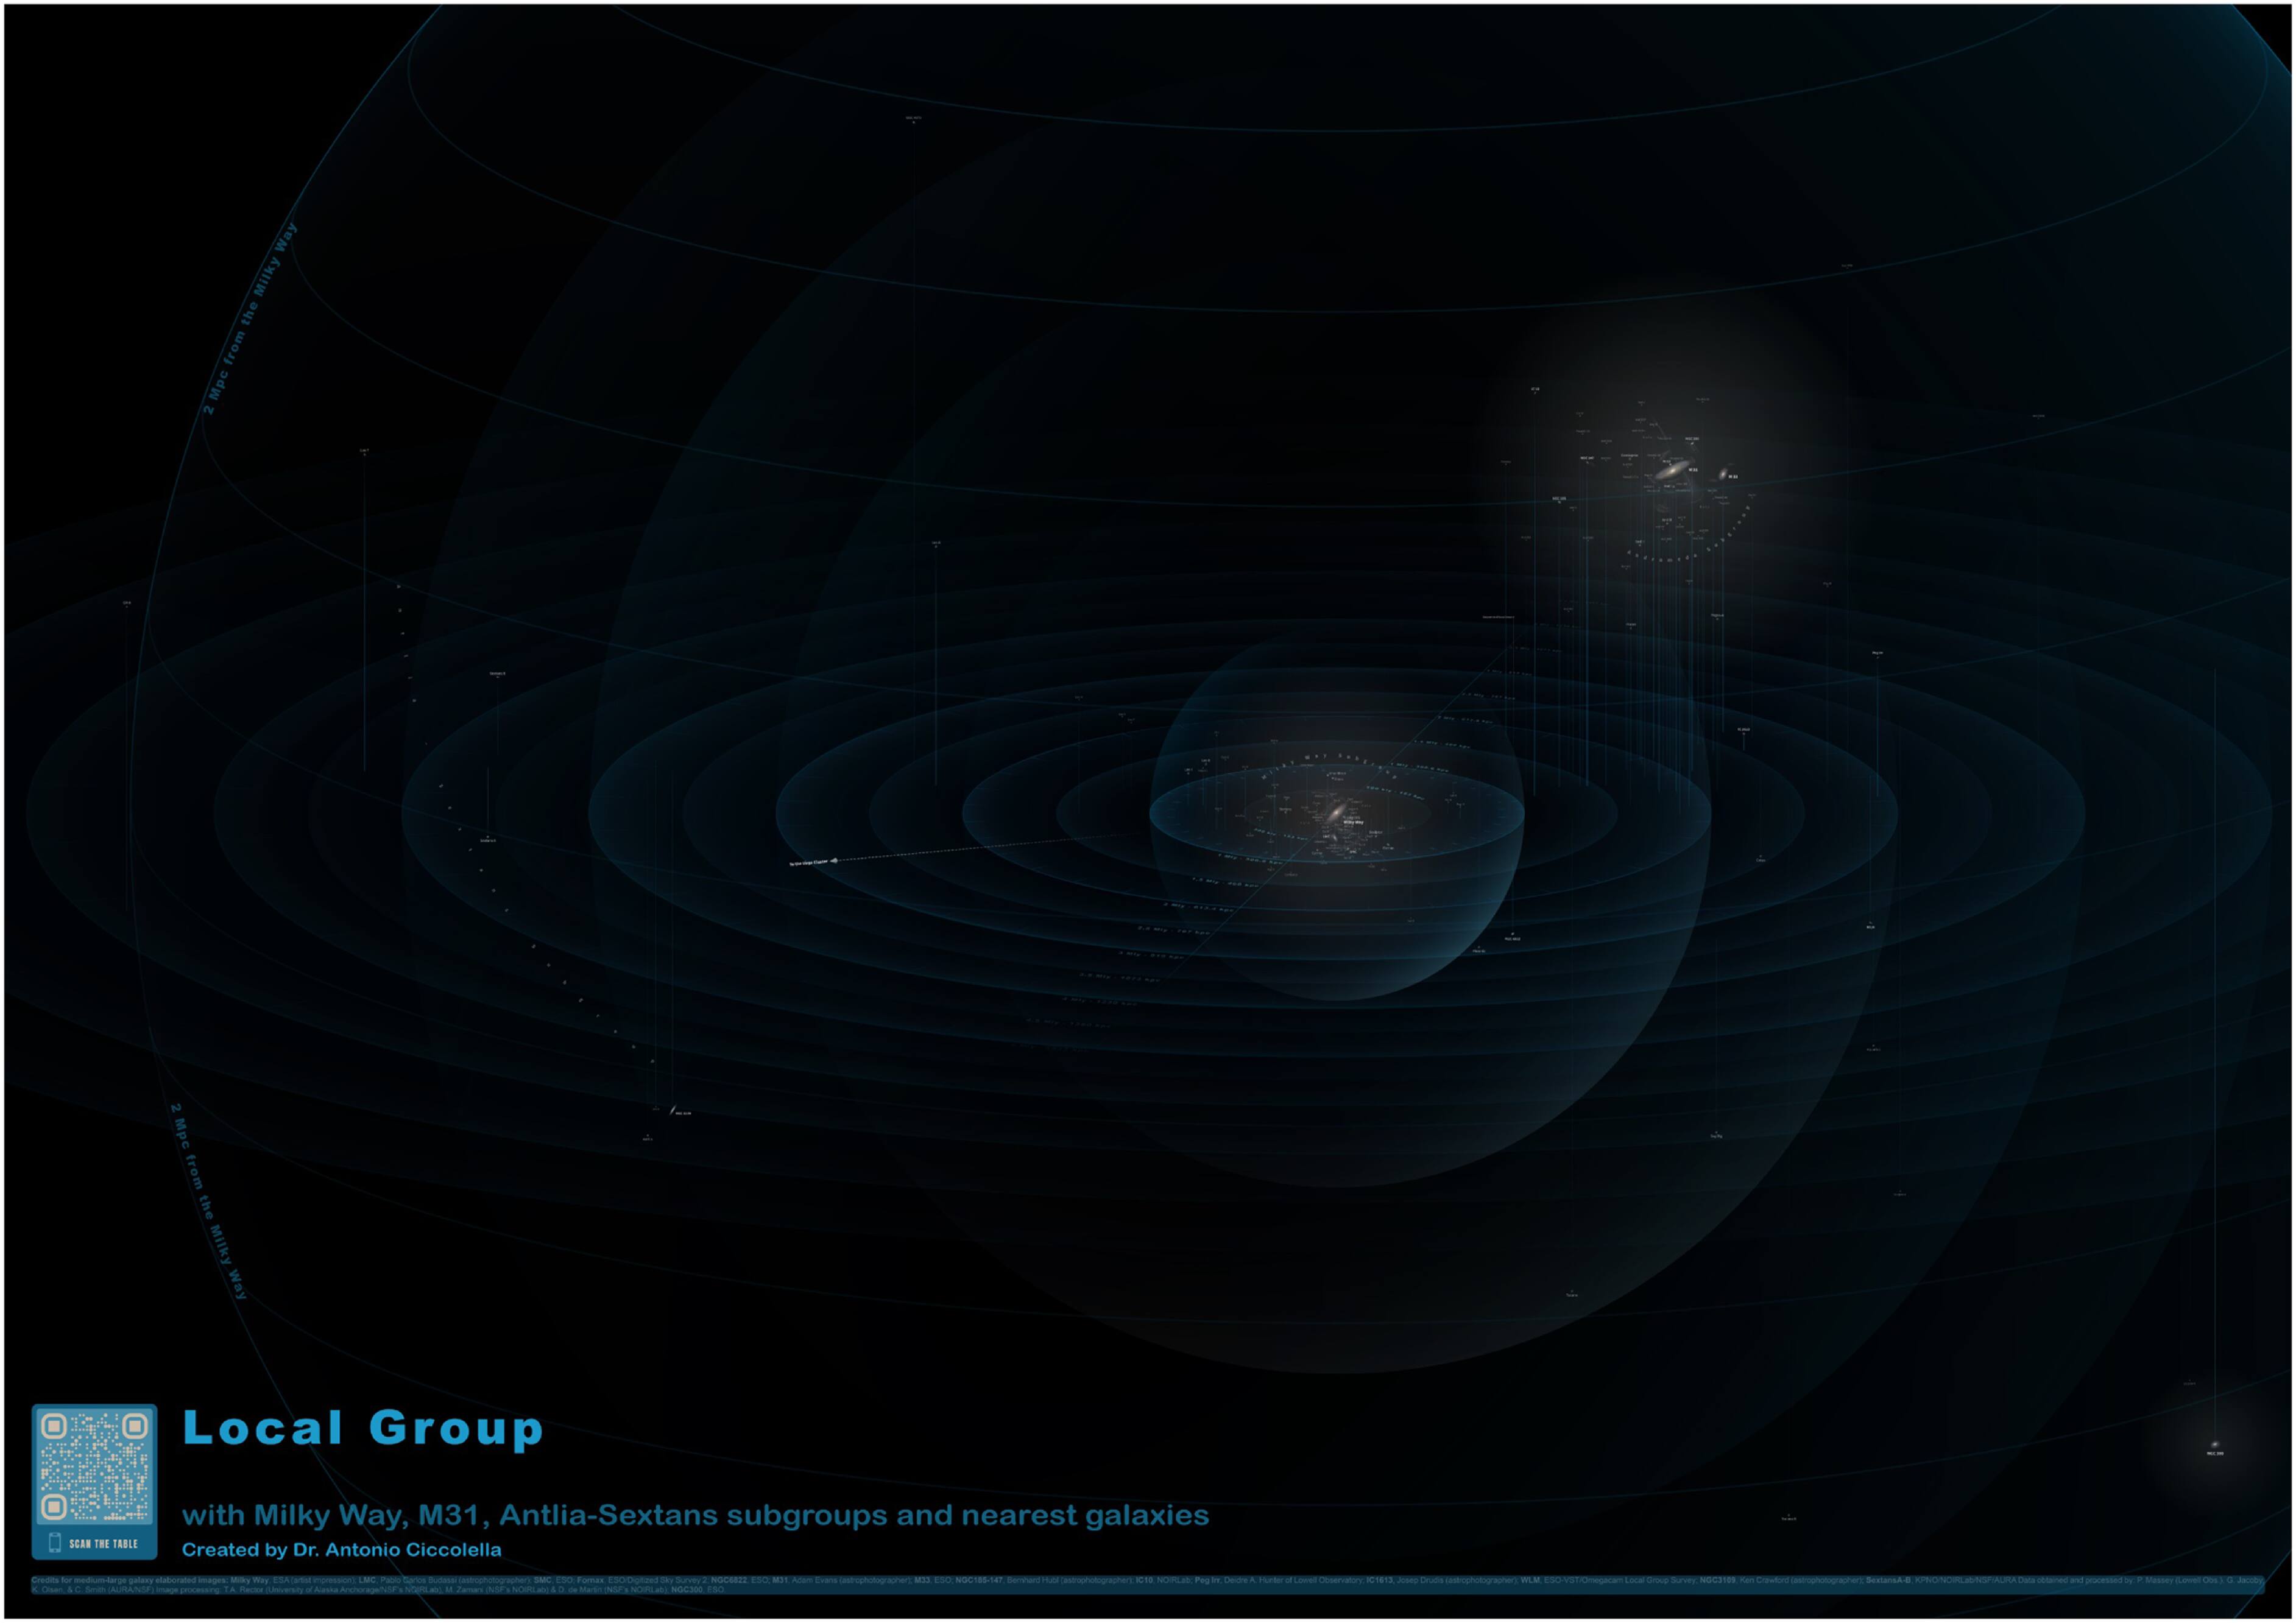
While several professional studies have produced numerical simulations or dynamical reconstructions of the LG (H. M. Courtois et al. 2013; M. S. Pawlowski et al. 2013; E. Patel et al. 2020), most remain inaccessible or overly technical for broader use. The present visualization (Figure 1), though simplified, exposes key structural and organizational challenges. The ongoing discovery of new members, particularly ultra-faint dwarfs, and revisions to distance scales reveal how difficult it is to maintain a coherent, up-to-date picture of the LG’s architecture. Existing educational and artistic representations sacrifice the scale, size and actual distribution of galaxies for the sake of clearer visualisation. This results in a lack of scientific accuracy and realism. Moreover, this map enables viewers to: perceive the vast empty volumes separating the Milky Way and Andromeda subgroups, each surrounded by its own cluster of satellites (mostly dwarfs); recognize the spatial asymmetry of satellite distributions, including the planar concentration of some dwarf galaxies (R. A. Ibata et al. 2013; M. S. Pawlowski et al. 2013); visualize the relative isolation of the NGC 3109 subgroup and other isolated members of the LG (M. S. Pawlowski & S. S. McGaugh 2014).
This visualization underlines the need for a standardized and periodically updated framework that can evolve with data. A unified nomenclature and reference system would allow astronomers, instructors and amateurs to maintain consistency between catalogues, visual maps, and simulations. The lack of such a standard remains one of the main obstacles to coherent representation of the LG. By merging scientific data precision with visual rendering, this work aims to contribute a flexible reference model that can be easily expanded as new galaxies are confirmed, and possibly extended to other galaxy clusters.
A high-resolution version of the map is freely available in Zenodo at doi: 10.5281/zenodo.17532709 ; and also at Flickr link: https://www.flickr.com/photos/203760891@N04/albums/72177720330064262, with other graphical versions of the figure, with Creative Commons Attribution–Non-commercial 4.0 International License (CC BY-NC 4.0).
The three-dimensional map presented here (Figure 1) uses the accuracy of the most up-to-date LG data, which can be updated in line with new discoveries, combined with its visual impact. The project aims to standardise a visual representation for educational purposes that is suitable for both academic and amateur use. The creation of an accurate, authoritative and periodically revised visualisation should become a collective goal for the astronomical community, limiting the confusion that currently exists and ensuring accessibility.
The author thanks the astronomical community for maintaining open databases such as the Local Volume Galaxies (LVG) database. Special acknowledgment is due to astronomer and astrophotographer Giuseppe Donatiello for his support and for trusting in the project.