Abstract
This review proposes that physical inactivity could be considered a behavior selected by evolution for resting, and also selected to be reinforcing in life-threatening situations in which exercise would be dangerous. Underlying the notion are human twin studies and animal selective breeding studies, both of which provide indirect evidence for the existence of genes for physical inactivity. Approximately 86% of the 325 million in the United States (U.S.) population achieve less than the U.S. Government and World Health Organization guidelines for daily physical activity for health. Although underappreciated, physical inactivity is an actual contributing cause to at least 35 unhealthy conditions, including the majority of the 10 leading causes of death in the U.S. Fir…
Abstract
This review proposes that physical inactivity could be considered a behavior selected by evolution for resting, and also selected to be reinforcing in life-threatening situations in which exercise would be dangerous. Underlying the notion are human twin studies and animal selective breeding studies, both of which provide indirect evidence for the existence of genes for physical inactivity. Approximately 86% of the 325 million in the United States (U.S.) population achieve less than the U.S. Government and World Health Organization guidelines for daily physical activity for health. Although underappreciated, physical inactivity is an actual contributing cause to at least 35 unhealthy conditions, including the majority of the 10 leading causes of death in the U.S. First, we introduce nine physical inactivity-related themes. Next, characteristics and models of physical inactivity are presented. Following next are individual examples of phenotypes, organ systems, and diseases that are impacted by physical inactivity, including behavior, central nervous system, cardiorespiratory fitness, metabolism, adipose tissue, skeletal muscle, bone, immunity, digestion, and cancer. Importantly, physical inactivity, itself, often plays an independent role as a direct cause of speeding the losses of cardiovascular and strength fitness, shortening of healthspan, and lowering of the age for the onset of the first chronic disease, which in turn decreases quality of life, increases health care costs, and accelerates mortality risk.
I. GENERAL INTRODUCTION: THEMES
Multiple definitions of physical inactivity exist. For the purposes of the current review, physical inactivity is defined as the spectrum of any decrease in bodily movement that produces decreased energy expenditure toward basal level (FIGURE 1).
FIGURE 1.
Spectrum of the types of physical inactivity. Following the arrow from right (low intensity of physical inactivity) to left (high intensity of physical inactivity) shows our estimate of the intensity of physical inactivity per unit of time. Not shown is the volume (intensity × duration) of physical inactivity. For example, spinal cord severance is high intensity and health decrements appear within days. In opposite manner, sitting is low intensity, with long-term health effects not clinically apparent within days, but nonetheless unhealthy when first appearing after many years.
Our definition of physical inactivity is converse to the United States (U.S.) government’s definition of physical activity, which is “any bodily movement produced by the contraction of skeletal muscle that increases energy expenditure above a basal level” (82a). First, we will provide an overview of nine important themes and concepts about physical inactivity, followed by more in-depth consideration later in the review.
Theme 1: While the definitions of physical inactivity and physical activity are in essence the converse of each other, many of the underlying biochemical and molecular mechanisms of physical inactivity are not simply the converse of physical activity. Instead, mechanisms of physical inactivity in some cases employ totally different pathways than physical activity uses.
One explanation is that unidirectional steps often occur in biochemical pathways for anabolic and catabolic pathways (see sect. IXE). Importantly, potential consequences of some differing biochemical pathways between physical inactivity and physical activity suggest that 100% fidelity cannot be made for physical inactivity mechanisms merely by reversing directionality of known mechanisms for physical activity.
Theme 2: Epidemiological evidence exists that physical inactivity actually causes risk factors that, in turn, increase morbidity and mortality.
The U.S. Centers for Disease Control (CDC) published a series of papers in JAMA over the past quarter of a century on physical inactivity. In 1990, Hahn et al. (196) concluded that the risk factor of sedentary lifestyle contributed 23% to excess deaths from nine of the major chronic diseases. Mokdad et al. (337) titled their article and their descriptor of poor diet and physical inactivity as an “actual cause” of 15.2% of deaths in the U.S. In 2015, Carlson et al. (75) noted that 11.1% of all health care costs were associated with “inadequate” physical activity. Thus we contend that physical inactivity is an important component of the noncommunicable disease epidemic in the U.S., as well as worldwide (240, 305) (see sect. IIE).
Theme 3: Gene and environmental evidence exists for physical inactivity actually causes risk factors that, in turn, increase morbidity and mortality.
Our artificial breeding experiment determined if we could develop rats with the phenotype of low voluntary running distance in wheels, which provided indirect evidence for the existence of genes with functions for physical inactivity (422). Additional evidence is from twin studies [1,654 twins, 420 monozygotic and 352 dizygotic same-sex twin pairs, whose average age was 56 yr old, and body mass index (BMI) was 26.1 kg/m2] (113), that noted unique or nonshared environmental factors accounted for 55% of the variability for sedentary behavior, while additive genetic factors accounted for 31%. The remaining 15% was accounted for by common or shared environmental factors (see sect. IIG). Furthermore, Keller (242) has suggested replacement of the concept of the genome as a “static” collection of active genes with the “reactive genome.” Keller (242) contends that genome appears to function as “an exquisitely sensitive reaction (or response) mechanism–a device for regulating the production of specific proteins in response to the constantly changing signals it receives from its environment. . . .” Her concept would describe the genome as sensitive to physical inactivity. For example, in a 1968 study (443), maximal cardiac output, maximal stroke volume, and maximal oxygen consumption decreased 26, 29, and 28%, respectively, secondary to bed rest for 20 days in healthy young men. Additionally, rat gastrocnemius and soleus muscles atrophied 23 and 27%, respectively, within 1 wk when immobilized in a shortened position, the losses occurring as a first-order rate constant in a 1977 report (51). Taken together, the physical inactivity losses, if continued, without recovery, would increase the risk of chronic diseases and early mortality in later life (54, 55).
Theme 4: The incubation period for physical inactivity-developing pathologies to reach overt clinical symptoms is often long in duration and yet preclinically silent.
Goodman et al. in a CDC statement (183) offer 10 “Selected Definitions for Chronic Disease and Other Chronic Conditions” in their Table 1. Our selected first definition from the 10 is from the World Health Organization (WHO) (541), “Chronic diseases are diseases of long duration and generally slow progression.” Our selected second definition from the 10 is based upon McKenna and Collins in Goodman et al. (183); it provides greater specificity. “They are generally characterized by uncertain etiology, multiple risk factors, a long latency period, a prolonged course of illness, noncontagious origin, functional impairment or disability, and incurability.” A critical concept is that the roadmap from physical inactivity to overt type 2 diabetes (T2D), or most other chronic conditions, is that the process is “generally slow in progression” and a “long latency period.” Often the slow, natural progressions of chronic diseases require studies of aspects of the progression rather than the entire continuance (from physical inactivity → physiological dysfunction → concealed pathobiology → overt symptoms → diagnosis) (FIGURE 2). In summary, progression to more severe pathobiology during continuous physical inactivity is slow and long in duration.
FIGURE 2.
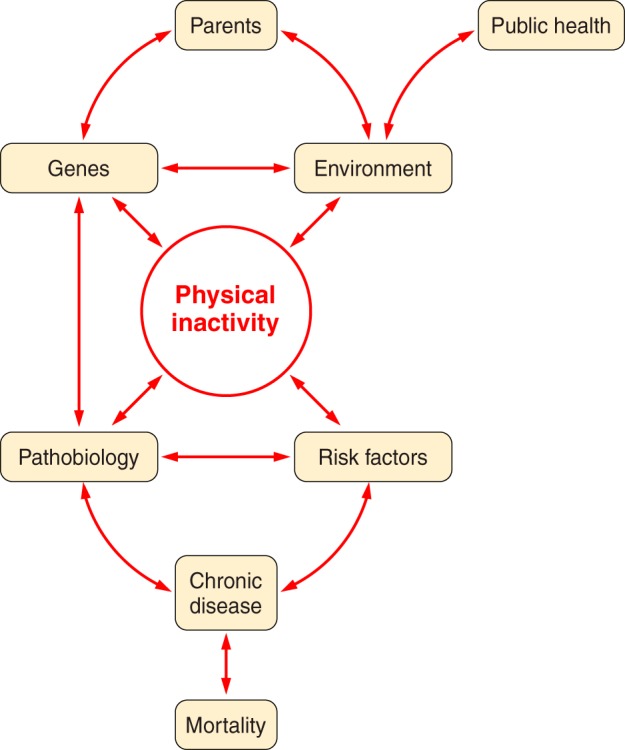
Parents provide their offspring with genes and environment, which both produce physical inactivity. Physical inactivity interacts with inherited gene predisposition of offspring to produce pathophysiology, which, in turn, interacts with risk factors to establish probability for chronic disease and mortality.
Theme 5: Continuous physical inactivity accelerates the lifelong decline in cardiovascular (maximal ability of the entire body to deliver and consume oxygen with all skeletal muscles in maximal rhythmic contraction) and strength (maximal force produced by a single contraction by a group of skeletal muscles) fitness.
Premature drops in either of the two aforementioned fitness levels accelerates the decline rate and the onset and prevalence of 1) morbidity and mortality and 2) endurance and strength frailty (see sects. VI and IX).
Theme 6: Selective breeding for the characteristic of low voluntary running distance provides evidence for the potential existence of genes having functions to produce physical inactivity.
For the first four generations of selective breeding, no decline in mean voluntary running distance was observed in offspring. However, the fifth generation produced offspring with low voluntary running distances less than in the founding population (422), suggesting that using artificial breeding that physical inactivity genes exist (see sect. IIH2).
Theme 7: Chronic disease genes and physical inactivity are both polygenic. Single gene variants correlated to any chronic disease prevalence offer insufficient predictability to be clinically relevant.
Bouchard et al. (59) were the initial pioneers of exercise genomic research with the Heritage Family Study. They studied in genetic variation in the adaptation to regular physical activity in terms of cardiorespiratory endurance and changes in cardiovascular disease and T2D risk factors. He provided a summary of the lack of progress in exercise genomics in a comprehensive review (58), where he noted that exercise genomics 1) has potential to make substantial contributions to an understanding of exercise biology; 2) has yet to deliver high-quality data; 3) “would benefit from a greater reliance on experimental studies and unbiased technologies to identify genomics, epigenomics and transcriptomics targets”; and 4) while worthy, translation is “highly premature” to advise fitness or athletic goals. Joyner (229) concurred, suggesting “many common diseases might have subtle genetic or DNA sequence variant based components but perhaps the best way to categorize most of them is ‘just barely’” (see sect. VB).
Theme 8: Adaptations to physical inactivity selected by physical inactivity during evolution enhanced survival by allowing for rapid transitions between endurance and strength phenotypes.
We speculate that genes for physical inactivity could have been advantageous for survival during natural selection, for example, for the intrinsic characteristic of rapid protein turnover. Most rate-limiting steps in biochemical pathways have short protein half-lives for rapid turnover (180), permitting protein concentrations to be able to change rapidly from one level to another, relative to longer protein turnover (222, 448). This notion may be explained by Darwinian (or evolutionary) medicine, which we define as the application of modern evolutionary theory to an understanding of health and disease (see sect. IIH).
Theme 9: The phenotype of physical inactivity behavior begins to become overt at, or near, puberty.
Supportive evidence to this concept for the existence of physical inactivity genes include decreases in voluntary wheel running, a subcategory of locomotor activity (174). Marck et al. (318) report that five species (Caenorhabditis elegans, Mus domesticus, Canis familiaris, Equus caballus, and Homo sapiens) have locomotion that has “an asymmetrical pattern throughout life” with its peak intersecting a rising developmental and declining phase (318). Indeed, maximal lifetime distance peaks early in life when rats voluntary run in wheels, thereafter falling with increasing age, at 8–9 wks of age in female rats (498) and at 6 wks of age in domestic mice (318). Gilbert defines aging as “the time-related deterioration of the physiological functions necessary for survival and fertility” (178). A conclusion from the above could be that biological aging of voluntary running is apparent around the age of puberty.
II. CHARACTERISTICS OF PHYSICAL INACTIVITY
A. History of Recognition of Physical Inactivity
Physical inactivity was recognized at least 2,500 yr ago. Physical inactivity has been based on health for millennia. In ∼600 BC, Susruta believed that regular moderate exercise offered resistance to disease(s) and “against physical decay” (497). In ∼400 BC, Hippocrates wrote “eating alone will not keep a man well; he must also take exercise, for food and exercise work together . . . to produce health” (35). Tipton (496) and Myers et al. (348) discuss a more complete history from Hippocrates to 50 yr ago. Paffenbarger, Blair, and Lee (376) recounted how Morris et al. (342) published in 1953 that London bus drivers, whose occupation was continuous sitting, had greater incidence of coronary heart disease twice that of physically active conductors in London double-decker buses. Taken together, physical inactivity has been historically defined based on its effect on health. To define “inactivity” in this review, we will base the definition on its impact on health.
Using the first U.S. Physical Activity Guidelines published in 2008 (511), we have set arbitrary time durations for physical activity based on public health criteria. The definition is <60 min/day of physical activity for ages of 17 yr old and under and <150 min of weekly physical activity for ages of 18 yr and older; these are minimum requirements for health (Table 1).
Table 1.
Definitions of physical inactivity for various age ranges
| Age Range | Frequency & Duration | Type of Physical Activity |
|---|---|---|
| 5–17 yr | <60 min/day | Including both moderate- or vigorous-intensity aerobic, including some muscle strengthening |
| >18 yr | <150 min/wk | <150 min/wk of either moderate- or vigorous-intensity aerobic, or <75 min/week of mixed moderate and high-intensity aerobic, preferably spread throughout the week; plus 2 days/wk of resistance training involving moderate to high intensities for all major muscle groups |
The U.S. definition of physical inactivity is similar to the WHO’s (541) definition. WHO divides physical inactivity into two classifications. Level 1 of physical inactivity (inactive) is defined as “doing no or very little physical activity at work, at home, for transport or in discretionary time.” Level 2 of physical inactivity (insufficiently active) is defined by WHO as “doing some physical activity, but less than 150 minutes of moderate-intensity physical activity or 60 minutes of vigorous-intensity physical activity a week accumulated across work, home, transport or discretionary domains (141). The current review considers the two WHO categories of physical inactivity together as a part of a continuum, as illustrated in FIGURE 2, providing a continuum of theme 4.
B. Physical Inactivity Has Increased in the Last Century
Societies today that do not employ power-driven machines and motorized transportation can provide estimates of what daily step count might have been centuries ago, allowing an educated guess as to the increase in physical inactivity seen today. Bassett et al. (24) provided one such estimate in The Old Order Amish in Canada who today refrain from using automobiles, electrical appliances, and other modern conveniences, and their occupation is labor-intensive farming. Men and women averaged ~18,000 and ~14,000 steps/day, reported 10 and 3 h/wk of vigorous physical activity, 43 and 40 h/wk of moderate physical activity, and 12 and 6 h/wk of walking, respectively. Many modern cultures have approximately one-third the number of daily steps as taken by Amish (23). On average, non-Amish adults report an average of 5,117 steps per day, and were separated into four groups: “very active” (6,805 steps/day); “somewhat active” (5,306 steps/day); “somewhat inactive” (4,140 steps/day); and “very inactive” (3,093 steps/day). Additionally, Church et al. (88) estimated that occupational energy expenditure decreased by >100 calories in both genders over the four decades. They concluded that a 100-kcal reduction in occupational energy expenditure would account for much of U.S. weight gain over the past half century. Myers, McAuley, Lavie, Despres, Arena, and Kokkinos (348), all experts in the field, support the high levels of physical inactivity in their quotation: “Current physical activity patterns are undeniably the lowest they have been in human history, with particularly marked declines in recent generations and future projections indicate further declines around the globe . . . Non-communicable health problems that afflict current societies are undeniably attributable to the fact that PA patterns are markedly different than those for which humans were genetically adapted” (8, 127, 356, 366).
C. Approximately 86% in the U.S. Do Not Meet Physical Activity Guidelines: Physical Inactivity Is Now Pandemic
Accelerometers to measure movement have superseded recall self-reporting and pedometers for validity recording of physical activity (509). We used accelerometer data in Troiano et al. (505) as a basis for estimating the prevalence of physical inactivity in the U.S. at ~86%, making it one of the highest, if not the highest, unhealthy condition in the U.S. With the U.S. population at ~325 million people and using the Troiano et al. (505) percentages of inactive humans, we estimate that >280 million in the U.S. are not meeting the U.S. physical activity guidelines for minimal physical activity to improve health.
It is unquestionable that physical inactivity has become a global health issue. Kohl et al. (254) concluded, “Physical inactivity is pandemic, a leading cause of death in the world, and clearly one of the top four pillars of a noncommunicable disease strategy. However, the role of physical activity continues to be undervalued despite evidence of its protective effects and the cost burden posed by present levels of physical inactivity globally.” Worldwide, percentages are similar to the U.S., as only 6 and 4% of English men and women, respectively, met requirements for 30 min of moderate or vigorous on at least 5 days/week with accumulated bouts of at least 10 min (86). Limited-available nonaccelerometer data suggest that >30% of the world’s population does not meet the minimum U.S. recommendations for physical activity (541). Therefore, >2.5 billion would be considered inactive by U.S. physical activity guideline standards. Lee et al. (287) estimate that 6–10% of worldwide deaths from noncommunicable diseases are due to physical inactivity. The incidence of physical inactivity is high, and unfortunately, current trends do not suggest a reversal is on the horizon. Taken together, the underappreciation of physical inactivity as a health threat could be described as “stealth” pandemic.
In the above context, the presentation of physical inactivity to alter behavior could use one of two generalized approaches. One proposal by Rose (431) is that structure (pertaining to social institutions and norms that shape the actions of individuals) may be more effective than from agency (pertaining to an individual’s capacity to make the choice to act). Readers are directed to papers favoring the structure option (331). For example, Adams et al. (1) mention the example that if packaged foods had reduced salt content, then individuals would not have to “consciously engage with any information or actively change their behavior.” We speculate that an inactivity analogy could be providing safe bike paths (structure) instead of governmental policy recommendations to exercise 30 min most days of the week.
D. Annual Costs of Physical Inactivity in the U.S. Are Estimated Between $131 and $333 Billion and Are Rising
11.1% of aggregate health care expenditures in the U.S. during 2006–2011 were associated with physical inactivity according to Carlson et al. (75) at the CDC. They conservatively estimated the inactivity cost to be $131 billion. Carlson et al. (75) state that all previous cost estimates to U.S. health care were fivefold underestimates, implying the newest estimate is also an underestimate, and state that “this study did not estimate indirect costs, which include lost productivity from premature death and disability associated with illness, nor does it address the costs in the institutionalized population that may be associated with inadequate levels of physical activity. Other studies indicate that their estimates of physical inactivity are due to conservative methodologies (119). On the other hand, we estimated 2014 U.S. health care costs to be ~$333 billion (11.1% × $3 trillion of the total U.S. health care costs in 2014) (82b). Future studies that consider these additional costs may improve estimates of the economic burden of inadequate physical activity. Nevertheless, this study found that inadequate physical activity is associated with a significant percentage of health care expenditures in the U.S.” They also found health care expenditures were very similar for inactive adults in three independent studies. The costs were 26.6% for 51,000 U.S. adults who were 21 yr of age or older (75), 26.3% for 7,004 Australian women aged 50–55 yr old (68), and 23.5% for 5,689 individuals, 75% of whom were 40 yr or older in a Minnesota health plan (407). On the other hand, costs of physical inactivity in a total of 142 countries were “conservatively estimated” to be direct and indirect costs of $67.5 billion (international dollars) worldwide in 2013 (119), which is about one-half the estimate given above for the U.S. alone by Carlson et al. (75).
E. Evidence Exists That Physical Inactivity Actually Causes Risk Factors, Leading to Increased Morbidity and Mortality
This section continues theme 2 by providing detailed evidence of the link between physical inactivity, epidemiological evidence, and risk of morbidity and mortality. As mentioned, Morris et al. in 1953 (342) reported the novel observation that bus conductors in London double-deck buses, who had to continually climb stair to collect fares, had ~30% less coronary heart disease, were older when the disease was diagnosed, and had a lower death rate than bus drivers who sat on the same buses. In 2010, Blair et al. (42) wrote “the research field of exercise epidemiology that was initiated by Morris nearly 60 years earlier had grown to an impressive body of physical inactivity and low cardiorespiratory fitness (CRF) are major causes for increased physiological dysfunction, morbidity, and mortality. Blair et al. (41) noted in 40,000 subjects from the Aerobics Center Longitudinal Study that low CRF is a stronger predictor of mortality than any other risk factor.
Physical exercise is not an actual causal mechanism of chronic diseases, but rather physical activity “protects” or is a therapy for diseases/conditions caused by physical inactivity (52). A 72-page review on prescribing exercise as a therapy for chronic diseases is available from Pedersen and Saltin (390). Physical inactivity, on the other hand, is one of numerous actual causes of 35 chronic diseases/conditions (55) (FIGURE 3).
FIGURE 3.
Physical inactivity increases 35 chronic diseases. See Booth et al. (55) for more details on how physical inactivity is a major cause of chronic diseases.
Many chronic diseases are polygenic, so it is not unexpected that more than a single mechanistic pathway may cause a polygenic disease. For some diseases, including six of the more prevalent chronic diseases discussed below, percent increases associated with physical inactivity range between 20 and 45%.
1. Cardiovascular diseases
Individuals performing no physical activity had 45% more cardiovascular diseases than those performing 41 MET·hr/wk (where 1 MET is the value of resting oxygen consumption).
2. T2D
Low activity groups had a 35 and 26% greater risk of T2D than in high activity groups in meta-analyses when total activity was determined in 14 cohort studies and leisure time activity was reported in a different 55 cohort studies, respectively (10).
3. Breast cancer
A 25% average increase in breast risk was present in the low physical activity groups compared with the high activity groups in the 51 studies that showed an increased risk. Case-control studies had a stronger effect (an average 30% increase) than cohort studies (a 20% increase) (310).
4. Colon cancer
The risk of proximal and distal colon cancers were increased by 27 and 26%, respectively, among the least active individuals in 21 meta-analyzed studies, as compared with the most physically active people (63).
5. Dementia
Beyboun et al. (37) noted that decreased physical activity was a strong predictor of incident Alzheimer’s disease based on an average of 27 studies that found an estimated population attributable risk percentage in dementia by physical activity to be 31.9%.
6. Depression
Meta-analysis of 25 studies (453) showed a large significant improvement of depression by exercise and that >1,000 studies with negative results would be required to reject the positive effects of exercise on depression, including larger effects for interventions in major depressive disorders. The effect size of exercise on depression is at a moderate level of 0.56 (533). Furthermore, it has been shown that exercise improves depressive symptoms to a comparable extent as pharmacotherapy and psychotherapy (48).
The CDC began categorizing physical inactivity as an actual cause of most chronic diseases only two decades ago. CDC evaluation of U.S. mortality from physical inactivity has provided varying results. Initially in 1993, McGinnis and Foege (328) published in JAMA that diet/activity pattern was an actual cause of ~300,000 deaths (or 13% of total deaths) in 1990. The CDC authors concluded “. . . the public health burden they [the major external (nongenetic) factors that contribute to death in the U.S.] impose is considerable and offers guidance for shaping health policy priorities.” Mokdad et al. (337) followed a decade later with estimates of 365,000 “actual” deaths (or 15.2%) from poor diet and physical inactivity. Another decade later, Murray et al. (345) estimated that ~230,000 (or 8.9%) of deaths were from physical inactivity and ~660,000 (or 25.4%) deaths from dietary risks occurred in the U.S. Interestingly, of the 2,596,993 deaths that occurred in the U.S. in 2013 (552), ~85% (>2,000,000) of those dying were directly or indirectly physically inactive during the majority of their lives, according to U.S. guidelines of 150 min/wk of moderate physical inactivity, or 75 min/wk of intense physical activity (505), yet physical inactivity was estimated by the CDC as responsible for only ~230,000 deaths. Thus we propose that the correct interpretation could be that physical inactivity makes at least some contribution to >2 million (or 86%) of U.S. deaths per year based on failure to reach 150 min/wk of moderate physical inactivity, or 75 min/wk of intense physical activity in ages >5 yr old.
Associations exist between physical inactivity and increased chronic disease and mortality. For example, inactive adolescents and young adults express a less healthy coronary risk profile, as compared with constantly active subjects (410). Pedersen (385) wrote, “Physical inactivity is an independent risk factor for abdominal obesity.” Manson et al. (219) noted, “both increased adiposity and reduced physical activity are significant and independent predictors of death.” Weinstein et al. (535) found, “BMI and physical inactivity are independent predictors of incident diabetes.” Blair’s group (534) stated, “Low cardiorespiratory fitness and physical inactivity are independent predictors of all-cause mortality in men with type 2 diabetes.” Later Blair’s group (286) further showed that the influence of physical inactivity on mortality is directed largely by CRF. However, physical inactivity, itself, decreases CRF (443).
Myers et al. (347) in 2004 reported that for each 1,000-kcal/wk loss decrease in physical activity, cardiovascular fitness fell one MET, and importantly, both were associated with a 20% increase in death rate. Myers et al. (347) also noted that age-adjusted mortality fell per each quartile increase in exercise capacity: hazard ratios of 1.0, 0.59, 0.46, and 0.28 for very low exercise capacity, low, moderate, and high quartiles, respectively. The same pattern existed for physical activity, but with less dramatic reductions compared with fitness: hazard ratios of 1.0, 0.63, 0.42, and 0.38 for very low physical activity, low, moderate and high quartiles, respectively. Myers et al. wrote, “. . . these two variables (aerobic fitness and physical activity quantity) were stronger predictors than established risk factors such as smoking, hypertension, obesity, and diabetes.” Warburton et al. (531) identified 254 articles with eligibility criteria for premature all-cause mortality. Women and men had ~45% average risk reductions for comparisons between high and low aerobic fitness categorizations. Furthermore, they found that high aerobic fitness also decreased mortality for seven clinical conditions: breast cancer, cardiovascular disease, colon cancer, hypertension, osteoporosis, stroke, and T2D.
Physical inactivity and poor diet are the second leading actual causes of death in the U.S. (337). The WHO report ranks physical inactivity as the fourth leading cause for global mortality, with responsibility for 6% deaths worldwide (287, 549a). Vita et al. (520) produced a metric to approximate delays with chronological aging producing chronic disease, described by Vita et al. (520) as the percentage of remaining lifespan after the onset of “cumulative disability.” A low percentage of remaining lifetime before cumulative health disabilities divided by the total lifespan would be “compression of morbidity.” Fries (167) has tested his concept with two longitudinal studies (29 and 31 yr in duration), comparing two groups: “ever runners” versus “never runners.” “Never runners” had initial cumulative disability from chronic diseases 16 yr earlier and died 3–4 yr younger, thus exhibiting low compression of morbidity, i.e., a longer percentage of life having at least one chronic disease. Fries (167) stated, “. . . the greatest effectiveness (on postponement of biological aging) may come from physical exercise, begun early, practiced hard, and continued for a lifetime.” Later, others presented an alternative terminology “healthspan,” which can be described as the percentage of life free before any chronic diseases. In summary, while physical inactivity causes hundreds of thousands of deaths, it is likely these estimates are underestimates of inactivity’s true contribution to death; however, knowing the relative contribution of individual factors is not easy to ascertain.
F. Why Extend Epidemiology to Inactivity-Induced Pathophysiology?
One simple answer is that despite all the outstanding epidemiological studies, they have not stopped the physical inactivity pandemic. The strong dogma that physical activity prevents chronic disease has not reversed the public health challenge of the physical inactivity pandemic. For example, <50 million out of 325 million in the U.S. population meet 2008 U.S. guidelines for minimal public health.
Pathophysiology is defined here as the structural and functional manifestations of a disease. One clinically significant factor is that structural changes are often irreversible. Thus, to prevent a chronic disease in the first place, i.e., primary prevention, structural changes must be prevented. Prevention of chronic physical inactivity is the primary preventer of chronic diseases. FIGURE 4 illustrates this concept.
FIGURE 4.
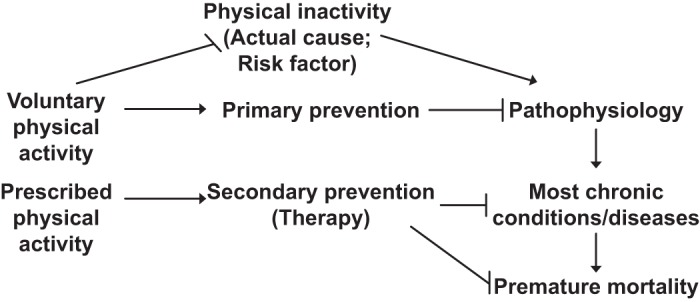
Chronic physical inactivity initiates a cascade of events. Physical inactivity is an actual cause of the numerous abnormal physiological values (physiological dysfunctions) that, in turn, cause usually permanent pathological changes (pathophysiology), which over time lead to overt diagnosed chronic diseases, that culminate as contributors to premature mortality. Two categories of physical activity are presented: voluntary physical activity, which commonly serves in primary prevention of pathophysiology, and prescribed physical activity, which is shown for common usage of secondary prevention of existing chronic disease.
As mentioned, the strong cycle of physical inactivity induces dysfunction and pathophysiology, causing at least 35 chronic diseases/conditions, which in turn results in greater levels of physical inactivity. The rapidity and severity of the response to physical inactivity is startling and is exemplified in the 1968 Dallas Bed Rest Study (443). Five healthy males underwent 20 days of continuous bed rest. The percentage declines in mean maximal physiological values for the subjects during maximal running on a treadmill were very significant for a 20-day period. V̇o2max (aerobic fitness) fell 27%. Underlying the decrease were decreases of 11% decrease in heart size, 26% decrease in maximal cardiac output, and 29% decrease in maximal stroke volume, but no significant changes in maximal heart rate or in mean arterial-venous O2 difference were noted. Taken together, the percentage size of the decrements in mass and function of the cardiopulmonary system in 20 days emphasizes the concept that the human body was built to rapidly adapt to a dysfunctional state with very short periods of physical inactivity. Remarkably, the transition from normal function for aerobic fitness in 20-yr-old, healthy men (physiological state) to low aerobic fitness for that age (physiological dysfunction) was equivalent to 30 yr of normal aging from 20 to 50 yr old. Twenty days of continuous bed rest places these individuals in a pathophysiological state leading closer to disease. These bed rest studies have been extended to present everyday living. For example, Pedersen et al. (263) had young Danish men reduce their daily step counts from 10,501 to 1,344 for a 2-wk period. A startling 6.6% decrease in V̇o2max suggests physical inactivity is a major environmental component. Unfortunately, the gene mechanisms underlying the decline in V̇o2max with aging and/or inactivity are virtually unknown. To further complicate this area of research is the fact that V̇o2max is regulated by multiple organ systems, each with unique contributions to V̇o2max.
Mechanisms of disease can be defined as defects in processes that trigger specific pathologies. Joyner and Green (230) comment that approximately half of the protective effects of physical activity are accounted for by traditional risk factors such as reductions in blood pressure and blood lipids. They suggest the missing one-half is due to the lack of knowledge to understand how the protective effects of physical activity are linked to health benefits, knowledge that is still lacking. We suggest that the missing link may be related to the concept that different molecular adaptations produce health-beneficial consequences of physical training and physical inactivity. In 2000, Booth et al. (52) proposed “the biochemical, molecular, and cellular mechanisms of physical inactivity will provide the scientific foundation for appropriate individual prescription of physical activity for health.” The topic is discussed in greater detail in Booth et al. (55).
G. General Disappointment in Gene Variants Becoming Predictive as Medicine Therapies to Prevent Chronic Diseases Caused by Physical Inactivity
This section provides the background for theme 3 regarding gene-environment evidence. Joyner and Pedersen’s review (231) notes disappointment that the promise that simple gene variances have not emerged for common diseases by suggesting “a second key example was the sequencing of the entire human genome announced in 2001 and the idea that a limited number of genetic variants would emerge and explain common diseases like cancer, hypertension, atherosclerosis, diabetes, etc.” For example, no significant genetic risk score to the incidence of total cardiovascular disease was observed for 101 single nucleotide polymorphisms in a prospective study of 19,000 initially healthy white women (383). Pedersen (392) commented that “findings such as those reported by Seshadri et al. (459) reinforce the futility of using individual genetic risk profiling for AD [Alzheimer’s disease] beyond collecting information on age, sex, family history, and APOE status.” A 2016 update by Talwar et al. (483) is, “therefore, these identified genetic markers individually or in combination have little or no clinical (predictive or diagnostic) utility in predicting AD [Alzheimer’s disease] risk.” The odds ratio for developing dementia in APOE ɛ4 non-carriers were twice as high in non-exercisers than in exercisers. However, APOE ɛ4 carriers found no difference in the odds ratio for dementia development was present between non-exercisers and exercisers (143). One conclusion in a 2013 issue of Diabetes Care for the status of genetic screening for T2D risk is summed by its statements, “however, available data to date do not yet provide convincing evidence to support use of genetic screening for the prediction of T2D . . . Genetic testing for the prediction of T2D in high risk individuals is currently of little value in clinical practice” (311). In addition, some outcomes of the Functional Single Nucleotide Polymorphisms Associated with Human Muscle Size and Strength study or FAMuSS were as follows: 1) “individual genetic variants explain a small portion of the variability in (511) muscle strength and size response to resistance training (393). 2) Genetic variants that were examined in the resistance training study only <1-12% of body composition and cardiometabolic markers in habitual physical activity levels, “suggesting these traits are highly polygenic with many loci contributing a very small proportion of the variation, and these phenotype-genotype associations were often sex specific” (393). Furthermore, in ~6,400 individuals of European descent and over 65 yr of age, no significant gene-variant associations were observed with lower body strength (325). The outcome contrasted with handgrip strength, which revealed an association with molecular targets in ~27,000 individuals >65 yr old, whose genes were of European descent (325). Taken together, the above verifies the quotation “simple genetic answers have not emerged for common diseases” (231).
Only one human gene variant has been identified that is related to physical inactivity. A gene variant in the FTO (fat mass and obesity-associated protein) gene only expresses its negative health effect of increased probability of obesity in the presence of physical inactivity. One FTO risk allele that is associated with obesity is 27% higher in physically inactive adults (243). Demerath et al. (111) stated that the FTO variant is the strongest common genetic susceptibility locus for obesity yet discovered (118, 161, 456). Thus we interpret that physical inactivity is a strong environmental stimulant of one gene variant in the FTO gene variant for obesity.
H. Polygenic Heritable Factors Regulate Sedentary Behavior
The existence of genes for sedentary behavior has indirect, strong support from 1) twin studies which identified heredity as a source of inactivity between pairs if twins (113), 2) selective breeding for the phenotype of physical inactivity in rats (423), and 3) comparisons between naturally low and high levels of voluntary running. FIGURE 5 provides an overview that evolution can be used as a foundation to speculate as to how physical inactivity could explain a genesis for observed interactions among genes, environment, and chronic diseases.
FIGURE 5.
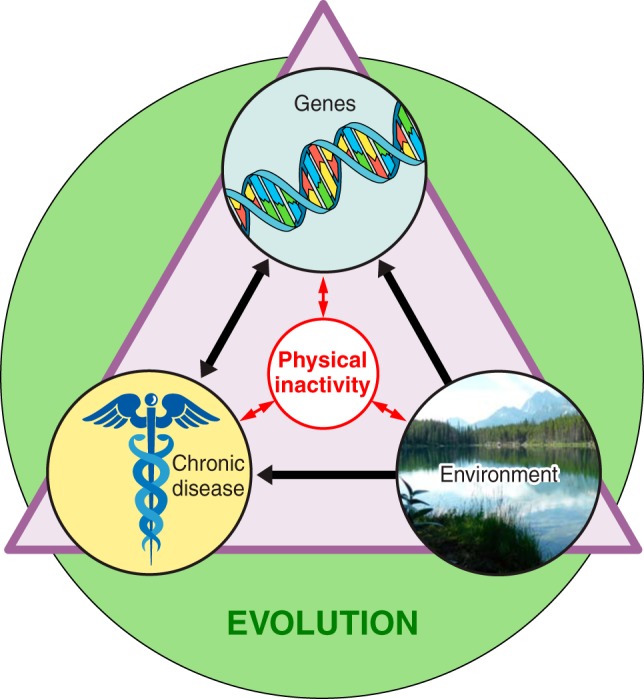
Overview of physical inactivity’s interactions. The three terms inside the triangle (chronic disease, genes, and environment) all interact directly with physical inactivity, and physical inactivity can directly influence them. The green circle indicates that evolution has and continues to play a role in shaping the interactions of all the terms inside the triangle.
1. Humans predisposed to physical inactivity
The median heritability of exercise participation was 62% in seven countries (Scandinavia, United Kingdom, and Australia) (475). Comparisons were made between 13,676 monozygotic twin pairs and 23,375 dizygotic twin pairs. Another later study of 1,654 twins (same-sex twins comprised 420 monozygotic and 352 dizygotic same-sex twin pairs) monitored by heart rate and accelerometers to time spent in moderate-to-vigorous intensity physical activity and sedentary behavior. Roos and co-workers (113) reported that sedentary behavior is moderately heritable in adults. Additive genetic factors (i.e., heritability) explained 31% of the time spent in sedentary behavior, with environmental and other factors explaining most of the remaining two-thirds. Moore-Harrison and Lightfoot (338) in their review of genomic locations associated with physical activity cite the Quebec Family Study as reporting different chromosomal linkages between human physical activity and physical inactivity.
2. Selective breeding
The question considered in the current section is as follows: Is there an evolutionary foundation for physical inactivity, and if so how much of physical inactivity was selected by evolution? One opinion to the question is from the anthropologist Lieberman (297). His contention was that limitations of the daily, caloric intake in hunter-gatherer populations drove a behavior of rest bouts during a part of the day to save calories to match calorie intake. Lieberman also contends, “selection never operated to cope with the long-term effects of chronic inactivity” (297). Thus he contends evolution never had an opportunity to develop protections against physical inactivity to producing chronic diseases.
Selective breeding can be defined as selecting one phenotype each generation to enrich genes underlying the phenotype. Our approach was modeled after two identical strategies that have provided significant insights into gene function: one by Garland (480) selectively bred mice for high distances of voluntary running distance, as compared with control mice, and another by Britton and Koch (251) from rats selectively bred for either high or low exercise capacity by forced running on motor-driven treadmills. Their publications led the Booth laboratory to selectively breed for the trait of low voluntary running by rats. The strategy was to determine if genes could be enriched to produce low behavior to voluntarily run. The selective breeding protocol uniquely produced rats with voluntary running distance behavior approaching zero for some rats (422). The founding population of females and males voluntarily ran 10.7 and 6.9 km/day, respectively. However, after nine generations of selective breeding for low voluntary running distance, females and males were running 1.4 and 1.1 km/day (422), translating to 87 and 84%, respectively, less compared with the founder population. To selectively breed for the phenotype of low voluntary running distance indicates the existence of genes to favor low voluntary running distance. While the genes, or gene variants, producing inherent physical inactivity are yet to be identified, complex transcriptomic responses direct physical inactivity. Taken together, the details above provide evidence for the role of selective breeding studies (theme 6).
Taken together, both studies provide inferential evidence that genes for physical inactivity exist and thus physical inactivity has an evolutionary basis. An enormous volume of literature exists on the artificial selection for the phenotype of high levels of voluntary running (173, 252, 298, 472). Since evidence indicates that physical activity has an evolutionary basis (31), one might ask why evolution would select the opposite, the need to be physically inactive?
3. Comparisons between mouse strains exhibiting naturally low and high levels of voluntary running
In contrast to studies of artificial breeding for voluntary running phenotypes that reveal gene identities, another type of model compares different mouse strains, which we designate as a “natural” model of voluntary running. Lightfoot and co-workers reported separate proteome signatures in the nucleus accumbens between naturally high- and low-physically active mice (145). Ferguson et al. (145) compared two strains of mice having an 8.9-fold difference in voluntary running distance. In sedentary mice of the higher voluntary running strain that were never allowed voluntary running, three proteins with metabolic functions were higher in the nucleus accumbens (creatine kinase B, succinyl-CoA ligase, and endophilin), as compared with the lowest natural running strain. The higher mouse strain voluntarily ran 10.7 km/day, as compared with the second mouse strain with a low voluntary running distance (1.2 km/day), which exhibited four different proteins (stress 70 mitochondrial protein, V-type proton ATPase catalytic subunit A, dihydropryimidinase, and transcription elongation factor A) in the nucleus accumbens of mice never exposed to running wheels. In skeletal muscle, Ferguson et al. (144) reported that transient knockdown of annexin A6 or calsequestrin 1 protein within hindlimb skeletal muscles of higher-active mouse strain was associated with reductions in voluntary running distance. They concluded that their data support a hypothesis that factors from skeletal muscle contribute to regulation of voluntary running. The finding reflects an earlier study using mice with sevenfold and threefold higher GLUT4 mRNA in hindlimb muscle and in heart, respectively (507); the GLUT4 overexpressing had a fourfold greater voluntary running distance than wild-type mice (508). The GLUT4 overexpressing mice are an early demonstration of muscles putatively “communicating” with brain regions regulating voluntary running distances.
Animal behavior is evidence for the existence of an evolutionary selection of “inactivity genes” in lower animals. Predators employ various foraging modes in nature. Two are ambush/sit-and-wait and active predation. They are considered to be the two extremes of the foraging mode spectrum (446). For example, copepods sit motionlessly in the water column to prevent detection by the prey (245), and sidewinder rattlesnakes sit and wait to ambush their prey (90). Thus some physical inactivity behaviors ca