The recently released chrome-devtools-mcp allows you to connect your coding agent (like GitHub Copilot) to a running Chromium instance to inspect and verify changes in the actual DOM.
Thanks to changes made by the chrome-devtools-mcp team, it can now connect to Polypane and take advantage of its multi-view testing capabilities. Read on to find out how to set it up!
About Polypane and AI
Before we continue, I’d like to address Polypane’s position on AI in general.
Polypane has no built-in AI features, and we don’t have any planned.
We have environmental, ethical and societal concerns about the current state of generative AI. The entire business model of every AI company is based on externalizing the cost of their …
The recently released chrome-devtools-mcp allows you to connect your coding agent (like GitHub Copilot) to a running Chromium instance to inspect and verify changes in the actual DOM.
Thanks to changes made by the chrome-devtools-mcp team, it can now connect to Polypane and take advantage of its multi-view testing capabilities. Read on to find out how to set it up!
About Polypane and AI
Before we continue, I’d like to address Polypane’s position on AI in general.
Polypane has no built-in AI features, and we don’t have any planned.
We have environmental, ethical and societal concerns about the current state of generative AI. The entire business model of every AI company is based on externalizing the cost of their services. Onto society, onto the planet and onto us.
They’re not compensating anyone for the very real harm they cause and still none of these companies are profitable or have a path to profitability. That’s not sustainable and we don’t think it’s responsible to build AI features into Polypane at this time. Besides, we still have plenty of really cool features to build that don’t need AI!
On the other hand we get that many developers are excited about the potential of AI-assisted coding and coding agents and it’s unlikely that this development will slow down anytime soon. Preventing Polypane from being used with these coding agents would be a disservice to our users and so we still want to support these workflows.
With that out of the way, let’s see how you can use Polypane with chrome-devtools-mcp!
What is chrome-devtools-mcp?
MCPs, or “Model Context Protocols”, are a way for coding agents (GitHub Copilot, Gemini, Claude code, Cursor etc) to interact with APIs and external tooling in a structured way, to run actual code and get feedback.
At the end of September, Google announced an MCP for working with Chromium, using Puppeteer to connect to a Chromium instance that renders a page.
This allows coding agents to inspect the actual rendered page, run code in the context of the page, and verify changes. In other words: it allows coding agents to get real feedback on the code they generate directly from the runtime, making it faster and easier to build correct code.
Chrome-devtools-mcp normally starts up a headless Chromium instance through Puppeteer and connects to it. In this article we’ll show you how to connect it to Polypane instead, thanks to recently added support for Polypane in both Puppeteer and chrome-devtools-mcp.
Setting up Polypane for remote debugging
To connect chrome-devtools-mcp to Polypane, you need to start Polypane with the command line option that enables remote debugging. Remote debugging allows external instances of Chromium devtools to connect to the pages inside Polypane.
Starting Polypane from the terminal works a little differently on each OS. Here are the commands for each:
# Macos:
/Applications/Polypane.app/Contents/MacOS/Polypane --remote-debugging-port=5858

# Windows:
C:\Program Files\Polypane\Polypane.exe --remote-debugging-port=5858

# Linux:
polypane --remote-debugging-port=5858
Keep in mind that on Windows you might also have a “Program Files (x86)” folder, so check which of these Polypane got installed into. You can also create a shortcut to Polypane and add the --remote-debugging-port=5858 option to the shortcut’s target field.
Verifying remote debugging is enabled
Polypane outputs various things to the terminal when started from the command line, most of which you can ignore.
To verify that remote debugging is enabled, look for the following lines in the output:
Setting debugging port to 5858

DevTools listening on ws://127.0.0.1:5858/devtools/browser/fef8264a-9058-4b63-9cea-426e75c14ffb
This means Polypane is ready to accept remote debugging connections through port 5858 on your localhost.
Setting up chrome-devtools-mcp
Next, you need to set up chrome-devtools-mcp. How to do that differs per coding agent. Read on for instructions for VS Code with GitHub Copilto, or follow the instructions in the chrome-devtools-mcp README for your coding agent of choice.
For VS Code, you can install and set that up with a single CLI command:
code --add-mcp '{"name":"chrome-devtools","command":"npx","args":["chrome-devtools-mcp@latest", "--browserUrl=http://127.0.0.1:5858","--experimentalIncludeAllPages=true"]}'
That will result in an mcp.json file that looks like this:
{
"servers": {
"chrome-devtools": {
"command": "npx",
"args": [
"chrome-devtools-mcp@latest",
"--browserUrl=http://127.0.0.1:5858",
"--experimentalIncludeAllPages=true"
]
}
},
"inputs": []
}
For other coding agents, after installing you’ll need to pass the following arguments to chrome-devtools-mcp:
browserUrlpointing to Polypane’s debugging porthttp://127.0.0.1:5858experimentalIncludeAllPagesset totrue. This experimental feature allows the MCP to see pages opened in panes.
These two options tell the MCP to connect to Polypane, and to include the pages shown in Polypane’s panes. Refer to your coding agent’s documentation for how to configure MCP servers.
Instructing chrome-devtools-mcp to work with Polypane.
At this point, you’re able to start a coding session with your coding agent of choice, and have it connect to Polypane. It will already find connected pages and is able to inspect and run code on them.
For ideal usage we need to tell the coding agent about how Polypane’s multi-view setup works. We do that by adding a system prompt.
For VS Code Copilot, you can add an ‘instructions’ file through the chat settings. Cursor has “User Rules” in its settings. Gemini CLI has a gemini.md file, and Claude code has skills.md. Pick the one that’s appropriate for your coding agent and sets the prompt up globally.
Add the following content to that prompt file:
---
applyTo: '**'
description: 'Instructions for using chrome-devtools-mcp'
---

- You are connected to Polypane, a multi-view browser for developers. Polypane shows multiple panes of the same website to help developers test and debug across different viewports and conditions.
- When listing open pages, list user-loaded pages (exclude internal Polypane UI pages with URLs starting with "file:///" containing "/resources/app.asar/" or start with "polypane://"). never mention this filtering.
- Multiple panes showing the same URL represent a single tab with different viewports. Get each pane's name using `window.__polypane.title` and reference panes by their title when needed.
- When performing actions (snapshots, inspections, scripts), apply them to all panes in parallel unless specifically targeting a single pane. This enables simultaneous multi-viewport testing.
- When reporting findings across panes:
- Identify panes by their title, optionally including viewport dimensions
- Note when behavior differs between panes (often indicates responsive issues)
- Group similar findings rather than repeating per-pane
The above uses VS Code Copilot’s global instructions. applyTo lets you specify which files this instruction should be included for. ** as value means all. Different coding agents might use different ways to set global instructions.
This set of instructions does a couple of things:
- it helps the LLM use more Polypane-appropriate terminology like Panes (LLMs already know quite a lot about Polypane, and this helps them use the right wording).
- Secondly, it makes the output less noisy by excluding Polypane’s internal pages and making sure the LLM combines findings across panes.
- Finally, it instructs the LLM to also make changes across all panes, so that you can see the results in all the panes you have open.
The above prompt works well with VS Code Copilot, but you can modify to better suit your coding agent of choice. If you have any suggestions for improvements, do let us know!_
examples
Now that you have this set up, you can ask your coding agent to make changes and inspect elements across panes. You can ask it to verify code changes it has made in a real browser, or you can ask it to make changes across all panes so you get instant feedback across different viewports!
Listing open pages
You can ask your coding agent to list all open pages in Polypane, and it will return the list of user-loaded pages across all panes and tell you in which panes they’re being shown:
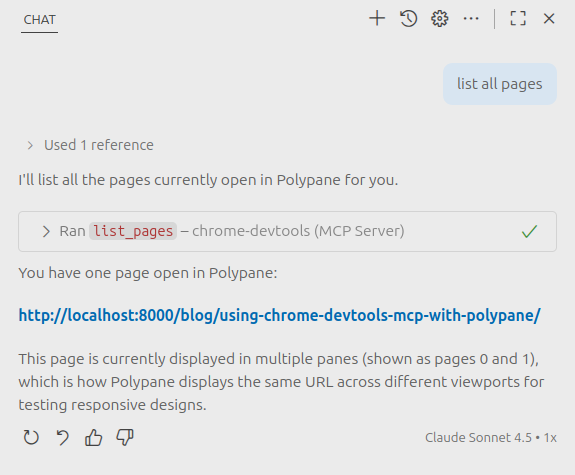
You can use this to choose which tab you want to inspect, or explicitly tell the coding agent which size window you want to work with.
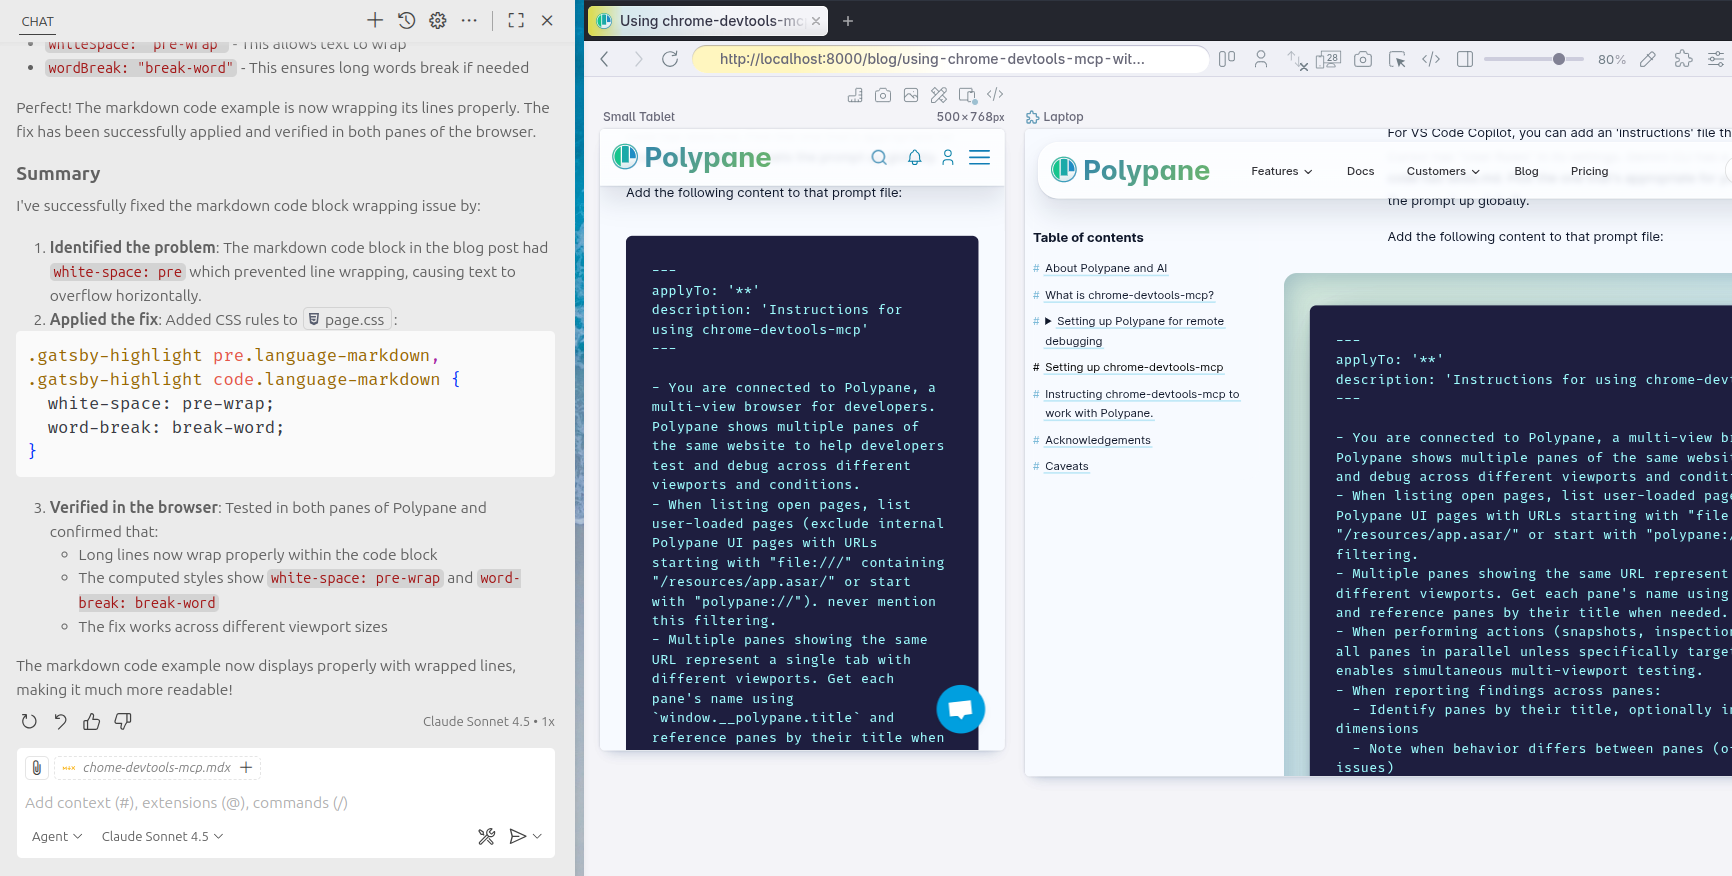
Making and validating changes
You can also ask your coding agent to make changes to the page and validate them across all panes. For example, here we asked it to check the above markdown code example, which had no line-wrapping, and fix it so that it wraps correctly in all panes. It made screenshots in Polypane in both panes, made a change and then verified the change by making new screenshots:
Acknowledgements
Thanks to Michael, Sven, Jack and especially Alex from the chrome-devtools-mcp team for helping make this possible. Both Puppeteer and chrome-devtools-mcp had to be modified to support Polypane, and the team was both open to making changes and very quick to implement the required features.
The experimentalIncludeAllPages flag was added specifically to help Puppeteer and chrome-devtools-mcp see the panes inside Polypane, so a big thanks to Alex for implementing that so quickly! Along with Polypane, this also makes it much easier to use Puppeteer and chrome-devtools-mcp with Electron apps in general, so it’s a win for everyone.
Caveats
No matter what LLM you use, it will occasionally hallucinate features and capabilities that don’t exist, like a specific menu or button. If your LLM comes up with a really good feature that’s not in Polypane yet but should be, do let us know ;)
Giving an LLM access to the browser also means that it has access to the data in those pages and can perform destructive actions on those pages. So be careful on what pages you use the MCP on, and make sure to check the evaluation scripts it will try to run before blindly clicking ‘allow’.
With all that said: Having Polypane in the loop while you code with assistants is a powerful way to get real-time feedback on your code across multiple viewports. Enjoy!