October 30, 2025
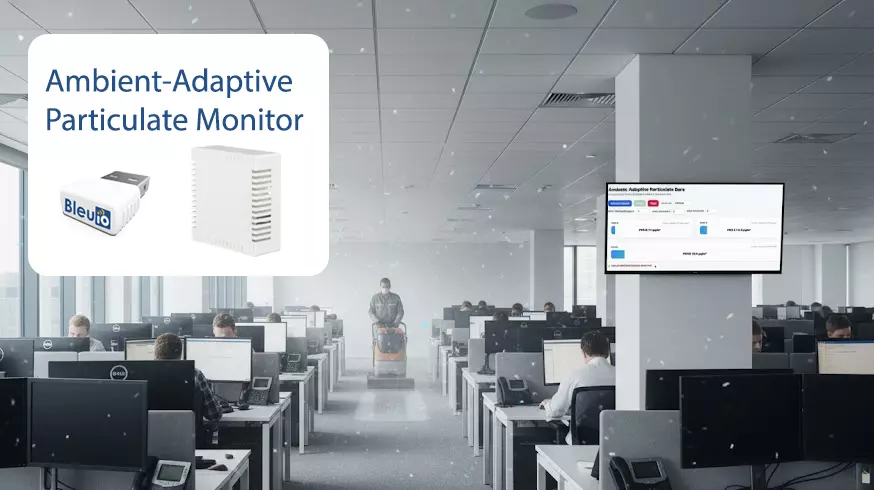
Outdoor air quality is a major focus in Europe in 2025, with tighter standards placing greater emphasis on fine particulate matter—especially PM2.5. Elevated PM levels are linked to asthma, reduced cognitive performance, and increased cardiovascular risk, making reliable monitoring essential. This project demonstrates a simple, browser-based way to visualize PM1.0, PM2.5, and PM10 in real time—supporting better ventilation decisions and aligning with evolving EU air-quality exp…
October 30, 2025
Outdoor air quality is a major focus in Europe in 2025, with tighter standards placing greater emphasis on fine particulate matter—especially PM2.5. Elevated PM levels are linked to asthma, reduced cognitive performance, and increased cardiovascular risk, making reliable monitoring essential. This project demonstrates a simple, browser-based way to visualize PM1.0, PM2.5, and PM10 in real time—supporting better ventilation decisions and aligning with evolving EU air-quality expectations.
What you’ll build
A single HTML file styled with Tailwind CSS that:
- Puts BleuIO in a central scanning role
- Periodically runs a targeted scan for your HibouAir Board ID
- Decodes PM1.0 / PM2.5 / PM10 from the manufacturer data inside BLE advertisements
- Maps the values to three horizontal bars (default display windows: PM1.0/PM2.5 → 0–150 µg/m³, PM10 → 0–200 µg/m³)
- Shows a high particulate banner when any value exceeds your thresholds
Source code: [https://github\.com/smart-sensor-devices-ab/pm-monitor-bleuio](https://github.com/smart-sensor-devices-ab/pm-monitor-bleuio)
Live demo: [https://smart-sensor-devices-ab\.github\.io/pm-monitor-bleuio/](https://smart-sensor-devices-ab.github.io/pm-monitor-bleuio/)
Hardware & software
How it works
HibouAir broadcast short advertisement packets that includes real-time air quality data. We can read them without pairing.
Scan cadence. The dongle sends:
AT+CENTRALonce to enter scanning modeAT+FINDSCANDATA=<BOARD_ID>=3every cycle to run a 3-second targeted scan- It reads lines until BleuIO prints **
SCAN COMPLETE**
**
In the video , the session starts at 0.0 µg/m³ across PM1.0/PM2.5/PM10. To demonstrate responsiveness, we briefly spray aerosol near the HibouAir device. Within seconds, the bars respond and the page displays “High particulate levels detected.” After stopping the aerosol and allowing air to clear, values decay back down, the bars recede, and the banner disappears. This sequence illustrates typical behavior you’ll see during quick particulate events (e.g., cleaning sprays, dust disturbances, smoke from cooking) and their recovery.
This project turns HibouAir’s BLE adverts into a clear view of PM1.0, PM2.5, and PM10 using a BleuIO dongle. In minutes, you get live bars, thresholds, and a simple alert that makes particulate spikes obvious. It’s easy to tune—adjust display windows, tweak thresholds, and adapt the layout for different rooms. As EU air-quality expectations tighten, this lightweight monitor helps you spot issues and validate ventilation quickly. From here, you can add data export, multi-device dashboards, or pair it with your CO2 monitor for a fuller picture.
**
**
**Follow us on LinkedIn : **
BleuIO
$24.99
Get a FREE BleuIO for every 10 pcs ordered.
BleuIO Pro
$35.00
Get a FREE BleuIO for every 10 pcs ordered.
**