Chrome’s JavaScript debugger lets you step through your code line by line and see the value of different variables.
In this article we’ll take a look at how you can debug JavaScript with Chrome DevTools and look at some advanced breakpoint functionality.
How to open the debugger and set a breakpoint
You can find the JavaScript debugger in the Sources tab of Chrome DevTools. Right-click the page and select Inspect to open the developer tools.
Then switch to the Sources tab and open the navigator sidebar. Here you can open the JavaScript file you want to debug and view its content.
Once the code is displayed you …
Chrome’s JavaScript debugger lets you step through your code line by line and see the value of different variables.
In this article we’ll take a look at how you can debug JavaScript with Chrome DevTools and look at some advanced breakpoint functionality.
How to open the debugger and set a breakpoint
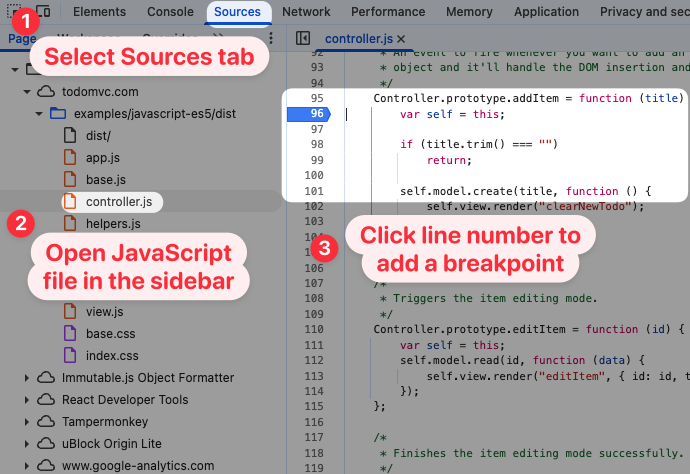
You can find the JavaScript debugger in the Sources tab of Chrome DevTools. Right-click the page and select Inspect to open the developer tools.
Then switch to the Sources tab and open the navigator sidebar. Here you can open the JavaScript file you want to debug and view its content.
Once the code is displayed you can click on any line number to place a breakpoint. When Chrome runs the code on that line the debugger will pause code execution to let you take a closer look at what’s happening.
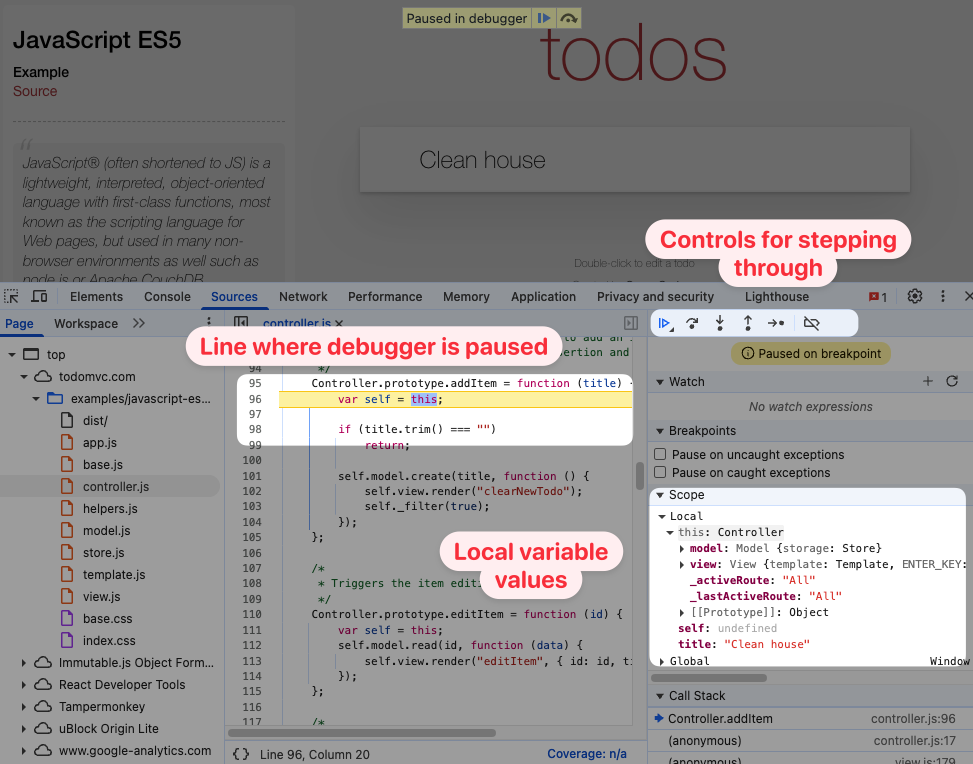
In my case the code runs when adding a todo item in the JavaScript TodoMVC app. After doing that, Chrome marks the page as “Paused in debugger” and shows the line where it is paused in DevTools.
On the right you can see local variable values under Local Scope and the list of function calls leading up to this line of code under Call Stack. For example, I submitted a new todo item with the title "Clean house".
Pausing execution with the debugger statement
Instead of setting a breakpoint in the DevTools UI you can also add a debugger statement in your code editor.
Controller.prototype.addItem = function (title) { debugger; /* ... */};
This also makes it easy to set a breakpoint when running code in the browser console. For example, if you want to inspect UI elements that disappear after a few seconds you can run this little snippet and prevent any changes to the page.
setTimeout(() => { debugger;}, 5000);
Stepping through code
Once execution is paused you can go step through code line by line to see how data changes, or step into specific function calls to debug them in more detail.
The following options are available for stepping through code in DevTools:
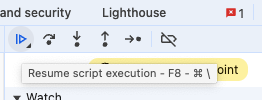
- Resume code execution: continue running code until the next time a breakpoint is hit
- Step over next function call: run code on the current line and pause again after it and all function calls have completed
- Step into next function call: run next bit of code and enter the code of any function call
- Step out of current function call: run until the end of this function and pause in the invoking code after it has returned
- Step: same as step over, but waits for asynchronous code to complete and then pauses again
This video shows some of the DevTools stepping commands in action:
What’s the difference between step and step over?
For synchronous code stepping over any function calls and just stepping is the same. However, for asynchronous code they behave differently.
debugger;const userInfo = await fetch("/api/me");console.log(userInfo);
In this example, if we step over the fetch API call the current JavaScript task will end and no code runs until the API request is complete. However, we won’t pause again as there’s no breakpoint set.
In contrast, if you use the “step” button it will pause again after the API call is complete.
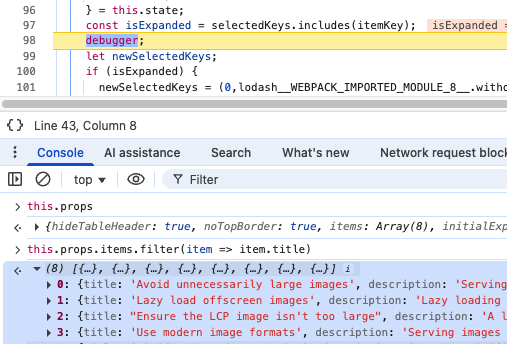
Accessing values in the console
After pausing execution you can use the DevTools console to run code in the current context, including being able to access local variables.
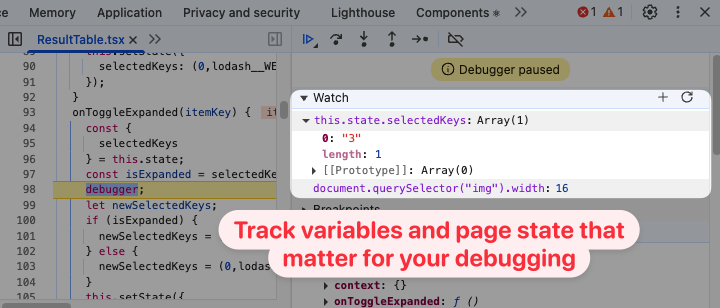
Observing values with the Watch pane
If you don’t want to manually run a console command to view the state you’re looking for you can also use the Watch pane on the right of the Chrome debugger.
Enter any JavaScript statement and Chrome will display the resulting value after pausing.
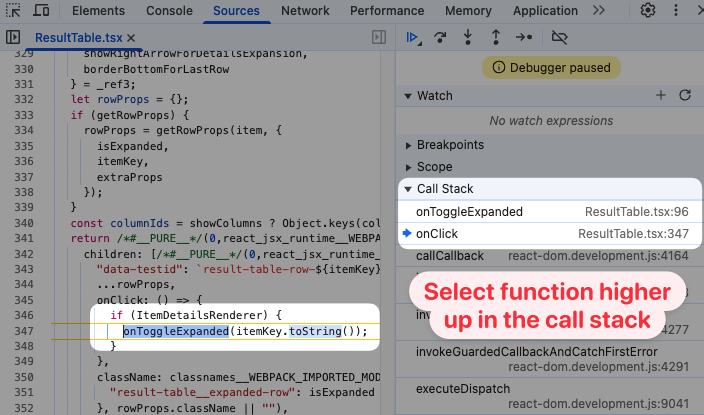
Navigating through the call stack
The call stack shows the function calls that lead up to where in the code you’re currently paused. You can select call frames higher up to view what code called the function you’re paused in, as well as inspecting the local variable state in that part of the code.
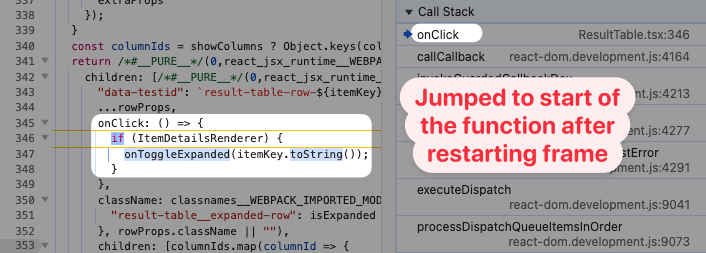
Restart frame
The ability to restart frames is one great feature of Chrome’s JavaScript debugger. After stepping through code you can run it again if you missed a value you should have checked out or want to modify state before running the code again.
Right-click the call frame and select Restart Frame from the menu.

After restarting the frame you’ll be paused at the start of the function you selected. This can also be a function higher up in the frame, if you’re wondering why the code you’re debugging was called with the arguments it was called with.
Advanced breakpoints types
Sometimes you don’t know yet where in the code you need to pause to debug issues. There are some handy Chrome DevTools features that can solve this problem, as well as some techniques enabled by JavaScript itself.
DOM breakpoints
DOM breakpoints allow you to pause code execution when page content is modified by JavaScript on the page. You can pause on subtree modifications, attribute modifications, and node removal.
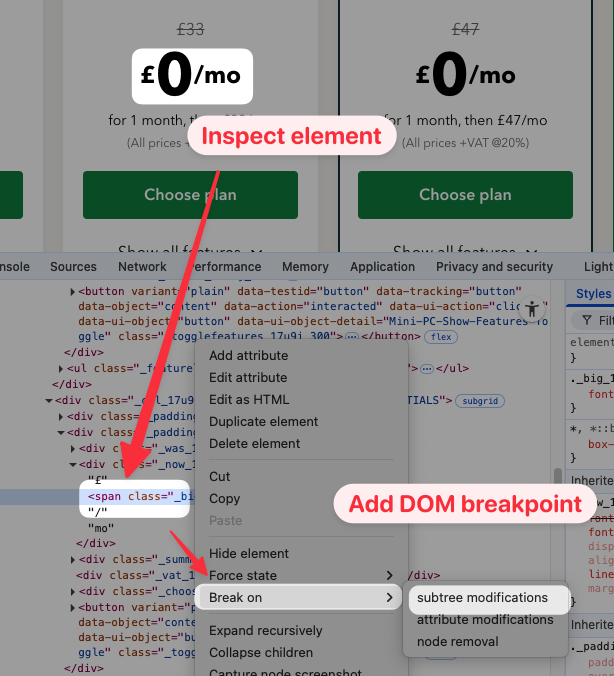
For example, here I’m toggling the monthly/annual toggle on the QuickBooks pricing page. I want to know what code is responsible for that page update.
After inspecting the element that changes I can right-click it in the DevTools Elements tab and select Break on subtree modifications. I know the text content changes, so that’s why I want to break on subtree modifications. If you see an HTML attribute change then you’d want to pause on attribute modifications.
Now, when clicking the toggle button on the page, DevTools pauses execution when the content of a text node is updated.
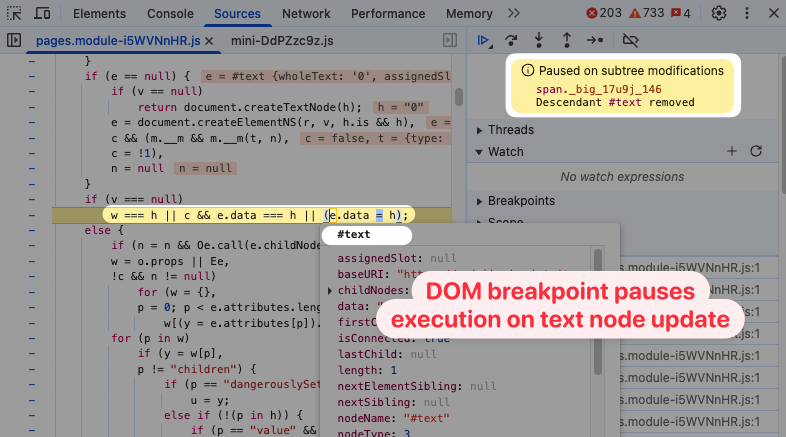
A lot of the time this code will be deep in framework or library logic, so it’s usually a good idea to have a look up the call stack.
After doing that we can find the React application source code for the charge frequency toggle.

Break on caught and uncaught exceptions
If your code is throwing error the Pause on uncaught exceptions and Pause on caught exceptions options are useful to inspect the state of your page and variables when the exception is thrown.
In this example the page is trying to parse an empty string as a URL, resulting in an Invalid URL error.

tip
It’s common for pages to throw exception and then catch them, even when there’s no big error on the page.
In that case it can be helpful to load your page first and then enable pausing on caught exceptions and replicate the interaction that causes the error.
Pause on function calls
JavaScript makes it easy to edit existing objects. Together with the debugger statement this enables a number of debugging scenarios!
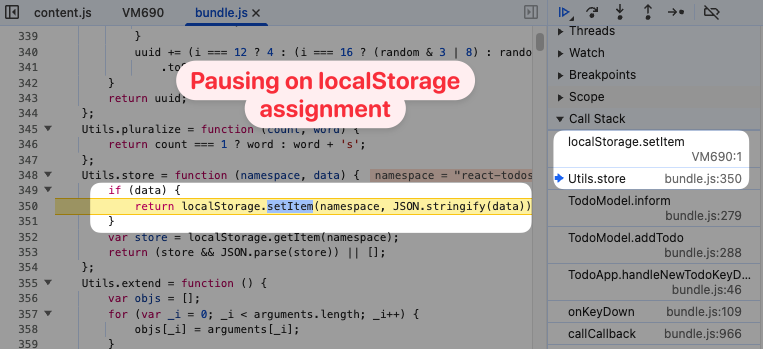
For example, what if you want to know where in the code a localStorage value is set? You can simply overwrite the setItem function:
localStorage.setItem = function () { debugger;};
Now when the value is written the debugger pauses. We need to go up one level in the call stack to find the application source code that’s causing the update.
We’ve broken the setItem method along the way. We can make sure it keeps working by calling through to the original function like this:
const setItem = localStorage.setItem;localStorage.setItem = function () { debugger; return setItem.apply(this, arguments);};
Pause on object property updates
Pausing when a property is assigned is a bit trickier, as you’ll need to create a getter and setter on the object you’re trying to debug.
For example, what if you want to see what code on the page is assigning the scrollTop property? You can overwrite the property like this:
const originalDescriptor = Object.getOwnPropertyDescriptor( Element.prototype, "scrollTop");Object.defineProperty(Element.prototype, "scrollTop", { set: function () { debugger; return originalDescriptor.set.apply(this, arguments); }, get: function () { return originalDescriptor.get.apply(this, arguments); }, writeable: true,});
Now when code on the page updates the scrollTop property on an element we can pause execution.

Here’s another real-world use case I ran into. A customer reported that no real user monitoring data was coming through on their website. Our script was throwing an error on their website due to a missing property on the window.navigation property.
With the script below I was able to identify a script in Google Tag Manager that was overwriting the native window.navigation property with a var assignment.
const nav = window.navigation;Object.defineProperty(window, "navigation", { set: function () { debugger; }, get: function () { return nav; },});
Tips for searching through website code in DevTools
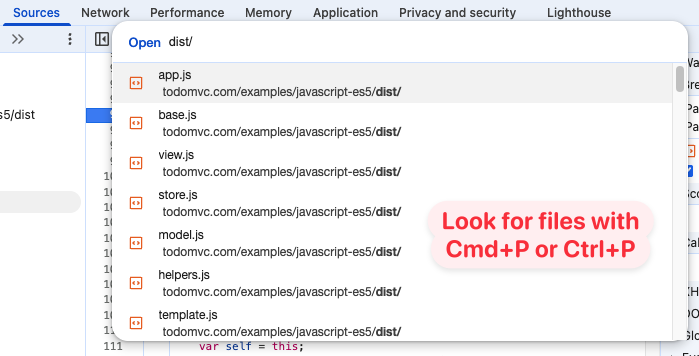
The DevTools Sources tab offers a few features that can make it easier to work with code on your website. For example, you can open a searchable list of files using CMD + P on Mac or Ctrl + P on Windows.
You can also run a full-text search on code. Click the three dots in the top right of DevTools and select Search to open the Search pane.

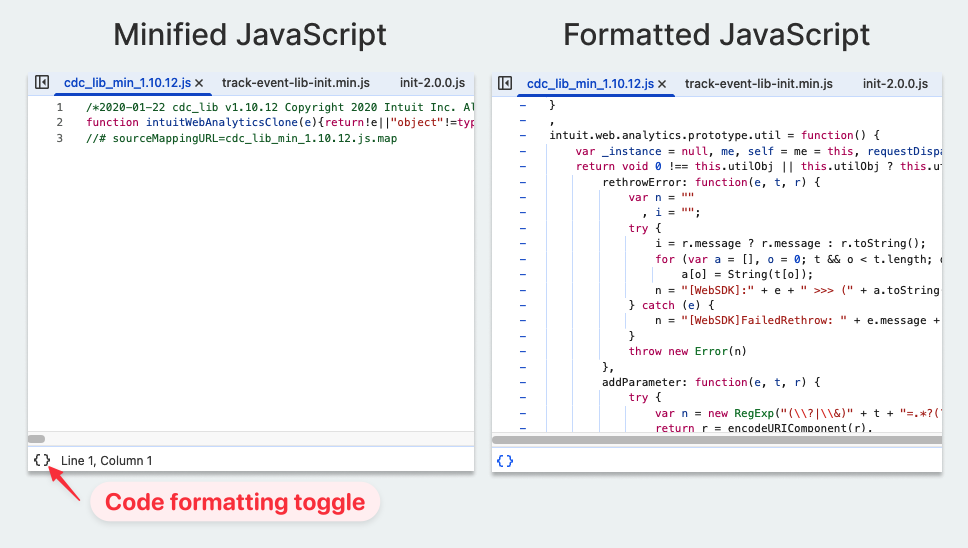
When working with minified code you’ll ideally provide source maps to be able to set breakpoints in and step through the original files.
However, when that’s not possible, Chrome provides a Pretty Print toggle in the bottom left corner of the source file view.