October 31, 2025
Can Tariffs Spur Higher Factory Floor Utilization?
Robin Braun, Ryan Decker, and Fariha Kamal
Raising America’s industrial output is a key goal of the recent increases in U.S. import tariffs. Domestic output could rise if positive effects of reduced foreign competition outweigh negative effects of increased policy uncertainty and complexity, higher costs of imported inputs, and retaliatory trade policy in export markets. Higher output via the opening of new factories could take considerable time to materialize, but an immediate possibility is that output can rise through higher utilizat…
October 31, 2025
Can Tariffs Spur Higher Factory Floor Utilization?
Robin Braun, Ryan Decker, and Fariha Kamal
Raising America’s industrial output is a key goal of the recent increases in U.S. import tariffs. Domestic output could rise if positive effects of reduced foreign competition outweigh negative effects of increased policy uncertainty and complexity, higher costs of imported inputs, and retaliatory trade policy in export markets. Higher output via the opening of new factories could take considerable time to materialize, but an immediate possibility is that output can rise through higher utilization of existing factories’ production capacity.
In this note, we examine how industries’ spare capacity—as of late 2024, just before tariffs rose—correlates with industries’ measured increase in tariff protection from foreign competition. We document considerable spare capacity for the manufacturing sector as a whole (figure 1, left panel). However, looking across industries, we find only a small positive correlation between pre-tariff spare capacity and new import protection, suggesting that aggregate spare capacity is not particularly driven by those industries gaining the most tariff support. A counterfactual exercise indicates that increased production in industries with both high spare capacity and high new import protection from the 2025 tariffs could modestly boost aggregate manufacturing output.
Figure 1. Capacity utilization has been subdued
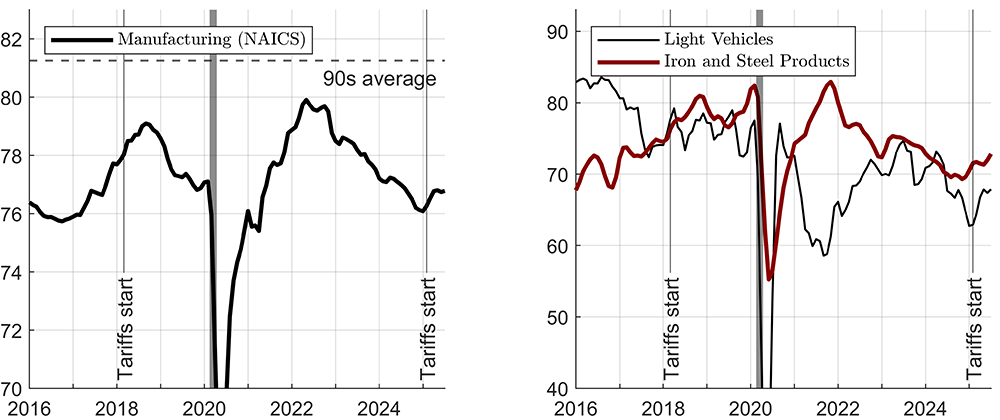
Note: Percent of capacity, 3-month moving averages. The gray shaded bars indicate periods of business recession as defined by the National Bureau of Economic Research: February 2020—April 2020.
Source: Industrial Production and Capacity Utilization (Federal Reserve Board). Both light vehicles and iron and steel products are measured using physical product data (vehicles and tons, respectively).
That said, looking at 2025 so far, we find no correlation between utilization trends and new import protection. This lack of correlation could reflect the effects of policy uncertainty, tariffs on inputs, or export retaliation. But we also show that businesses in industries receiving more new import protection have tended to mention soft demand and insufficient labor supply as factors holding down utilization. Moreover, with tariff policy changes still recent, we provide limited, though suggestive, evidence that the relationship between recent utilization growth and new import protection may depend on industries’ time intensity, that is, average period of production. We conclude by considering some key limitations of our narrowly focused exercises.
As shown on figure 1 (left panel), capacity utilization in manufacturing averaged around 77 percent during 2024, prior to this year’s tariff increases; even with a recent uptick, the series is still below its post-pandemic peak of 80 percent and well below its 1990s average of just over 81 percent.1 The difference between recent utilization and historical rates may be thought of as a measure of “spare capacity.” The manufacturing sector overall does have considerable spare capacity at present.
For example, utilization in light vehicle manufacturing—shown in black on the right panel—entered 2025 at a rate well below historical highs. And indeed, this year some automakers have already raised domestic assemblies of some models at existing plants, such as Chevrolet’s Silverado plant in Indiana, in response to changing trade policy (Hall 2025). This may occur more widely as foreign-assembled vehicles become more expensive or disappear from the domestic market entirely.2 If automaker utilization were to increase from its 2024 average to its 1990s average, annual light vehicle production would increase by roughly 1.7 million units, or more than 15 percent.3
Another industry with subdued but growing utilization is iron and steel products, shown in red. With utilization still well below its pre-pandemic peak, domestic iron and steel output could rise substantially even with no new factories. Higher steel utilization has been cited as one key objective of the 2025 tariffs (The White House 2025). And this industry has gained considerable new protection this year, with tariff rates on steel—including steel embedded in derivative products—increasing by 50 percentage points in 2025. But tariff rates alone are not sufficient for measuring the amount of new protection enjoyed by an industry; meaningful protection arises not only from higher tariffs but also from ample opportunity to replace domestic purchases of foreign-produced goods with domestically produced goods.
Measuring exposure to new import protection
We follow Flaaen and Pierce (2024) in measuring “new import protection” as the change in tariff rates for comparable products sourced from abroad scaled by the import share of domestic purchases:
$$$$\mathrm{New\ import\ protection}_i=\frac{\sum_{pc\in\Omega^I}{\Delta\tau_{ipc}\ imp_{ipc}}}{Q_i+imp_i\ -\ \ exp_i},$$$$
where $$Q_i$$, $$exp_i$$, $$imp_i$$ measure total shipments, exports, and imports of industry $$i$$, respectively, in 2022.4 The denominator, $$Q_i+imp_i-{exp}_i$$, is commonly referred to as “domestic absorption” as it measures total domestic purchases of the industry’s goods. $$\Omega^I$$ is the list of U.S. imported product-country pairs ($$pc$$) newly subject to the 2025 tariff changes ($$\Delta\tau_{ipc}$$) effective as of August 27, 2025, measured in percentage points. We construct these measures at the level of industry detail available in the capacity utilization data, which leaves us with 52 manufacturing industries (most of them available at 4-digit NAICS level).
This measure of new import protection is an indicator of the scope for domestic production in an industry to replace imports. In particular, all else equal, new import protection is higher for those industries seeing larger tariff increases. But new import protection is also increasing in the share of domestic absorption that is accounted for by imports. An industry in which imports are negligible will gain minimal import protection even from very high tariff rates, as domestic purchases are already largely supplied by domestic production.5 That is, variation in import protection arises from variation in both tariff rates and the share of domestic purchases supplied by imports.
Table 1 displays the top 10 manufacturing industries in terms of new import protection from the 2025 tariffs. Perhaps unsurprisingly, the list includes alumina and aluminum production and processing (NAICS 3313) and iron and steel products (NAICS 3311,2), for which imported products face tariff rate increases of 50 percentage points under Section 232 tariffs. Notably, though, the aluminum industry has much higher import protection than iron and steel because aluminum features a higher share of imports in domestic purchases and, therefore, has gained more scope for substitution toward domestic production. Other industries that enjoy significantly increased import protection are household appliance manufacturing (NAICS 3352) and a series of industries where the import share of domestic purchases is above 90 percent (leather and allied products, computer and peripheral equipment, and apparel).
Table 1: Top 10 industries by new import protection
| Industry | NAICS | New import protection | Import share of domestic purchases | Leather and Allied Product Manufacturing | Alumina and Aluminum Production and Processing | Apparel Manufacturing | Household Appliance Manufacturing | Other Miscellaneous Manufacturing | Computer and Peripheral Equipment Manufacturing | Textile Product Mills | Iron, Steel, Ferralloy/Cutlery, Handtool | Nonferrous Metal Production and Processing | Agriculture, Construction, and Mining Machinery Manufacturing |
|---|---|---|---|---|---|---|---|---|---|---|---|---|---|
| 316 | 0.21 | 0.96 | |||||||||||
| 3313 | 0.21 | 0.37 | |||||||||||
| 315 | 0.2 | 0.94 | |||||||||||
| 3352 | 0.2 | 0.66 | |||||||||||
| 3399 | 0.2 | 0.73 | |||||||||||
| 3341 | 0.17 | 0.99 | |||||||||||
| 314 | 0.16 | 0.57 | |||||||||||
| 3311,2 | 0.12 | 0.25 | |||||||||||
| 3314 | 0.12 | 0.78 | |||||||||||
| 3331 | 0.11 | 0.36 |
Do industries gaining import protection have spare capacity?
We next compare industry-level import protection and spare capacity. We must first construct measures of spare capacity; we consider two alternative approaches. First, we define spare capacity as an industry’s 2024:Q4 average utilization rate compared to its peak rate observed over the last ten years (2014:Q4-2024:Q4). This is our preferred measure. Additionally, we compare the industry’s 2024:Q4 average to the average rate recorded in the 1990s (1990:Q1-1999:Q4), a historical episode of generally high utilization rates. In both alternatives, we simply subtract utilization in 2024:Q4 from the respective historical average.6
Figure 2 plots spare capacity (vertical axes) against new import protection (horizontal axes), with spare capacity measured relative to the last 10 years on the left panel and the 1990s on the right panel. The size of the dots indicates the value-added weight within manufacturing. The figure shows fairly wide distributions of both spare capacity and new import protection across industries. The results are similar, though not identical, across the two measures of spare capacity; for the rest of the note, we will focus on the comparison to the recent 10-year peak.7
Figure 2. Spare capacity and import protection
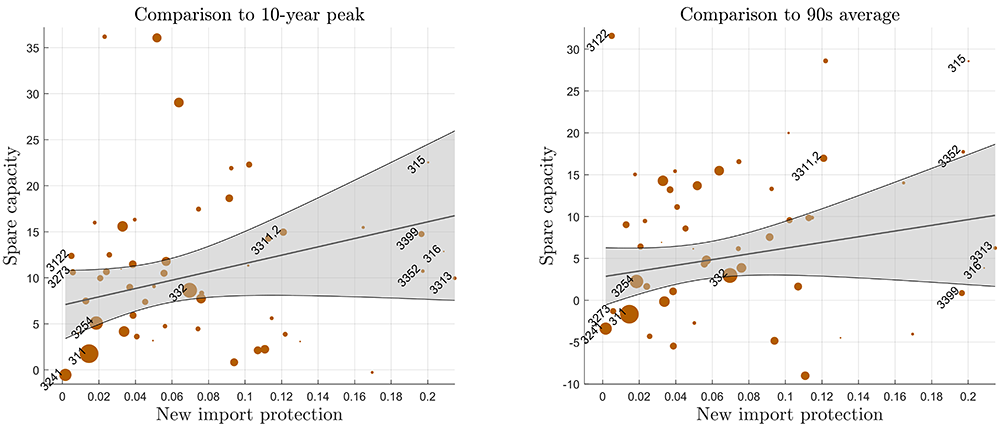
Note: Y axes report percent of capacity. Regression lines reflect regressions of industry spare capacity on new import protection, weighted by industry value added as measured in industrial production data.
Source: Industrial Production and Capacity Utilization (Federal Reserve Board); Census of Manufacturers and USA Trade Online (U.S. Census Bureau); and author calculations.
We observe limited spare capacity (around 5 percent or less) in notable industries like food (NAICS 311), petroleum and coal products (NAICS 3241), and basic chemicals (NAICS 3254); some such industries are often referred to as “continuous processors,” as they tend to operate at relatively high utilization rates, and their utilization has not fallen significantly over time. On the other hand, large upside potential (around 10 percent or more) can be seen for tobacco (NAICS 3122), apparel (NAICS 315), iron and steel (NAICS 3311,2), and household appliances (NAICS 3352).
As shown by the (weighted) regression lines on figure 2, the relationship between spare capacity and import protection is positive, though it is not statistically significant. That is, there may be a modestly positive, but fairly limited, relationship between import protection and spare capacity, indicating that the spare capacity in manufacturing as a whole is not particularly driven by industries gaining the most new import protection. In unreported exercises, we find similar results when defining spare capacity literally, that is, relative to 100 percent utilization.
The positive slope observed on figure 2 is consistent with new tariffs yielding some modest upside potential for aggregate output through higher utilization of existing factories.8 Indeed, some industries with large new import protection from the 2025 tariffs have significant room for utilizing existing capacity. For example, industries with at least 10 percent spare capacity and above-median new import protection account for roughly 15 percent of manufacturing value added. In concrete (if highly approximate) terms, if each of these industries were to eliminate half of their spare capacity through higher output in existing plants, aggregate manufacturing production would rise by roughly 1-1/2 percent. This suggests modest, though nontrivial, upside potential. By comparison, manufacturing production fell by 0.3 percent and 0.4 percent in 2023 and 2024, respectively, on a Q4-to-Q4 basis. Whether these industries will actually raise output has yet to be seen, though, and will depend in part on demand conditions and availability of inputs, as we discuss below.
Importantly, we have made no attempt at causal inference in these exercises, nor should our calculations be treated as a forecast for manufacturing production. Rather, the descriptive analysis simply characterizes the joint distribution of spare capacity—as we have defined it—and import protection.
Have newly tariff-protected industries raised their utilization rates?
Until now, we have studied capacity utilization as of 2024:Q4, just before the 2025 tariff increases began. But capacity utilization for the manufacturing sector has increased by about one percentage point during 2025 through August (figure 1, left panel). How much of that increase, if any, is plausibly related to higher import protection from the newly imposed tariffs? Figure 3 plots the change in capacity utilization, January through August of 2025 (vertical axis), against our measure of new import protection (horizontal axis).
Figure 3. Recent utilization growth and new import protection
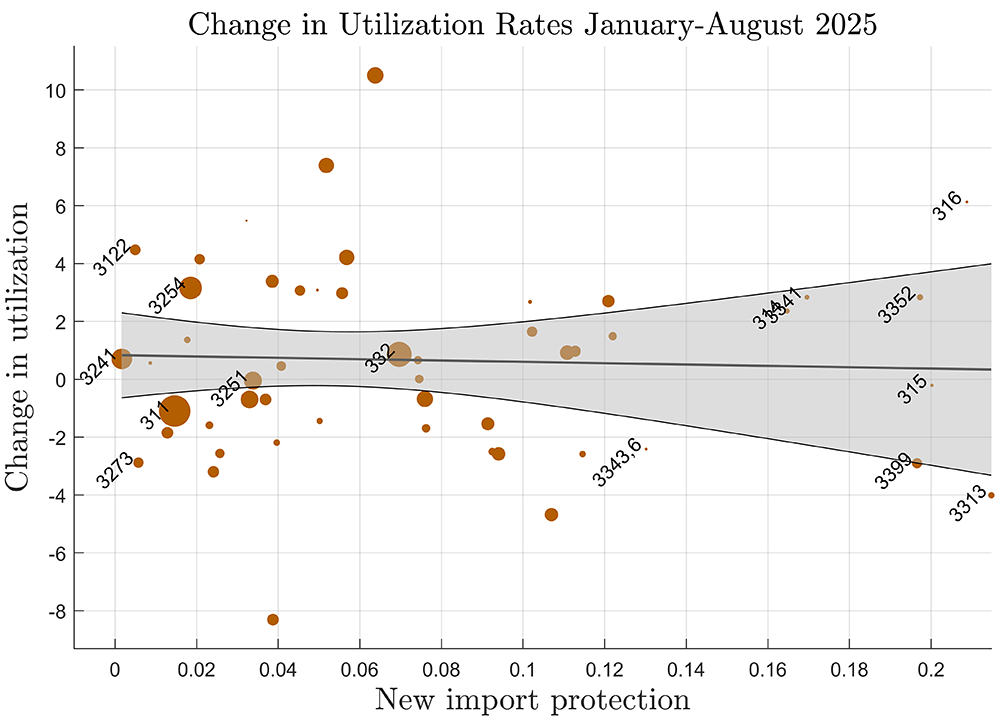
Note: Y axis reports the change in capacity utilization in percentage points. Regression line reflects regression of industry change in utilization on new import protection, weighted by industry value added as measured in industrial production data.
Source: Industrial Production and Capacity Utilization (Federal Reserve Board); Census of Manufacturers and USA Trade Online (U.S. Census Bureau); and author calculations.
As of August, there is no relationship between increases in utilization and new import protection. The results are similar when measuring industries’ 2025 utilization relative to their 2024 trend (not shown). Aggregate utilization may have risen for reasons unrelated to increased import protection, even while some industries might have a plausible tariff story. Again, though, we emphasize the descriptive nature of our exercises, which make no attempt at causal identification; for example, it could be that tariffs have prevented a lower path of utilization in newly protected industries.
Input supply and capacity utilization
Capacity is defined on an assumption of full availability of inputs, so utilization can be affected by input availability. The Census Bureau’s Quarterly Survey of Plant Capacity Utilization asks manufacturers for reasons they are operating below capacity. Figure 4 reports three such reasons on the vertical axes: insufficient orders—a measure of demand (left panel), insufficient labor (middle), and insufficient materials (right). We plot the share of respondents reporting each of these reasons during 2025:Q1 – 2025:Q2, on average, against our import protection measure.
Figure 4. Reasons for operating below capacity versus new import protection
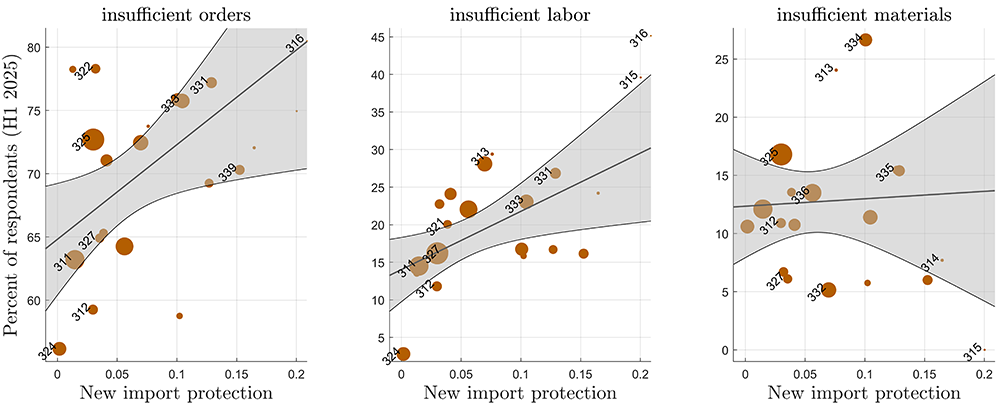
Note: Regression lines reflect regressions of survey respondent percentages (indicated by figure titles) on new import protection, weighted by industry value added as measured in industrial production data.
Source: Source: Industrial Production and Capacity Utilization (Federal Reserve Board); Census of Manufacturers, Quarterly Survey of Plant Capacity Utilization, and USA Trade Online (U.S. Census Bureau); and author calculations.
Interestingly, we observe a positive, statistically significant relationship between import protection and insufficient orders (left panel); that is, those industries receiving the most new import protection appear to be experiencing the weakest demand conditions, which may help explain why their utilization has not risen by more (figure 3). This may suggest that tariffs have had limited effects on demand for domestic products so far; indeed, in unreported exercises, we find no correlation between new import protection and the change in insufficient order complaints from 2024 to 2025.
We also observe a positive relationship between import protection and insufficient labor (middle panel). If insufficient labor supply is a barrier to higher capacity utilization, trade policy may have limited positive effects on output: labor force growth has slowed considerably since early this year, and such low growth may persist.9 Reports of insufficient materials (right panel) appear largely uncorrelated with import protection.
Too early to tell? The average period of production
For a variety of reasons, it may be too early to assess the role of tariffs in recent utilization data. For example, tariff policy has gradually changed through the course of 2025, with both country-specific and product-specific tariff rates being subject to adjustment; many producers may be waiting to fully respond to changing trade policy until those policies are perceived as being more settled.
Another consideration is that production takes time—that is, there is some lag between the initial collection of inputs and the shipment of final products, with measured capacity utilization occurring somewhere in between. Production and utilization in plants involved in processes that are especially time intensive may react slowly to tariffs simply because production at any given time is related to decisions made some time earlier.
We do not have direct measures of the time-intensity of production. But Antràs and Tubdenov (2025) derive industry-level “average period of production” (APP) estimates by relating inventory stocks with input expenditures.10 We adopt their APP measure to explore whether the relationship between 2025 utilization changes and new import protection varies by industries’ time-intensity of production.
Figure 5 plots changes in utilization during 2025 so far against new import protection, separated by low-APP industries (left panel) and high-APP industries (right panel). In neither case is the relationship between recent utilization growth and new import protection statistically significant, but the signs of the slopes may be worth noting: among low-APP industries, whose products can be produced quickly, we observe utilization growth that is increasing in new import protection, as we might expect. Among high-APP industries (right panel), we observe a negative relationship. We should not overinterpret these statistically insignificant results, but they might suggest that utilization will respond more to recent policies with lags.
Figure 5. Utilization growth and import protection by average production period
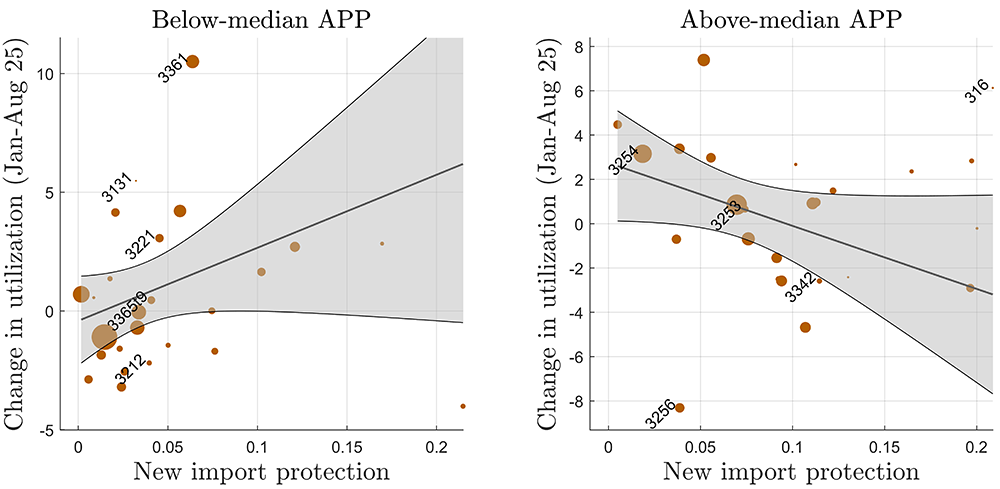
Note: Y axes report change in capacity utilization in percentage points. APP is “average production period” from Antràs and Tubdenov (2025). Across all industries, the APP has a mean of 81 days and a median of 74 days. Regression lines reflect regressions of industry change in utilization on new import protection, weighted by industry value added as measured in industrial production data.
Source: Industrial Production and Capacity Utilization (Federal Reserve Board); Census of Manufacturers and USA Trade Online (U.S. Census Bureau); Antràs and Tubdenov (2025); and author calculations.
Early observations
We have described manufacturing industries in terms of their new import protection and excess capacity with the aim of considering which industries may stand to significantly increase production—and with aggregate implications—in the face of recent trade policy developments. We find suggestive evidence of modest upside potential from industries with both spare capacity and increased import protection, and we find no evidence that capacity utilization in these industries has responded to tariffs so far this year. We show that higher rates of utilization may depend in part on both strong demand for goods in protected industries and ample availability of labor. The time horizon in which tariffs affect utilization may also depend on industries’ production processes, warranting caution in interpreting the data too early.
Importantly, we have focused on scope for higher production through the intensive margin of output: capacity utilization. The extensive margin—growth through new plants—is also important, albeit with more of a lag. And recent changes in tax policy have reduced the cost of new plant creation by, among other provisions, allowing for full depreciation of new factories (Watson 2025). But potential for growth through the extensive margin is much harder to assess.11
A more comprehensive analysis of the potential effects of trade policy on the manufacturing sector is beyond the scope of this short note. For example, Flaaen and Pierce (2024) found that in the face of 2018 tariff increases, other channels—especially increased costs of imported inputs—appear to have outweighed the positive effects of import protection, at least for manufacturing employment and potentially for manufacturing output. Indeed, our figure 1 shows that in the 2018 trade policy episode, while capacity utilization continued to rise for a time after tariff increases began—consistent with its pre-2018 trend—utilization turned down the following year (as did both production and employment in manufacturing, not shown).
Like the 2018 episode, the trade policy changes of 2025 also feature tariffs on basic manufacturing inputs—most notably metals, which are significant inputs to many manufacturing industries, especially in durable goods. Raising utilization may be costly in the face of more expensive material inputs. Headwinds from foreign retaliation may be fairly muted in the current episode, though trade policy uncertainty appears to be elevated and may dampen output growth, and the new tariff actions impose significant new policy compliance costs (see, e.g., Bowdle and Kamal 2025). Finally, our results show labor supply constraints are already holding down utilization in industries gaining new tariff protection during 2025. Future production growth may depend on those industries’ ability to attract labor from other industries or the broader labor market in a time when overall labor force growth may be slow.
References
Antràs, Pol and Vitalii Tubdenov (2025), “Measuring the average period of production,” AEA Papers and Proceedings 115:624-630.
Bansak, Cynthia, Norman Morin, and Martha Starr (2004), “Technology, capital spending, and capacity utilization,” Economic Inquiry 45 no. 3:631-645.
Bowdle, Spencer, and Fariha Kamal (2025), “Trade compliance at what cost? Lessons from USMCA automotive trade,” FEDS Notes, Washington: Board of Governors of the Federal Reserve System, July 18, (accessed September 30, 2025).
Coglianese, John, Seth Murray, and Christopher J. Nekarda (2025), “Harmonized population and labor force statistics,” Finance and Economics Discussion Series 2025-057, Washington: Board of Governors of the Federal Reserve System, (accessed September 30, 2025).
Congressional Budget Office (2025), “CBO’s current view of the economy from 2025 to 2028,” September, (accessed September 26, 2025).
Flaaen, Aaron and Justin Pierce (2024), “Disentangling the effects of the 2018-2019 tariffs on a globally connected U.S. manufacturing sector,” *The Review of Economics and Statistics, *(accessed September 26, 2025).
Hall, Kalea (2025), “GM to increase truck production in Indiana following Trump’s tariffs,” Reuters, April 3, at https://www.reuters.com/business/autos-transportation/gm-increase-us-truck-production-following-trumps-tariffs-2025-04-03/ (accessed September 24, 2025).
O’Trakoun, John (2025), “Auto industry has little wiggle room to navigate tariff hikes,” Federal Reserve Bank of Richmond Macro Minute, April 8, (accessed September 29, 2025).
Pierce, Justin and Emily Wisniewski (2018), “Some characteristics of the decline in manufacturing capacity utilization,” FEDS Notes, Washington: Board of Governors of the Federal Reserve System, March 1, (accessed September 30, 2025).
Watson, Garrett (2025), “One Big Beautiful Bill Act’s corporate tax changes benefit US manufacturing the most,” Tax Foundation, September 4, (accessed September 26, 2025). ,
The White House (2025), “Adjusting imports of steel into the United States,” February 10, (accessed September 24, 2025).
1. Capacity utilization is measured by the Federal Reserve Board as part of the G.17 release on Industrial Production and Capacity Utilization. Capacity is constructed to estimate an industry’s maximum sustainable rate of output given full availability of inputs (including labor). Utilization is calculated by dividing an industry’s output (as measured in the industrial production index) by its capacity. For technical details, see https://www.federalreserve.gov/releases/g17/Meth/MethCap.htm. In this note we focus on manufacturing as defined by NAICS industry codes, though the G.17 publishes a broader manufacturing aggregate including some additional industries. Return to text
2. Increasing domestic output of model platforms currently produced domestically—as in the Chevrolet Silverado example—is relatively easy. Using domestic factories to initiate production of models or parts previously only produced elsewhere requires more extensive retooling, imposing a limit on how much domestic utilization can rise in the short term, as noted by O’Trakoun (2025). Return to text
3. U.S. light vehicle production was 10.2 million units during 2024, with an average capacity utilization rate of 69 percent. This implies about 14.8 million units of capacity during that year on average. Utilization averaged 80 percent from 1990 through 1999, which implies 11.9 million units of production under 2024 capacity. Return to text
4. We measure shipments, exports, and imports in 2022. While trade data are available with only a two-month lag, the latest available year of information on shipments by detailed industry at the time of this analysis is 2022; the ratio we employ is likely to change little from year to year. Return to text
5. Of course, this measure of import protection also features limitations; for example, by aggregating to the industry level, we abstract from within-industry heterogeneity that may render domestic production a poor substitute for foreign goods, in which case our measure of import protection is overstated. Return to text
6. Since capacity utilization is defined as output relative to total sustainable capacity, a more literal way to define spare capacity would be to simply take the inverse of capacity utilization, under the assumption that 100 percent utilization is an appropriate characterization of total possible output (rather than referencing some past high utilization rate). We verify that the results we describe in this section are broadly robust to that more literal interpretation of capacity utilization and spare capacity. But in practice, industries rarely, if ever, reach 100 percent utilization; for example, productive inputs may not always be easily available to producers, and capacity is defined assuming full input availability. Return to text
7. Capacity utilization overall has trended down over time for reasons not fully understood (see, e.g., Bansak, Morin, and Starr 2004, Pierce and Wisniewski 2018). Given this secular trend we are hesitant to treat the 1990s as the appropriate benchmark for spare capacity and instead focus on a more recent benchmark. Return to text
8. Our use of weighted regression is important here; for example, a few industries have both an enormous amount of import protection and significant spare capacity, such as apparel (NAICS 315). But the industries appearing in the upper-right quadrant of the scatterplots tend to be very small, that is, they contribute little to aggregate manufacturing value added (as indicated by their small dots on the chart). It is possible for these industries to see dramatic output growth without significantly boosting aggregate manufacturing output. Return to text
9. The size of the civilian labor force is reported in the Bureau of Labor Statistics’ Current Population Survey. Care must be taken to account for changes in population controls at the beginning of the year. Coglianese and others (2025) provide harmonized time series of labor force variables; in their series, 12-month growth of the civilian labor force age 16 and up has slowed from about 1-1/2 percent in January 2024 to about 1 percent in January 2025 and roughly zero percent as of August 2025. For the outlook for population and labor force growth see, for example, Congressional Budget Office (2025). Return to text
10. Antràs and Tubdenov (2025) derive the theoretical underpinnings of this APP measure, which amounts to the ratio of inventories to cost of goods sold. In addition to the assumptions underlying their theory, another limitation is that they rely on data for publicly traded firms, though they find some corroboration in the NBER-CES manufacturing database covering the entire manufacturing sector. We take the industry-level APP estimates from Antràs and Tubdenov (2025) and aggregate them to the level of our industry codes using 2022 Economic Census sales weights. Return to text
11. In unreported exercises, we compare rising import protection to each industry’s historical rate of new plant creation (using the U.S. Census Bureau’s Business Dynamics Statistics). A positive relationship might suggest that industries with high propensity for plant entry are receiving new import protection, consistent with upside potential for manufacturing output. On the other hand, though, a negative relationship could appear if foreign competition has historically restrained plant entry in key industries that are now gaining tariff protection, which may allow for higher entry and production than historical norms going forward. Thus, the implications of this exercise are ambiguous. In any case, we find no statistically significant relationship between new import protection and various measures of industry plant entry rates. If factory construction does pick up it will be apparent in data on construction value put in place and, even earlier, in building starts, though it is likely still too early to see tariff effects in such data. Return to text
Please cite this note as:
Braun, Robin, Ryan Decker, and Fariha Kamal (2025). “Can tariffs spur higher factory floor utilization?,” FEDS Notes. Washington: Board of Governors of the Federal Reserve System, October 31, 2025, https://doi.org/10.17016/2380-7172.3943.
Disclaimer: FEDS Notes are articles in which Board staff offer their own views and present analysis on a range of topics in economics and finance. These articles are shorter and less technically oriented than FEDS Working Papers and IFDP papers.