November 03, 2025
Order Flow Imbalances and Amplification of Price Movements: Evidence from U.S. Treasury Markets
Dobrislav Dobrev, Edith Liu, Joon Kim, and Marius Rodriguez*
This note provides a novel view on market functioning and argues for the importance of monitoring large directional order flow in understanding notable price moves during periods when liquidity is severely strained. Market turbulence often creates a liquidity mismatch: as volatility increases, liquidity demand surges while supply evaporates. This phenomenon, supported by both theory and empirical evidence…
November 03, 2025
Order Flow Imbalances and Amplification of Price Movements: Evidence from U.S. Treasury Markets
Dobrislav Dobrev, Edith Liu, Joon Kim, and Marius Rodriguez*
This note provides a novel view on market functioning and argues for the importance of monitoring large directional order flow in understanding notable price moves during periods when liquidity is severely strained. Market turbulence often creates a liquidity mismatch: as volatility increases, liquidity demand surges while supply evaporates. This phenomenon, supported by both theory and empirical evidence, occurs because rising price volatility prompts market makers to reduce their risk exposures just as other investors seek to trade in an effort to rebalance their portfolios.1 Moreover, the greater likelihood of same directional trading on specific news exerts extra pressure on the demand for liquidity. For market participants and policy makers alike, monitoring order flow imbalances can thus serve as an extra tool to assess whether liquidity demand is outstripping supply, potentially amplifying price volatility.
To ground these insights in recent events, we analyze the Treasury market turbulence of early April 2025, amid rapid news flow around announced reciprocal tariffs. Significant price volatility was observed across all segments of the Treasury market, which were further amplified by poor liquidity conditions. We specifically examine two event windows on April 7th and April 9th, which featured comparable reductions in liquidity supply but markedly different magnitudes of liquidity demand on the buy versus sell side and associated order flow imbalance.
Our analysis also exploits the value of intraday market data from the largest and most liquid electronic trading platforms for benchmark (on-the-run) Treasury securities and Treasury futures contracts. These platforms are known to exhibit larger trading volumes when investors seek to quickly adjust risk exposures in response to news surprises, particularly during episodes of elevated macro-financial uncertainty when liquidity tends to be poorer.2 We are thus able to highlight how a sudden surge in one-sided liquidity demand that outpaces liquidity supply can exacerbate price pressures and volatility even on these most liquid trading platforms.
Background: The Treasury Market Turbulence of April 2025
Financial markets experienced significant price volatility following the April 2nd announcement of reciprocal tariffs, as investors rapidly reassessed the potential implications for the relationship between risk and return on global financial assets. On the morning of Monday, April 7th, a rumored tariff pause and its swift rebuttal within minutes triggered significant intraday volatility in US Treasury yields and precipitated a sharp decline in liquidity across US Treasury cash and futures markets. Severely challenged market liquidity conditions persisted throughout the following two trading days amid intense speculation of waning demand for US Treasury securities, and as investors anxiously awaited the outcome of the 10-year Treasury auction scheduled for 1pm on Wednesday April 9th. Shortly thereafter,** **following an announced 90-day pause on most reciprocal tariffs and a solid performance in the 10-year Treasury auction, conditions in US Treasury markets started to recover.
To put the observed levels of market liquidity and volatility into historical context, figure 1 plots the relationship between daily realized volatility and market depth for the 10-year Treasury note during early April 2025, represented by black dots, as compared with other episodes of elevated market stress and the much-improved market conditions in September 2025.3 Evaluating realized volatility against market depth on April 7th and April 9th reveals that volatility on both days was unusually high, even after controlling for the low levels of market depth.
Figure 1. Volatility and Market Depth (10-Year Treasury Note)
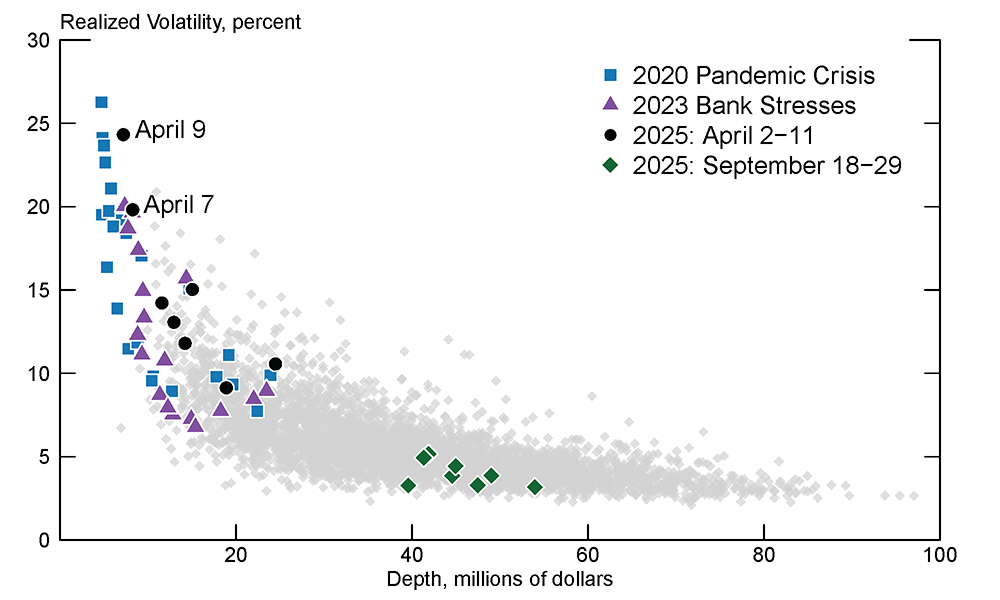
Note: Data shown for business days, January 4, 2010 to September 29, 2025. Pandemic Crisis period is from February 27, 2020 to April 1, 2020. Bank Stresses period is from March 8, 2023 to April 1, 2023.
Source: Repo Inter Dealer Broker community and authors’ calculations.
Given the exceptional liquidity event observed on both April 7th and 9th, we will zoom in on these two days to understand how liquidity may have played a role in amplifying price volatility in Treasury markets. In particular, we focus our analysis on trade volumes and imbalances to understand the incremental role played by liquidity supply and demand factors. As we will show below, while the overall trading volumes and deterioration in market liquidity conditions on April 7th and 9th were comparable, the net asset demand and associated intraday order flow imbalances differed significantly across the two days and help explain differences in observed price movements.
New Insights: Intraday Trading Volumes, Buy-Sell Imbalances and Price Pressures
Despite severely strained market liquidity on April 7th and 9th, many investors sought to rebalance investment positions, as is typically the case in response to news arrival and heightened price volatility. This rebalancing led to a notable surge in trading volumes across both US Treasury cash and futures markets.4 To illustrate the magnitude of trading volumes, figure 2 depicts movements in the 10-year nominal Treasury yield (in red) alongside 5-minute trading volumes for the 10-year Treasury note (in blue) and 10-year Treasury futures contract (in gray) from March 31, 2025 to April 16, 2025 during the main US trading hours from 7 am to 5 pm ET.
Figure 2. Treasury Yields and Trading Volume, March 31, 2025 – April 16, 2025 (10-Year Treasury Note and 10-Year Treasury Futures)
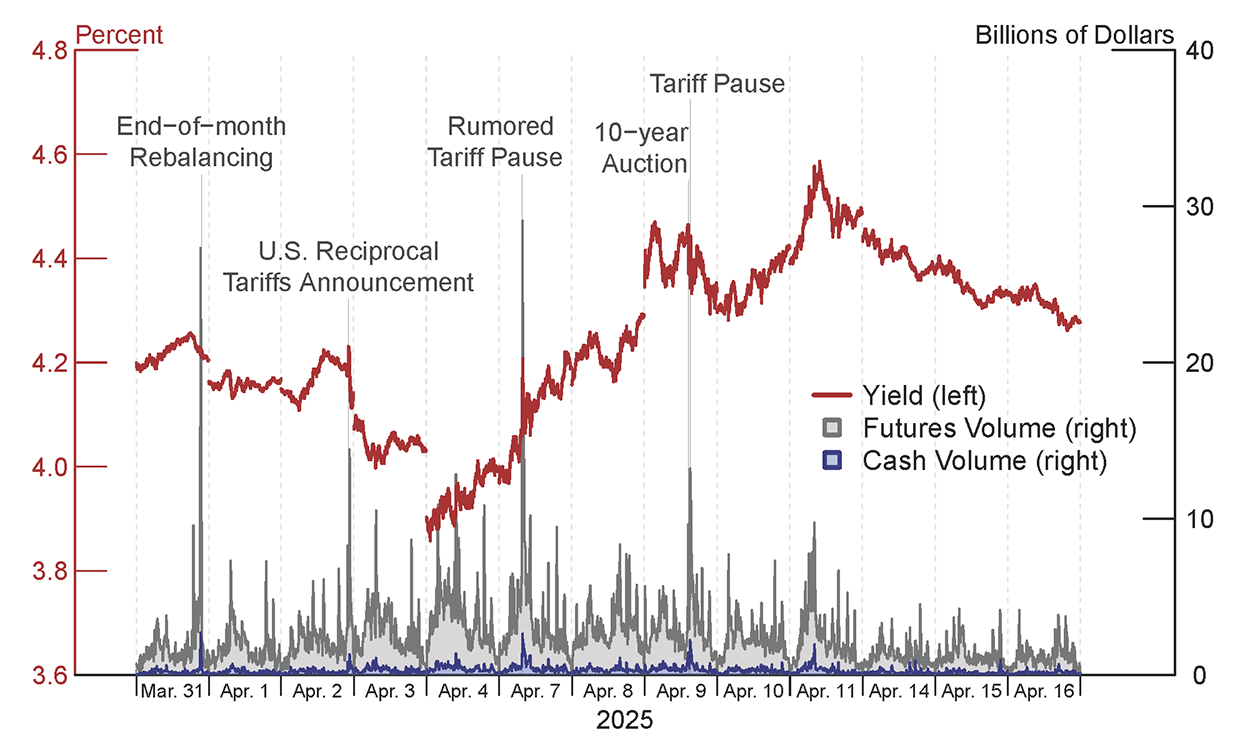
Note: Data shown for business days, 7:00 AM to 5:00 PM. Volumes are aggregated at 5-minute intervals; yields at 5-second intervals. Tariff pause refers to the announcement of the 90-day pause on reciprocal tariffs in excess of 10 percent on most countries. Key identities in order from top to bottom.
Source: Bloomberg, Repo Inter Dealer Broker community, LSEG, and Datascope Tick History.
First, we note a notable intraday volume spike towards the end of the trading day on March 31, associated with typical month-end and quarter-end portfolio rebalancing.5 Due to normal market liquidity conditions on that day, this short-lived volume surge did not trigger a large instantaneous yield move, as liquidity supply was able to meet elevated trading demand. In contrast, a similar volume surge observed on April 7th was accompanied with a much larger price move, amid significantly low market depth and challenged liquidity conditions.
While the aggregate daily volumes in figure 2 show significant elevation on April 7th, the relative increase during different parts of the day is masked by intraday patterns in trading activity.6 Specifically, another large intraday volume spike on April 9th, following the 10-year Treasury auction and the announced official tariff pause around 1:20 pm, also stands out as quite sizeable for that time of the day. Overall, intraday trading volumes on these electronic trading platforms were notably larger for the 10-year Treasury futures contract than the 10-year Treasury note both in nominal terms (shown on figure 2) and risk-adjusted terms (not shown).7 Therefore, we proceed with analyzing more closely the surge in intraday trading volumes and directional order flows for the 10-year Treasury futures contract during these two comparable event windows on April 7th and April 9th.
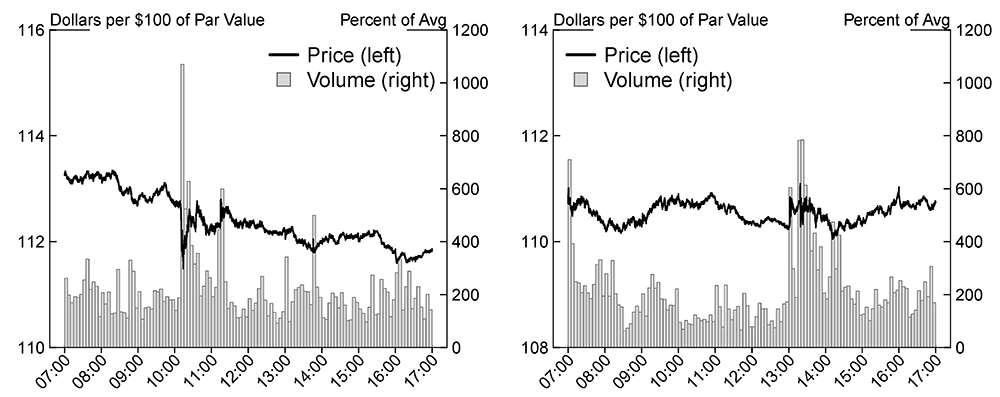
Figure 3 plots the surges in intraday trading volumes expressed as percentages of prior month average volumes for the same time of the day against the corresponding price movements during each of these two event windows. This comparison shows that the intraday volume spikes for the 10-year Treasury futures around both 10:10-10:20 am on April 7th and 1:20-1:30 pm on April 9th were nearly tenfold relative to prior-month averages for the same time intervals, similar to the spike in intraday trading volumes observed during the 2014 flash rally in Treasury markets.8 In addition, figure 3 also shows that comparable large jumps in intraday trading volumes were observed on both April 7th and 9th, but the price movements around the spike on April 9th were significantly smaller than those on April 7th. It therefore appears that the spike in trading volumes, while significant, was not the only force at play.
Figure 3. Intraday Price and Volume on April 7, 2025 (Left) and April 9, 2025 (Right) for 10-Year Treasury Futures
One potential explanation for the large observed price moves on April 7th, which were not present on April 9th, could be that the heightened intraday volume was simultaneously accompanied by a large directional order flow that contributed to additional price pressure arising from significant order flow imbalance.9 Intuitively, when market depth is low and liquidity is fragile, large order flow imbalances have greater potential to amplify price moves as intermediation capacity is likely to be limited.10 Moreover, the amplification of price moves due to order flow imbalance can be interpreted as the ex-post realizations of inherent liquidity risk and market fragility, which during times of slow recovery in market liquidity conditions can further exacerbate price volatility.
To investigate this potential amplification channel, figure 4 depicts the cumulative trading imbalance – defined as the difference between buyer-initiated and seller-initiated trading volume – throughout the same two event windows on April 7th and April 9th. As shown in the left panel of figure 4, shortly after 10:10 am on April 7th, the cumulative trading imbalance surged to over $2 billion in sell pressure, which gradually dissipated over the subsequent 10 minutes as speculation of a pause on the reciprocal tariffs was officially denied. The large unidirectional increase in cumulative trading imbalance amid low market depth was comparable in size (but opposite in direction) to that observed during the 2014 flash rally and therefore likely contributed to the notable price action on April 7th.
Figure 4. Intraday Price and Trading Imbalance around the Tariff News Surprises on April 7, 2025 (Left) and April 9, 2025 (Right) for 10-Year Treasury Futures
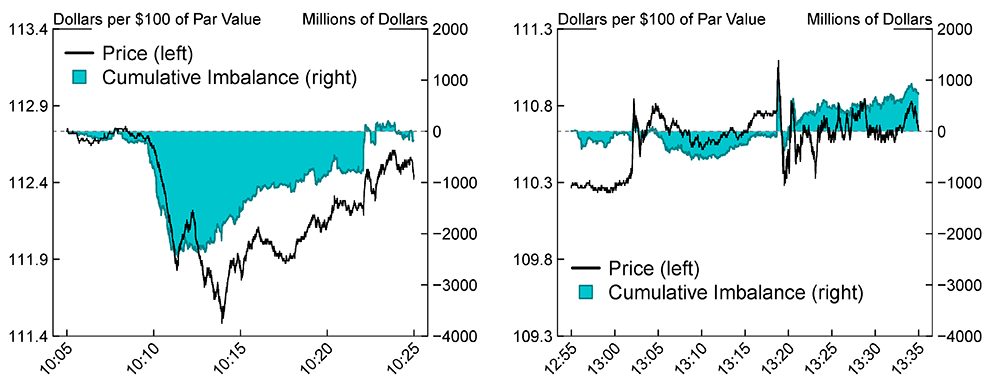
By contrast, the trading imbalance observed shortly after 1:20 pm on April 9th (in the right panel of figure 4) following the official tariff pause announcement differed markedly in both magnitude and persistence. During the April 9th event, the imbalance fluctuated bidirectionally, with short-lived spikes not exceeding $1 billion. This stands in stark contrast to the larger, more sustained, and unidirectional surge in cumulative trading imbalance and price action witnessed during the April 7th event window. Consequently, one could infer that surging trading imbalance amid low market depth has likely played a crucial role for the markedly larger price fluctuations following the tariff news surprise on April 7th relative to April 9th.11 More generally, the longer it takes for market liquidity to recover following a large decline, the greater the risk of observing spikes in trading imbalances that can amplify market volatility.12 This inherent vulnerability underscores the importance of close monitoring of market liquidity and various efforts under way to enhance Treasury market resilience.13
Summary and Conclusion
In this note, we highlight how episodes of large directional order flow amid reduced liquidity supply can exacerbate price pressures and volatility in US Treasury markets. Particularly in an environment with rapid news flow, intraday price fluctuations can reflect changes in fundamental beliefs of investors, but can also exhibit amplification effects in cases when substantial intraday trading volumes and buy-sell imbalances coincide with low market depth and fragile liquidity conditions. Moreover, to disentangle these effects, we show it is necessary to look beyond daily volumes and price changes, and examine high frequency intraday measures of liquidity demand and supply along with order flow imbalance.
Focusing on the Treasury market turbulence of early April 2025, we examine intraday trading imbalance and associated price moves for two event windows on April 7th and April 9th, 2025 featuring similar fast moving news on tariffs and comparable reductions in liquidity supply but different magnitudes of liquidity demand on the buy versus sell side. This comparison shows that despite similar speed of news flow and surges in trading volumes, the notably different trading imbalances resulted in price fluctuations of markedly different magnitudes. We thus document how a sudden surge in order flow imbalance can exacerbate price pressures and volatility, amid challenged market liquidity conditions that can at times plague even the largest and most highly liquid trading platforms in Treasury markets. More generally, our findings complement and extend prior evidence suggesting that elevated trading volumes in the same direction can amplify volatility, particularly during periods of reduced liquidity supply.14
Our analysis shows the value of tracking the intraday evolution of both liquidity demand and supply, along with order flow imbalance. We find that doing so can enhance the surveillance of Treasury market functioning and valuations. It also provides a more complete view on the potential amplification of price volatility due to low market liquidity during episodes of market stress or following significant news shocks. However, the implications of our findings extend beyond market surveillance. Shifts in the likelihood of transient mismatches between liquidity supply and demand may have broader macro-financial ramifications, as they may pose potential vulnerabilities if affecting liquidity, volatility, and tail risk premiums in Treasury markets. As these and other core markets continue to evolve and face new challenges, the ability to accurately assess and respond to strains in market liquidity provision can be crucial for maintaining market stability and efficiency.15
References
Aronovich, A., D. Dobrev, and A. Meldrum (2021). “The Treasury Market Flash Event of February 25, 2021,” FEDS Notes. Washington: Board of Governors of the Federal Reserve System, May 14, 2021.
Baker L., L. McPhail, and B. Tuckman (2020). “The Liquidity Hierarchy in the US Treasury Cash and Futures Market.” Journal of Fixed Income, 30 (1), pp. 90-99, https://www.pm-research.com/content/iijfixinc/30/1/90.
Berger, D., A. Chaboud, and E. Hjalmarsson (2009). “What drives volatility persistence in the foreign exchange market?.” Journal of Financial Economics, 94(2), pp.192-213, https://www.sciencedirect.com/science/article/pii/S0304405X09001196.
Brandt, M. and K. Kavajecz (2004). “Price Discovery in the US Treasury Market: The Impact of Orderflow and Liquidity on the Yield Curve.” The Journal of Finance, 59(6), pp. 2623-2654, https://onlinelibrary.wiley.com/doi/full/10.1111/j.1540-6261.2004.00711.x.
Brogaard, J., K. Sokolov, and J. Zhang (2025). “Strategic Liquidity Provision and Extreme Volatility Spikes”. Management science, forthcoming.
Cont, R., A. Kukanov, and S. Stoikov (2014). “The Price Impact of Order Book Events.” Journal of Financial Econometrics, 12(1), pp. 47-88, https://academic.oup.com/jfec/article/12/1/47/816163.
Dyer H., M. Fleming, and O. Shachar (2024). “End-of-Month Liquidity in the Treasury Market,” Federal Reserve Bank of New York Liberty Street Economics, September 24, 2024.
Fleming, M., B. Mizrach, and G. Nguyen (2018). “The microstructure of a US Treasury ECN: The BrokerTec platform,” Journal of Financial Markets, 40, pp. 2-22, https://www.sciencedirect.com/science/article/pii/S1386418117301477.
Harvey, C., M. Mazzoleni, and A. Melone (2025). “The Unintended Consequences of Rebalancing.”, Working Paper No. w33554, National Bureau of Economic Research.
Joint Staff Report (2015). “The U.S. Treasury Market on October 15, 2014 (PDF).” U.S. Department of the Treasury, Board of Governors of the Federal Reserve System, Federal Reserve Bank of New York, U.S. Securities and Exchange Commission, and U.S. Commodity Futures Trading Commission.
Kyle, A. and A. Obizhaeva (2016). “Market Microstructure Invariance: Empirical Hypotheses.” Econometrica, 84(4), pp. 1345-1404, https://onlinelibrary.wiley.com/doi/abs/10.3982/ECTA10486.
Loo, M. and D. Smith (2025). “Making Sense of the Current US Treasury Market.” State Street Insights, April 21, 2025, https://www.ssga.com/us/en/individual/insights/making-sense-of-the-current-us-treasury-market.
Nagel, S. (2012). “Evaporating Liquidity (https://academic.oup.com/rfs/article/25/7/2005/1602153).” The Review of Financial Studies, 25(7), pp. 2005-2039.
Nguyen, G., R. Engle, M. Fleming, and E. Ghysels (2020). “Liquidity and volatility in the US Treasury market (https://www.sciencedirect.com/science/article/pii/S0304407619302465)”. Journal of Econometrics, 217(2), pp. 207-229.
Open Market Operations Report (2020). “Open Market Operations During 2020 (PDF)”. A Report Prepared for the Federal Open Market Committee by the Markets Group of the Federal Reserve Bank of New York.
* We thank Rochelle Edge, Michael Fleming and Min Wei for helpful discussions and suggestions. Return to text
1. See Nagel (2012) (https://academic.oup.com/rfs/article/25/7/2005/1602153), Brogaard, Sokolov and Zhang (2025) and Harvey, Mazzoleni and Melone (2025). Return to text
2. See Baker, McPhail and Tuckman (2020) (https://www.pm-research.com/content/iijfixinc/30/1/90). Return to text
3. We measure market depth, a standard liquidity measure, as the average volume of best-price quotes on the buy and sell sides of the market and compute realized volatility as the sum of squared five-minute intraday returns during the main US trading hours for the benchmark (on-the-run) 10-year Treasury note. Return to text
4. Market commentary attributed the elevated trading volumes to a combination of fundamental and technical factors, including unwinding of swap spread trades and basis trades, along with rebalancing by trend-following Commodity Trading Advisors (CTAs) and risk parity funds (e.g., see Loo and Smith (2025) (https://www.ssga.com/us/en/individual/insights/making-sense-of-the-current-us-treasury-market), among others). Return to text
5. See Dyer, Fleming and Shachar (2024). Return to text
6. For further details on intraday activity and liquidity patterns in Treasury markets see Fleming, Mizrach and Nguyen (2018) (https://www.sciencedirect.com/science/article/pii/S1386418117301477) and Nguyen, Engle, Fleming and Ghysels (2020) (https://www.sciencedirect.com/science/article/pii/S0304407619302465). Return to text
7. Notable yield volatility and rise in trading volumes were also observed in other segments of the Treasury cash and futures markets (not shown). Return to text
8. The event window analysis of trading volumes in this note follows a similar approach to the analysis in the Joint Staff Report on the U.S. Treasury Market on October 15, 2014 (PDF). Return to text
9. As further motivation for this explanation, large directional order flow was cited as a contributing factor in the 2014 flash rally analyzed in the Joint Staff Report on the U.S. Treasury Market on October 15, 2014 (PDF). Return to text
10. Beyond order flow imbalance, another mechanism that can lead to large price move is “price gapping,” which occurs when liquidity providers opt to adjust their quotes by several price increments simultaneously, rather than incrementally, with no trades occurring at omitted price levels. However, no evidence of significant “price gapping” in Treasury cash and futures markets was apparent during early April. Return to text
11. Similarly large order flow imbalances did not induce large price fluctuations on March 31st (not shown) due to greater liquidity supply as measured by market depth. At the same time, measures of price impact (not shown) were comparably large on April 7th and 9th and therefore cannot fully account for the observed differences in price fluctuations on those days. Return to text
12. See Aronovich, Dobrev and Meldrum (2021) for a comparison of past episodes of market stress with different recovery times of Treasury market liquidity. Return to text
13. Recent innovations meant to enhance the resilience of Treasury market liquidity under stress include the establishment of a domestic standing repurchase agreement (repo) facility (SRF), the expansion of the buyback operations by the US Treasury (PDF), the upcoming expansion of central clearing in Treasury cash and repo markets, as well as the proposed expansion of the CME-FICC Cross-Margining Arrangement (https://www.cmegroup.com/trading/interest-rates/cleared-otc/faq-cme-ficc-cross-margining-arrangement-expansion.html). Return to text
14. Brandt and Kavajecz (2004) (https://onlinelibrary.wiley.com/doi/full/10.1111/j.1540-6261.2004.00711.x) demonstrated that excess buying or selling pressure can account for approximately a quarter of day-to-day variations in Treasury yields even on days without major macroeconomic announcements. Likewise, Berger, Chaboud and Hjalmarsson (2009) (https://www.sciencedirect.com/science/article/pii/S0304405X09001196) have studied the tight relationship between order flow imbalances and price volatility in foreign exchange markets. More broadly, a strong inverse relationship between market liquidity and price volatility has been established both in theory and empirical work by Kyle and Obizhaeva (2016) (https://onlinelibrary.wiley.com/doi/abs/10.3982/ECTA10486) and Cont, Kukanov, and Stoikov (2014) ((https://academic.oup.com/jfec/article/12/1/47/816163), among others. Return to text
15. In that regard, the Open Market Operations Report (2020) (PDF) describes measures of trading pressure employed by the Federal Reserve’s Open Market Trading Desk to help inform the pace and size of asset purchases in support of Treasury market functioning during the 2020 pandemic. Return to text
Please cite this note as:
Dobrev, Dobrislav, Edith Liu, Joon Kim, and Marius Rodriguez (2025). “Order Flow Imbalances and Amplification of Price Movements: Evidence from U.S. Treasury Markets,” FEDS Notes. Washington: Board of Governors of the Federal Reserve System, November 03, 2025, https://doi.org/10.17016/2380-7172.3954.
Disclaimer: FEDS Notes are articles in which Board staff offer their own views and present analysis on a range of topics in economics and finance. These articles are shorter and less technically oriented than FEDS Working Papers and IFDP papers.