By Developer
Nov 06, 2025
Introduction
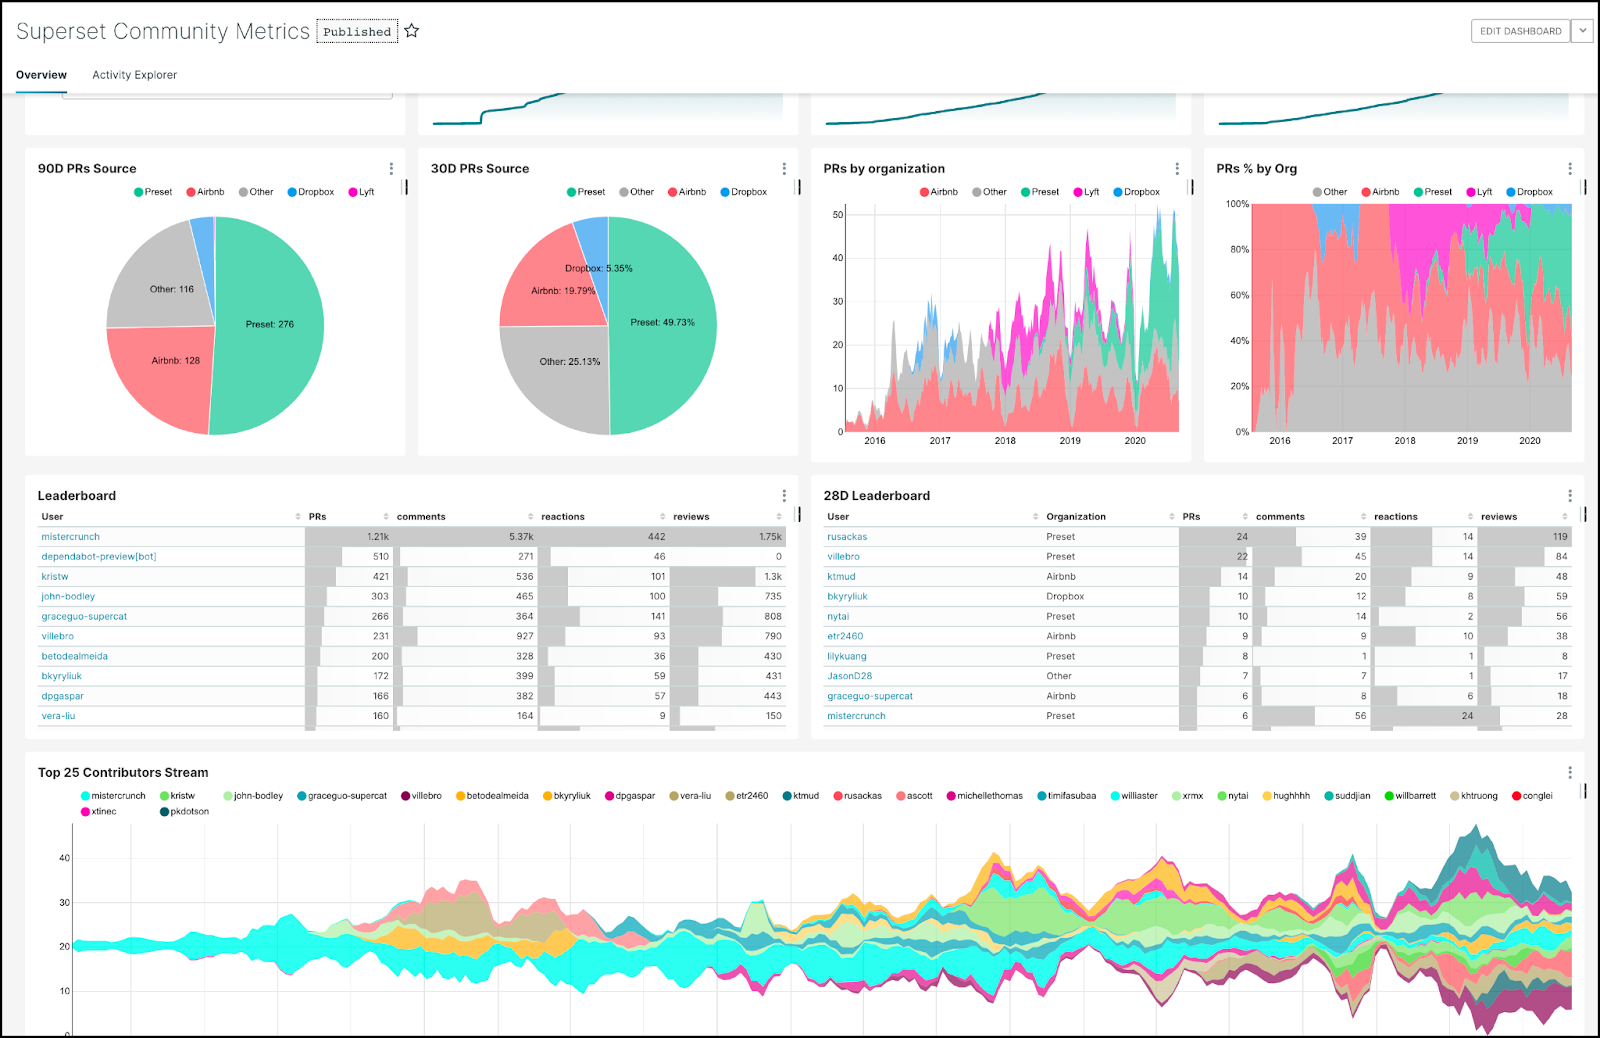
Learn how to visualize time series data from InfluxDB 3 Core using popular open source Apache Superset. This tutorial walks you through setting up both systems with Docker, writing sample IoT data, and creating your first visualization. For more information about Apache Superset, this article may be helpful.
What you’ll build:
- InfluxDB 3 (Core / Enterprise) instance with sample home sensor data
- [A…
By Developer
Nov 06, 2025
Introduction
Learn how to visualize time series data from InfluxDB 3 Core using popular open source Apache Superset. This tutorial walks you through setting up both systems with Docker, writing sample IoT data, and creating your first visualization. For more information about Apache Superset, this article may be helpful.
What you’ll build:
- InfluxDB 3 (Core / Enterprise) instance with sample home sensor data
- Apache Superset dashboard connected to InfluxDB 3
- A simple temperature visualization powered by SQL
 Prerequisites:
- Docker Desktop running on your system (download)
- Terminal/Command line access
- Basic understanding of SQL
Part 1: Setting up InfluxDB 3
Step 1: Install InfluxDB 3 Core (optionally use InfluxDB 3 Enterprise)
Download and run the installation script:
curl -O https://www.influxdata.com/d/install_influxdb3.sh
sh install_influxdb3.sh
When prompted, select the Docker installation option. The script will handle pulling the InfluxDB 3 Docker image and setting up the CLI.
Step 2: Verify Installation
Check that InfluxDB 3 CLI is installed. Command should print the latest InfluxDB 3 version:
influxdb3 --version
Step 3: Start InfluxDB 3 Server
Run the following two commands to create a local directory for storing data (optionally, it can point to a remote object store) and then start the InfluxDB 3 database.
# Create a local directory for data
mkdir -p ~/influxdb3-data

# Start InfluxDB 3 Core with local file system storage
docker run -d \
--name influxdb3 \
-p 8181:8181 \
--volume ~/influxdb3-data:/var/lib/influxdb3 \
influxdb:3-core influxdb3 serve \
--node-id my_node \
--object-store file \
--data-dir /var/lib/influxdb3
What this does:
-druns in detached mode (background)-p 8181:8181exposes the default InfluxDB 3 port--volumemounts local storage for data persistence--object-store fileuses local file system (can also use S3, GCS, or Azure Blob)
Step 4: Create an Authentication Token
Generate an admin token for database operations by executing the following docker command in the influxdb3 container:
docker exec -it influxdb3 influxdb3 create token --admin
Save the token somewhere safe!
Step 5: Create a Database
**docker exec -it influxdb3 influxdb3 create database home_sensors --token "PASTE_YOUR_TOKEN_STRING"
Part 2: Load sample data using CLI
Write Home Sensor Data (optionally stream or write your own data)
We’ll load sample line protocol data consisting of temperature, humidity, and CO readings from two rooms:
docker exec -it influxdb3 influxdb3 write \
--database home_sensors \
--token "PASTE_YOUR_TOKEN_STRING" \
'home,room=Living\ Room temp=21.1,hum=35.9,co=0i 1741593600
home,room=Kitchen temp=21.0,hum=35.9,co=0i 1741593600
home,room=Living\ Room temp=21.4,hum=35.9,co=0i 1741597200
home,room=Kitchen temp=23.0,hum=36.2,co=0i 1741597200
home,room=Living\ Room temp=21.8,hum=36.0,co=0i 1741600800
home,room=Kitchen temp=22.7,hum=36.1,co=0i 1741600800
home,room=Living\ Room temp=22.2,hum=36.0,co=0i 1741604400
home,room=Kitchen temp=22.4,hum=36.0,co=0i 1741604400
home,room=Living\ Room temp=22.2,hum=35.9,co=0i 1741608000
home,room=Kitchen temp=22.5,hum=36.0,co=0i 1741608000
home,room=Living\ Room temp=22.4,hum=36.0,co=0i 1741611600
home,room=Kitchen temp=22.8,hum=36.5,co=1i 1741611600'
Understanding the data format (Line Protocol):
home- measurement nameroom=Living\ Room- tag (indexed, for filtering)temp=21.1,hum=35.9,co=0i- fields (actual data values)1741593600- timestamp (Unix epoch in seconds)
Other ways to write data:
- Telegraf - You can run the popular open source tool Telegraf in another Docker container to collect system metrics in real-time automatically
- InfluxDB Client SDKs v3 - Python, Go, JavaScript, Java, C#, Node, etc.
- HTTP APIs - Direct write endpoint for custom integrations
For this tutorial, we’re using static data to keep it simple.
Step 6: Verify Data with CLI Query
Query the data using InfluxDB 3 CLI and SQL to confirm it loaded correctly:
docker exec -it influxdb3 influxdb3 query \
--database home_sensors \
"SELECT * FROM home ORDER BY time DESC LIMIT 10" \
--token "PASTE_YOUR_TOKEN_STRING"
You should see the 10 most recent readings.
Try another query—average temperature by room:
docker exec -it influxdb3 influxdb3 query \
--database home_sensors \
"SELECT room, AVG(temp) as avg_temp FROM home GROUP BY room" \
--token "PASTE_YOUR_TOKEN_STRING"
Part 3: Setting up Apache Superset
Step 1: Clone Superset and Add Flight SQL Support
# Clone the repository
git clone https://github.com/apache/superset.git
cd superset
Step 2: Add Apache FlightSQL Support
# Add flightsql-dbapi to the requirements file
echo "flightsql-dbapi" >> docker/requirements-local.txt
# Verify it was added
cat docker/requirements-local.txt
Step 3: Start Superset
- Download/copy docker-compose-non-dev.yml. That takes care of setting up Superset locally.
- Start Superset in Docker containers using Docker Compose.
# Pull images
docker-compose -f docker-compose-non-dev.yml pull

# Start superset services
docker-compose -f docker-compose-non-dev.yml up -d --no-deps superset
Wait 2-3 minutes for all services to start. Check status:
docker ps | grep superset
Make sure containers show a “healthy” status.
Step 4: Access Superset UI
Open your browser to:
http://localhost:8088
Login credentials:
Username: adminPassword: admin
Optionally: Change the admin password after first login via Settings → List Users.
Part 4: Connect InfluxDB to Superset
Step 1: Add Database Connection
- Click Settings (top right) → Database Connections
- Click + Database button
- Select Other from the dropdown
Step 2: Configure Connection
Display Name:
InfluxDB3
SQLAlchemy URI:
datafusion+flightsql://localhost:8181?database=home_sensors&token=YOUR_TOKEN_HERE
Replace YOUR_TOKEN_HERE with your actual token from earlier.
Important: Use datafusion+flightsql:// (not just flightsql://).
Step 3: Test Connection
Click Test Connection. You should see a “success” message. 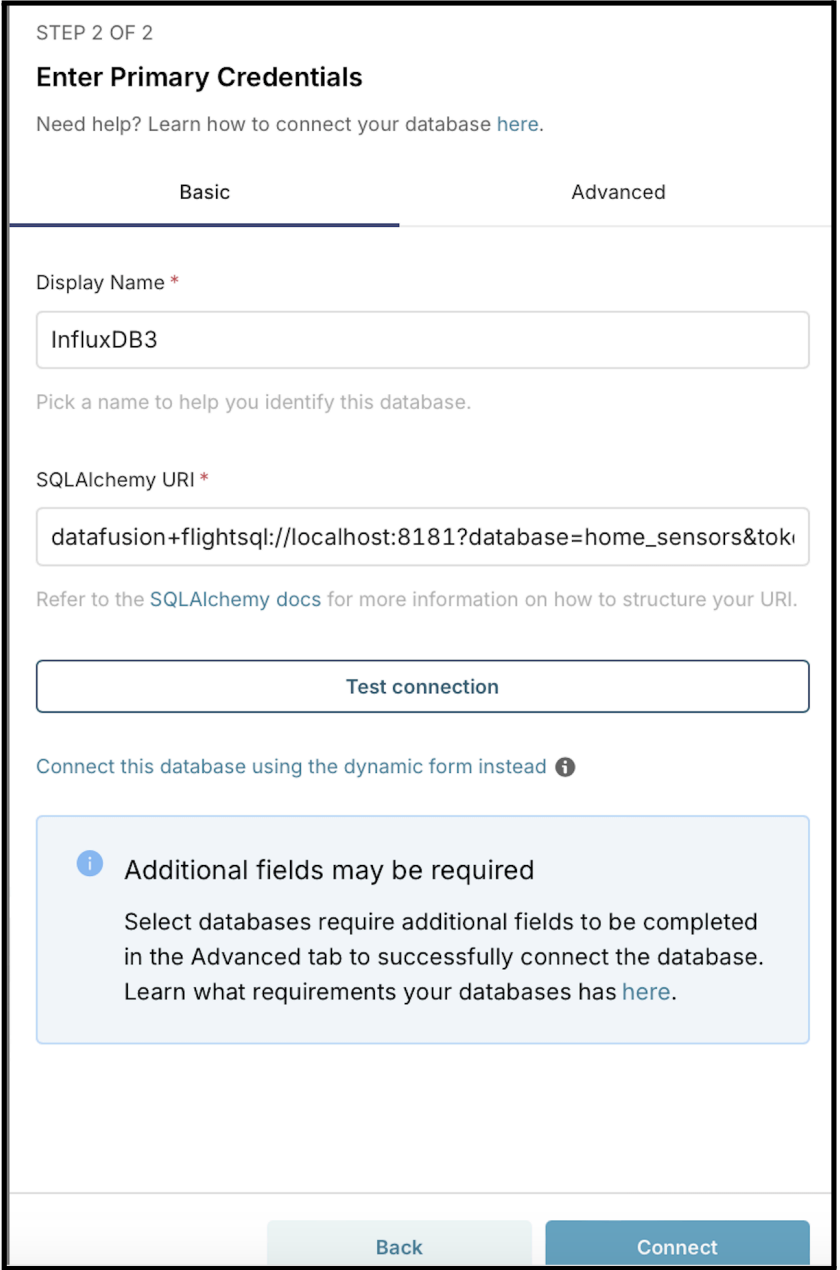 Click Connect to save.
Part 5: Query and visualize data
Open SQL Lab, write the SQL query and execute to see the data: 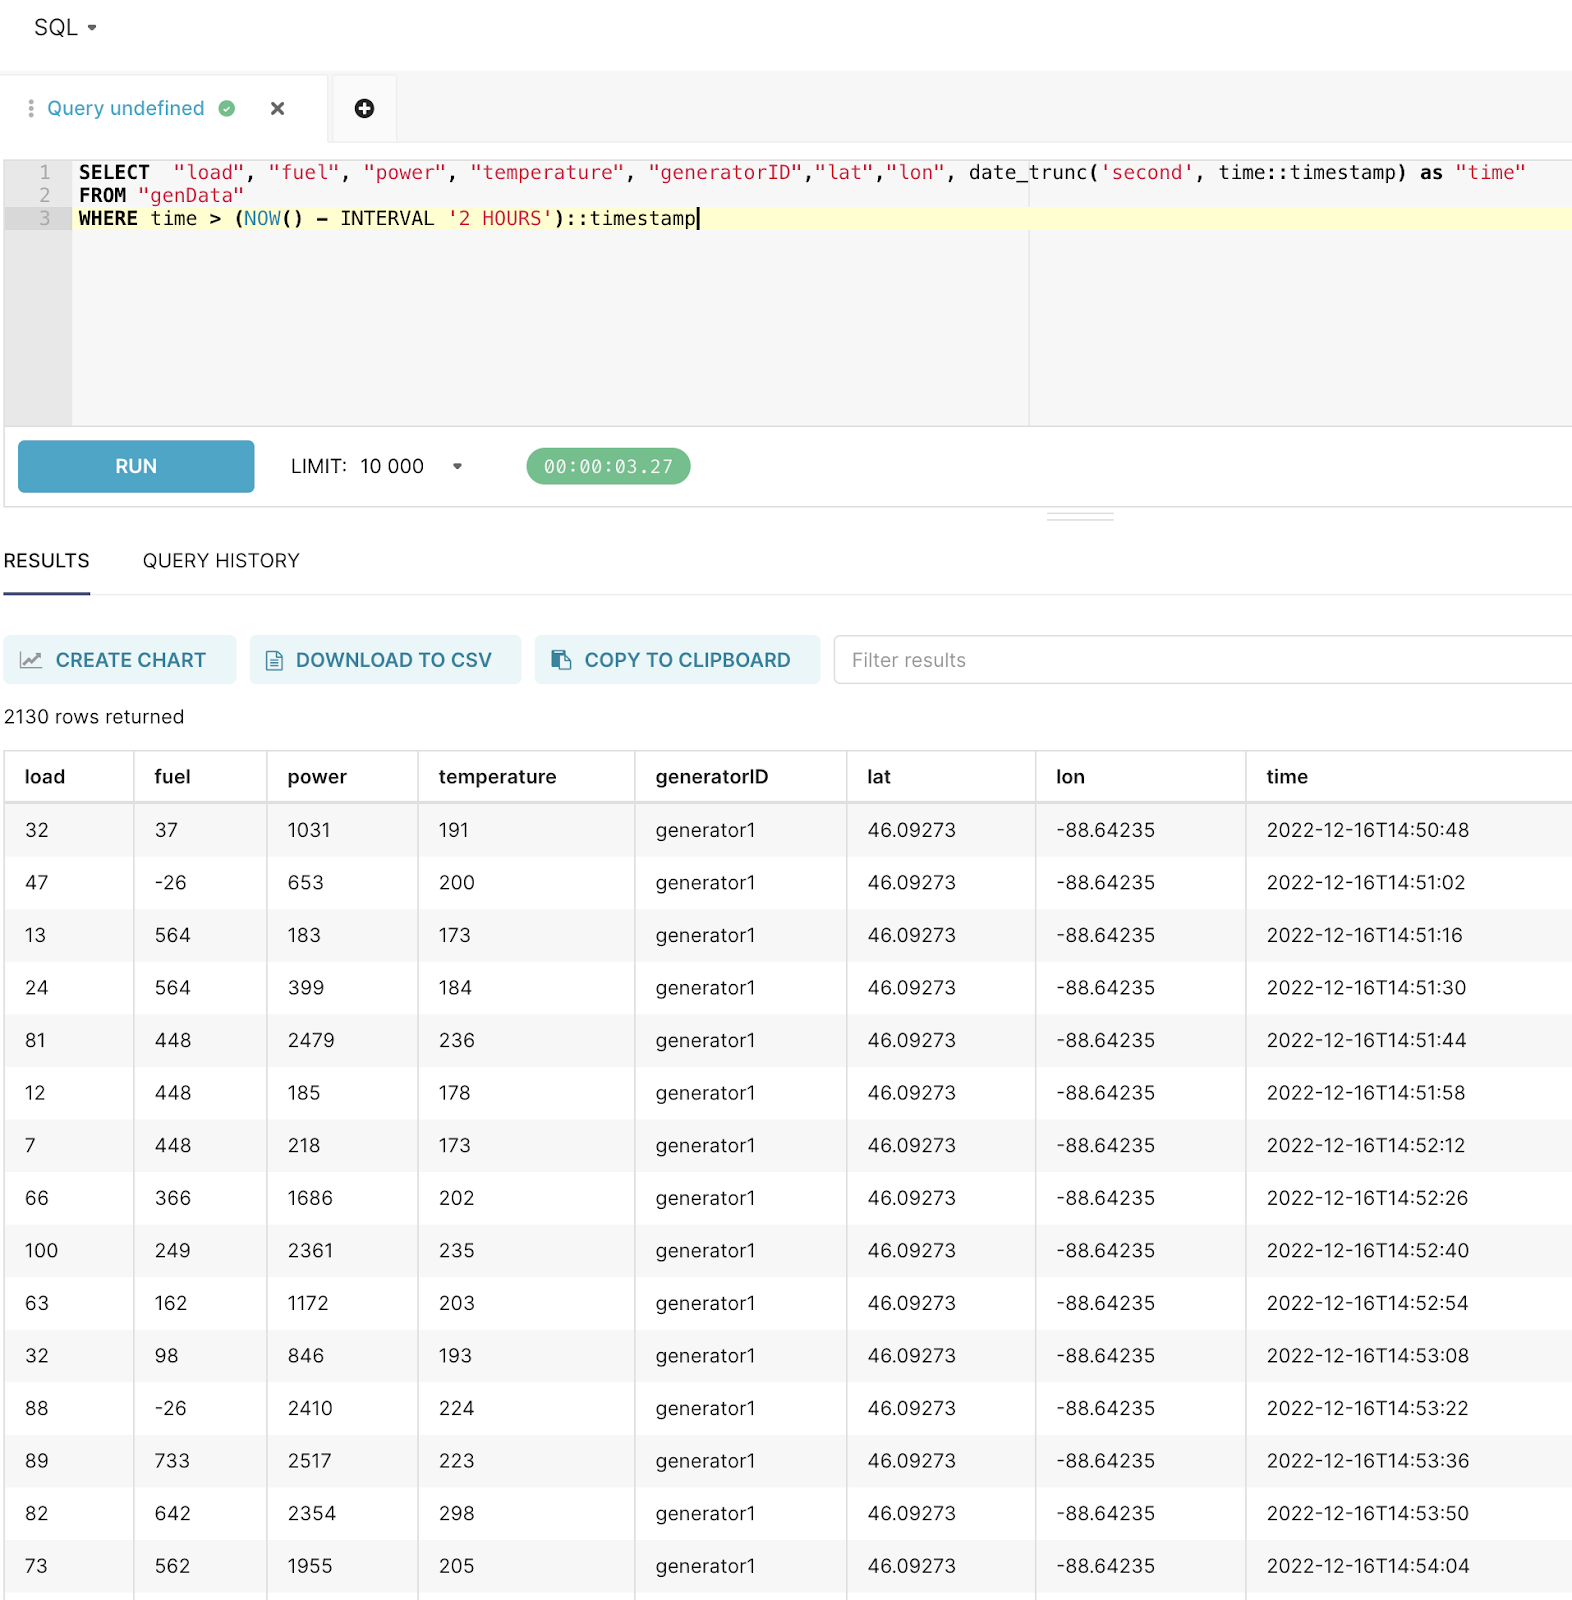
Lastly, don’t forget to save your dashboard for easier future reference.
Troubleshooting
Problem: “Could not load database driver”
Error: sqlalchemy.exc.NoSuchModuleError: Can't load plugin: sqlalchemy.dialects:flightsql
Solution: The flightsql-dbapi package wasn’t installed before starting Superset
# Stop containers
docker-compose down

# Ensure requirements file exists
echo "flightsql-dbapi" > ./docker/requirements-local.txt

# Restart

docker-compose -f docker-compose-non-dev.yml up -d
Problem: Connection Timeout
Causes: Wrong host/port, InfluxDB not running, or firewall blocking
Solutions:
- Verify InfluxDB is running:
docker ps | grep influxdb - Check port (default: 8181 for Core)
- Use
localhost, not127.0.0.1when both are in Docker
Problem: Wrong Protocol
Error: Connection fails with flightsql://
Solution: Use datafusion+flightsql:// (not just flightsql://)
Next steps
You now have a complete stack for collecting, storing, and visualizing time series data! You can customize your dashboard, add your own (real-time) data, and connect with InfluxDB 3 Enterprise (use the same steps as above, just make sure the Docker image is for the enterprise version). For more help and inspiration, check out the InfluxDB community forum, Slack, Reddit, and Discord community. Happy visualizing!