- 7 min read
- Performance, Optimization, Tools
- Share on Twitter, LinkedIn
There are lots of tips for [improving your website performance](https://www.debugbear.com/blog/improve-website-performance?utm_campaign=…
- 7 min read
- Performance, Optimization, Tools
- Share on Twitter, LinkedIn
There are lots of tips for improving your website performance. But even if you follow all of the advice, are you able to maintain an optimized site? And are you targeting the right pages? Matt Zeunert outlines an effective strategy for web performance optimization and explains the roles that different types of data play in it.
There’s no single way to measure website performance. That said, the Core Web Vitals metrics that Google uses as a ranking factor are a great starting point, as they cover different aspects of visitor experience:
- Largest Contentful Paint (LCP): Measures the initial page load time.
- Cumulative Layout Shift (CLS): Measures if content is stable after rendering.
- Interaction to Next Paint (INP): Measures how quickly the page responds to user input.
There are also many other web performance metrics that you can use to track technical aspects, like page weight or server response time. While these often don’t matter directly to the end user, they provide you with insight into what’s slowing down your pages.
You can also use the User Timing API to track page load milestones that are important on your website specifically.
Synthetic And Real User Data
There are two different types of web performance data:
- Synthetic tests are run in a controlled test environment.
- Real user data is collected from actual website visitors.
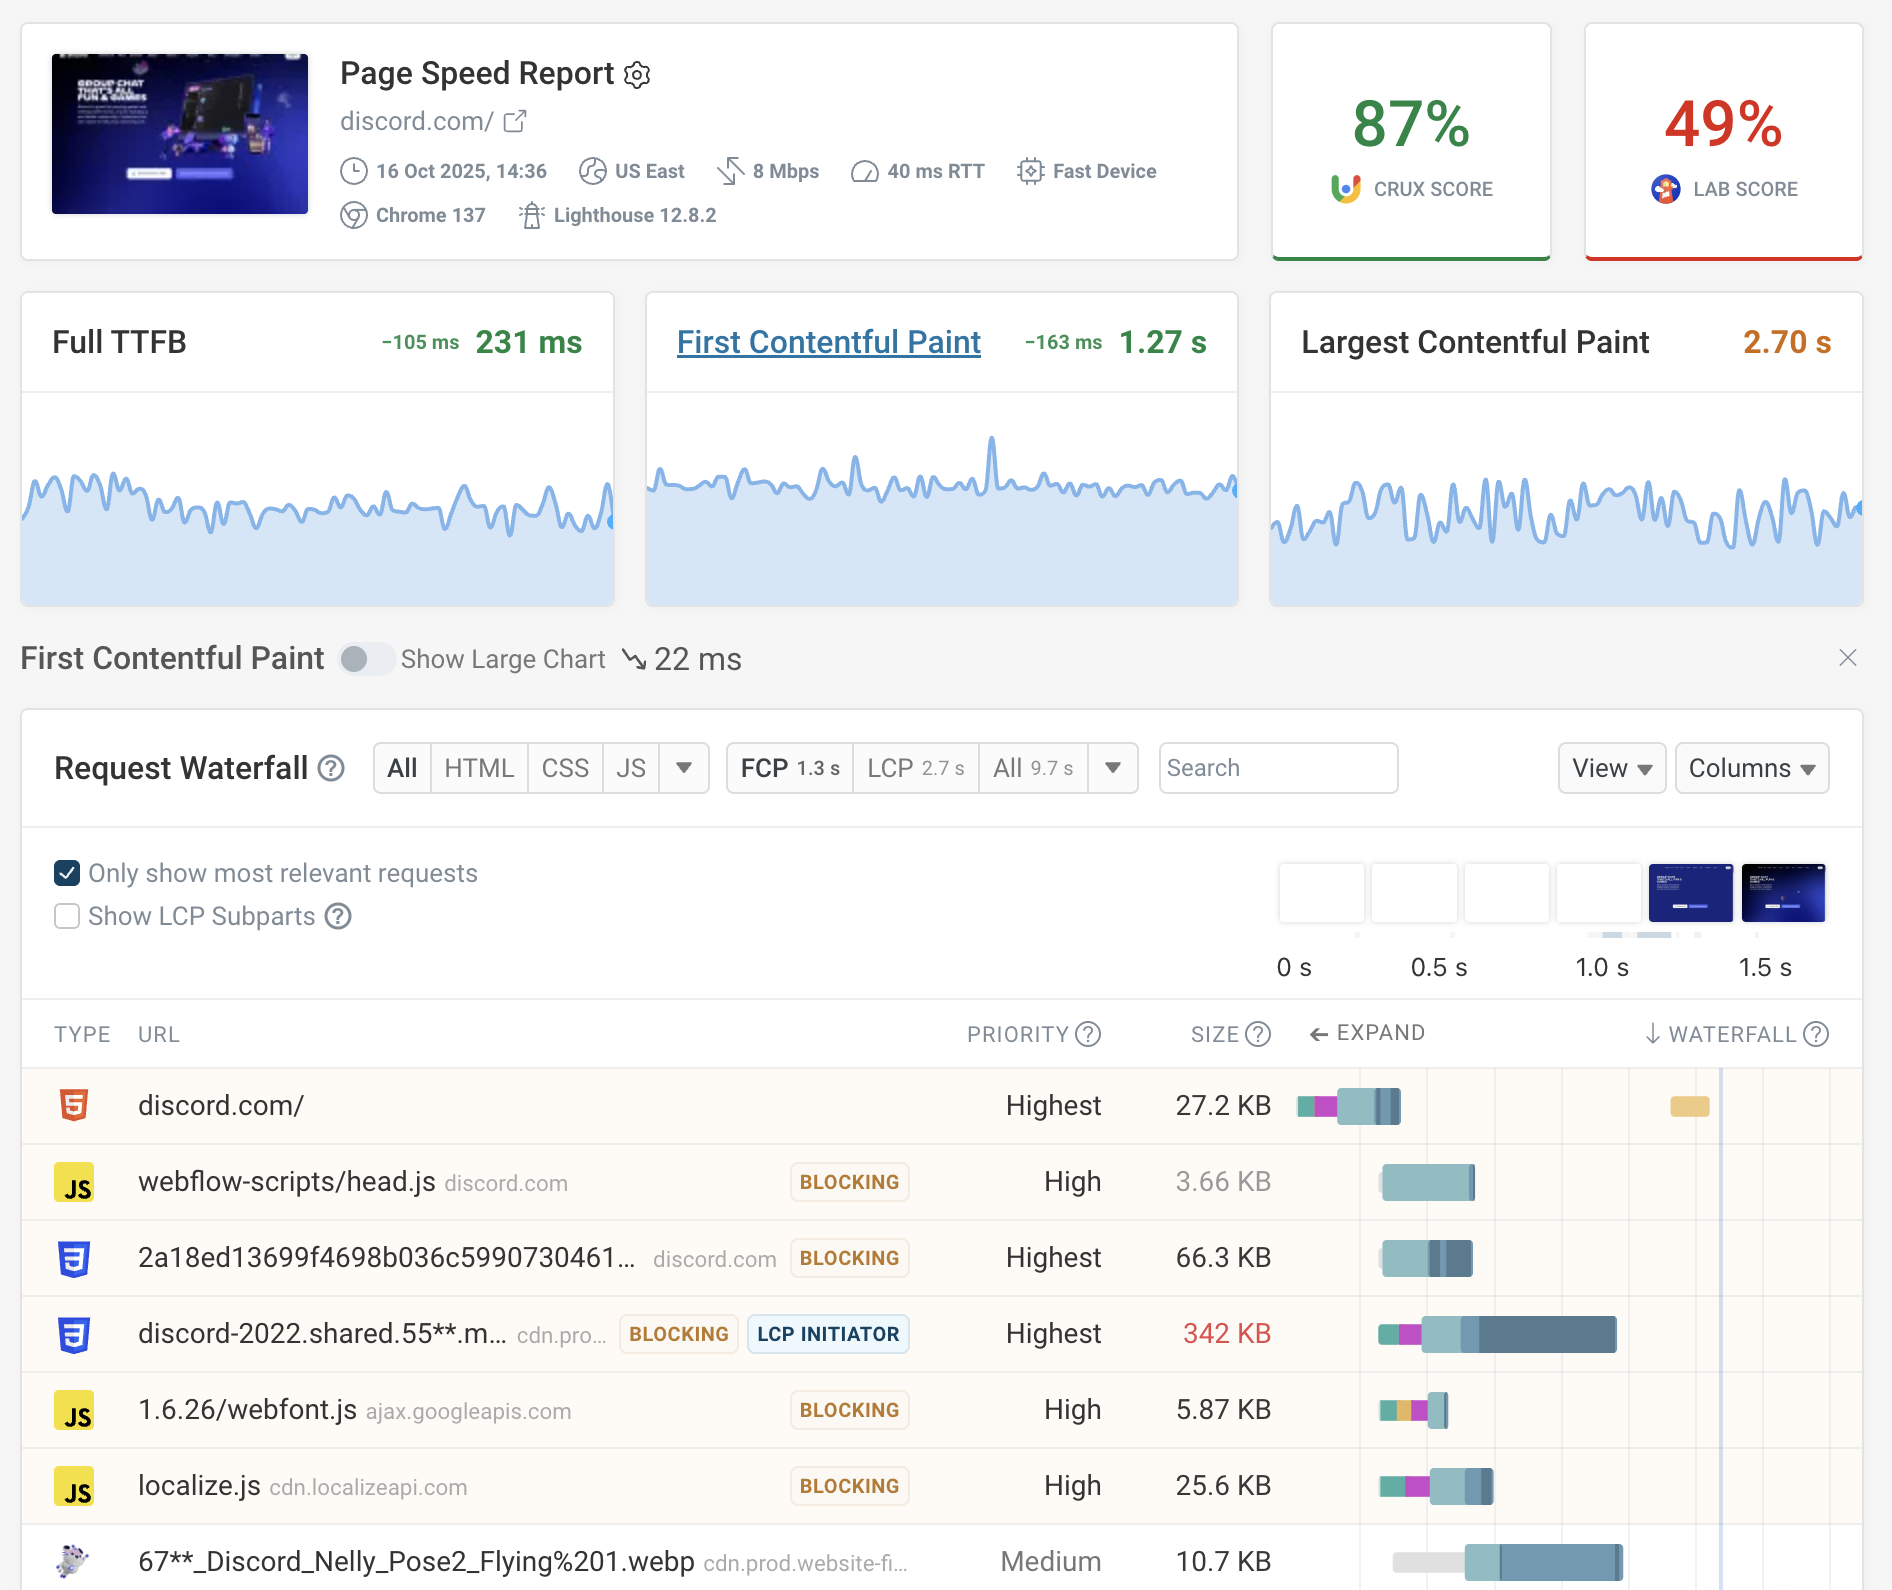
Synthetic monitoring can provide super-detailed reports to help you identify page speed issues. You can configure exactly how you want to collect the data, picking a specific network speed, device size, or test location.
Get a hands-on feel for synthetic monitoring by using the free DebugBear website speed test to check on your website.
That said, your synthetic test settings might not match what’s typical for your real visitors, and you can’t script all of the possible ways that people might interact with your website.
That’s why you also need real user monitoring (RUM). Instead of looking at one experience, you see different load times and how specific visitor segments are impacted. You can review specific page views to identify what caused poor performance for a particular visitor.
At the same time, real user data isn’t quite as detailed as synthetic test reports, due to web API limitations and performance concerns.
DebugBear offers both synthetic monitoring and real user monitoring:
- To set up synthetic tests, you just need to enter a website URL, and
- To collect real user metrics, you need to install an analytics snippet on your website.
Three Steps To A Fast Website
Collecting data helps you throughout the lifecycle of your web performance optimizations. You can follow this three-step process:
- Identify: Collect data across your website and identify slow visitor experiences.
- Diagnose: Dive deep into technical analysis to find optimizations.
- Monitor: Check that optimizations are working and get alerted to performance regressions.
Let’s take a look at each step in detail.
Step 1: Identify Slow Visitor Experiences
What’s prompting you to look into website performance issues in the first place? You likely already have some specific issues in mind, whether that’s from customer reports or because of poor scores in the Core Web Vitals section of Google Search Console.
Real user data is the best place to check for slow pages. It tells you whether the technical issues on your site actually result in poor user experience. It’s easy to collect across your whole website (while synthetic tests need to be set up for each URL). And, you can often get a view count along with the performance metrics. A moderately slow page that gets two visitors a month isn’t as important as a moderately fast page that gets thousands of visits a day.
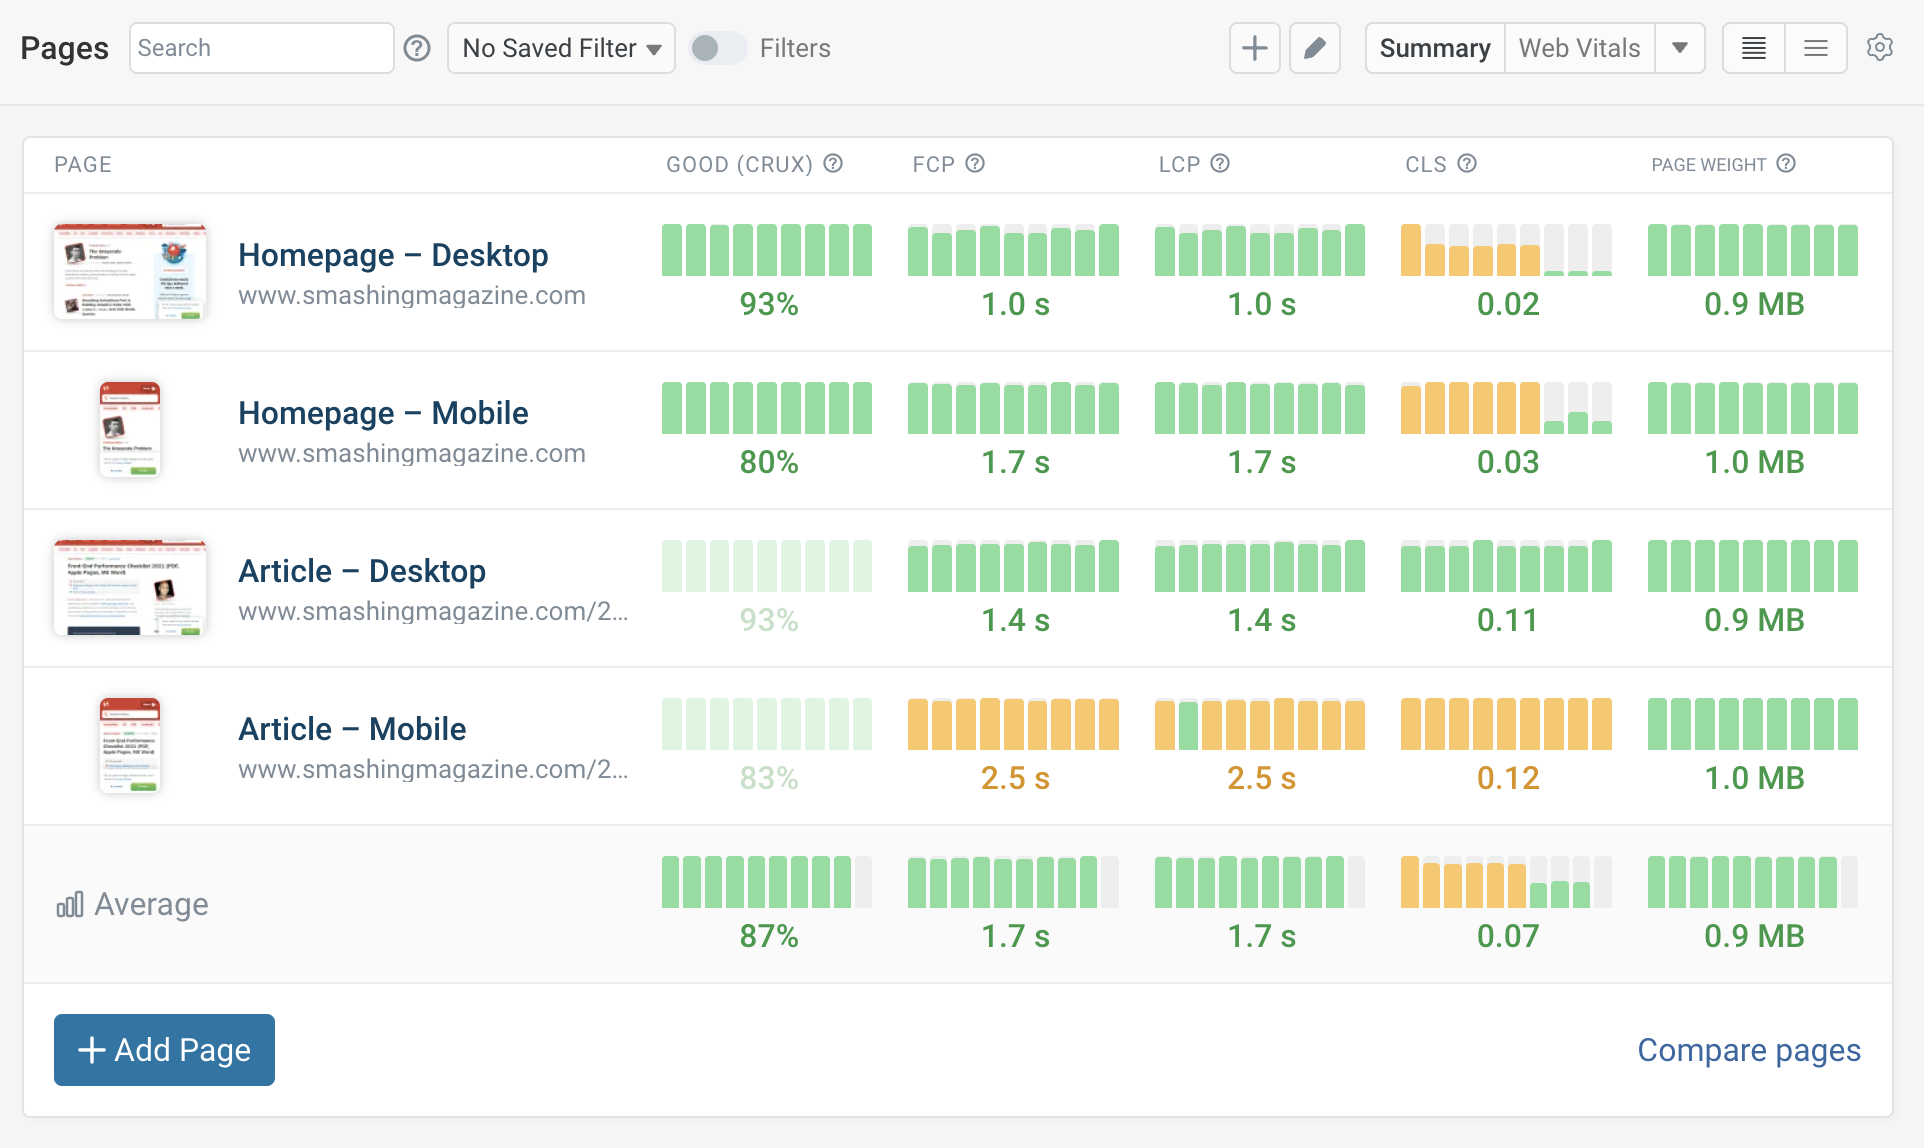
The Web Vitals dashboard in DebugBear’s RUM product checks your site’s performance health and surfaces the most-visited pages and URLs where many visitors have a poor experience.
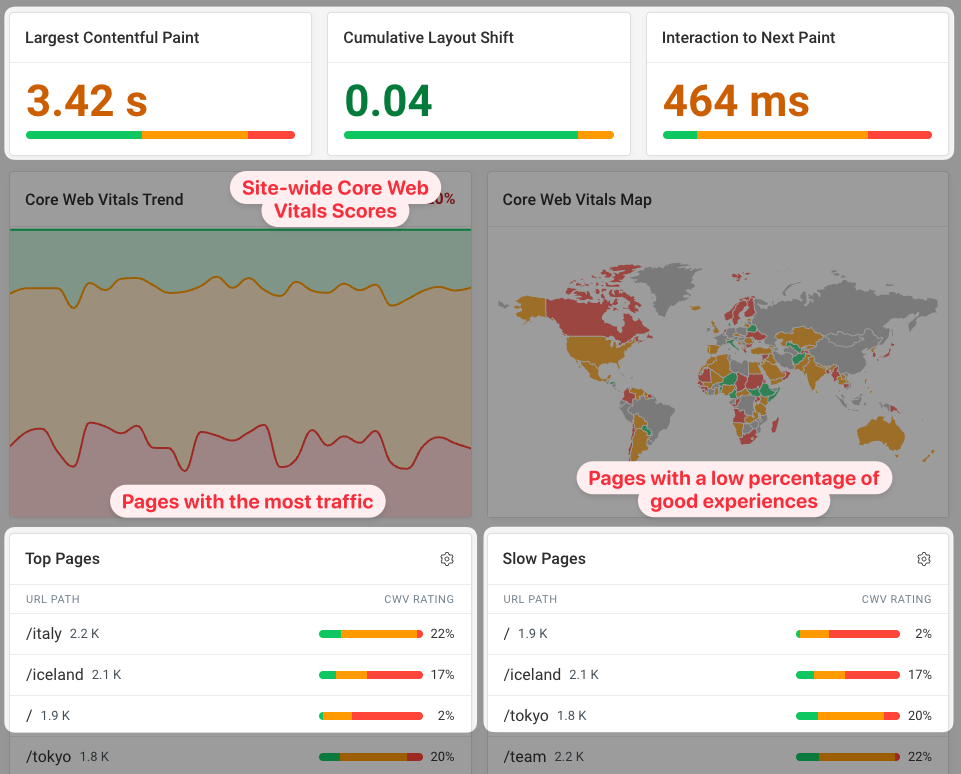
You can also run a website scan to get a list of URLs from your sitemap and then check each of these pages against real user data from Google’s Chrome User Experience Report (CrUX). However, this will only work for pages that meet a minimum traffic threshold to be included in the CrUX dataset.
The scan result highlights pages with poor web vitals scores where you might want to investigate further.
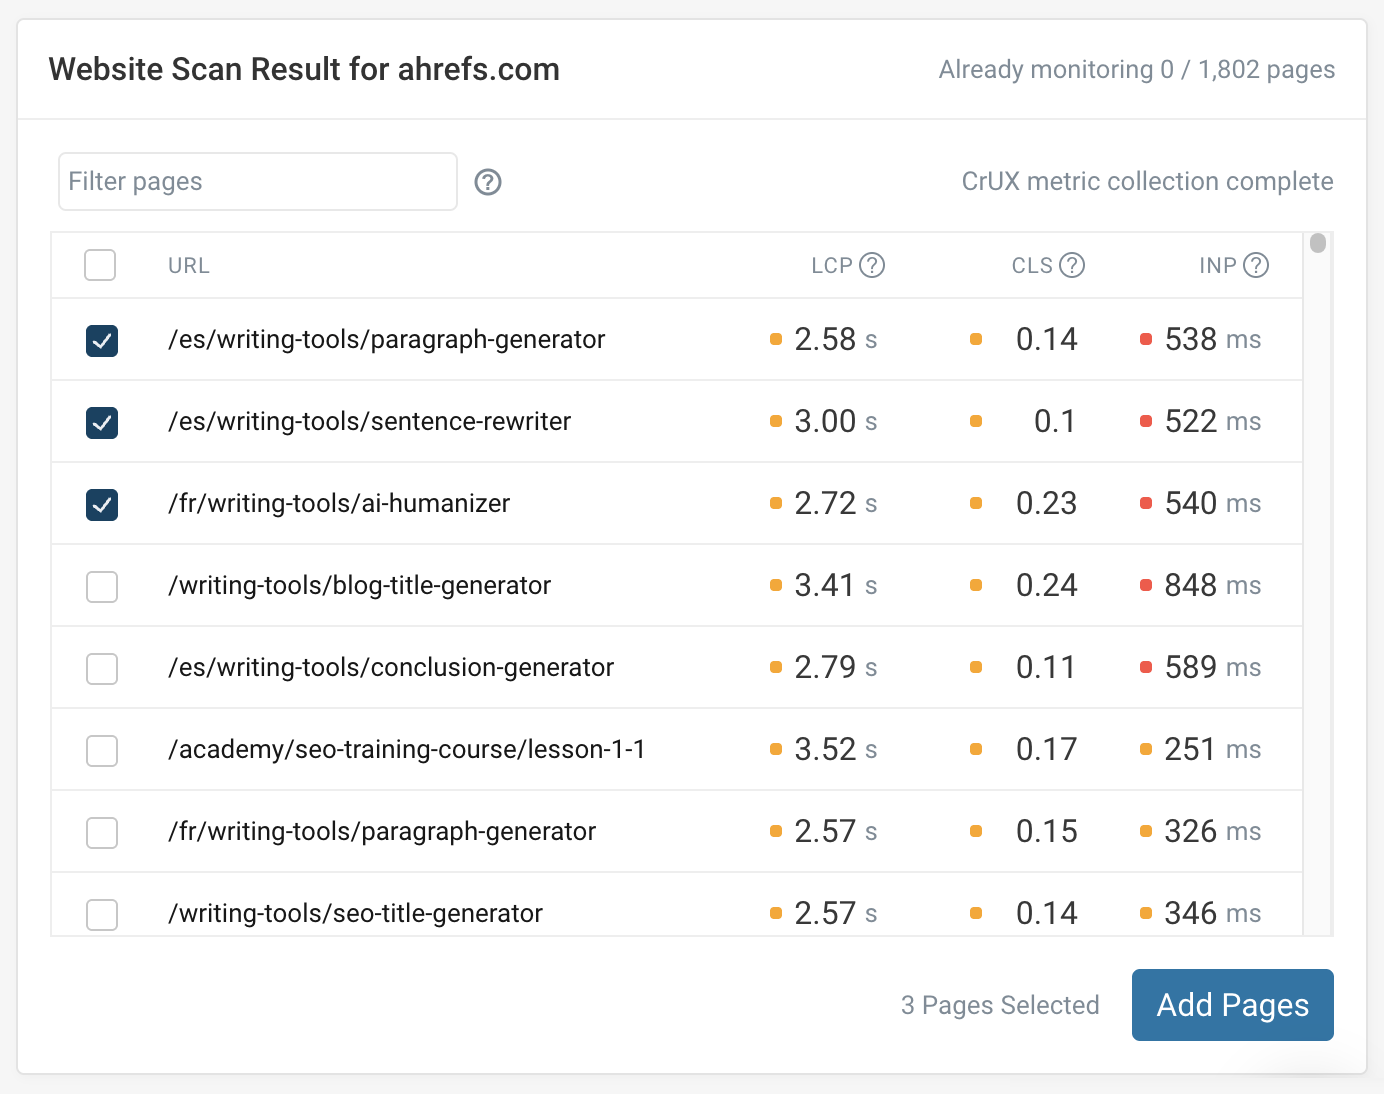
If no real-user data is available, then there is a scanning tool called Unlighthouse, which is based on Google’s Lighthouse tool. It runs synthetic tests for each page, allowing you to filter through the results in order to identify pages that need to be optimized.
Step 2: Diagnose Web Performance Issues
Once you’ve identified slow pages on your website, you need to look at what’s actually happening on your page that is causing delays.
Debugging Page Load Time
If there are issues with page load time metrics — like the Largest Contentful Paint (LCP) — synthetic test results can provide a detailed analysis. You can also run page speed experiments to try out and measure the impact of certain optimizations.
Real user data can still be important when debugging page speed, as load time depends on many user- and device-specific factors. For example, depending on the size of the user’s device, the page element that’s responsible for the LCP can vary. RUM data can provide a breakdown of possible influencing factors, like CSS selectors and image URLs, across all visitors, helping you zero in on what exactly needs to be fixed.
Debugging Slow Interactions
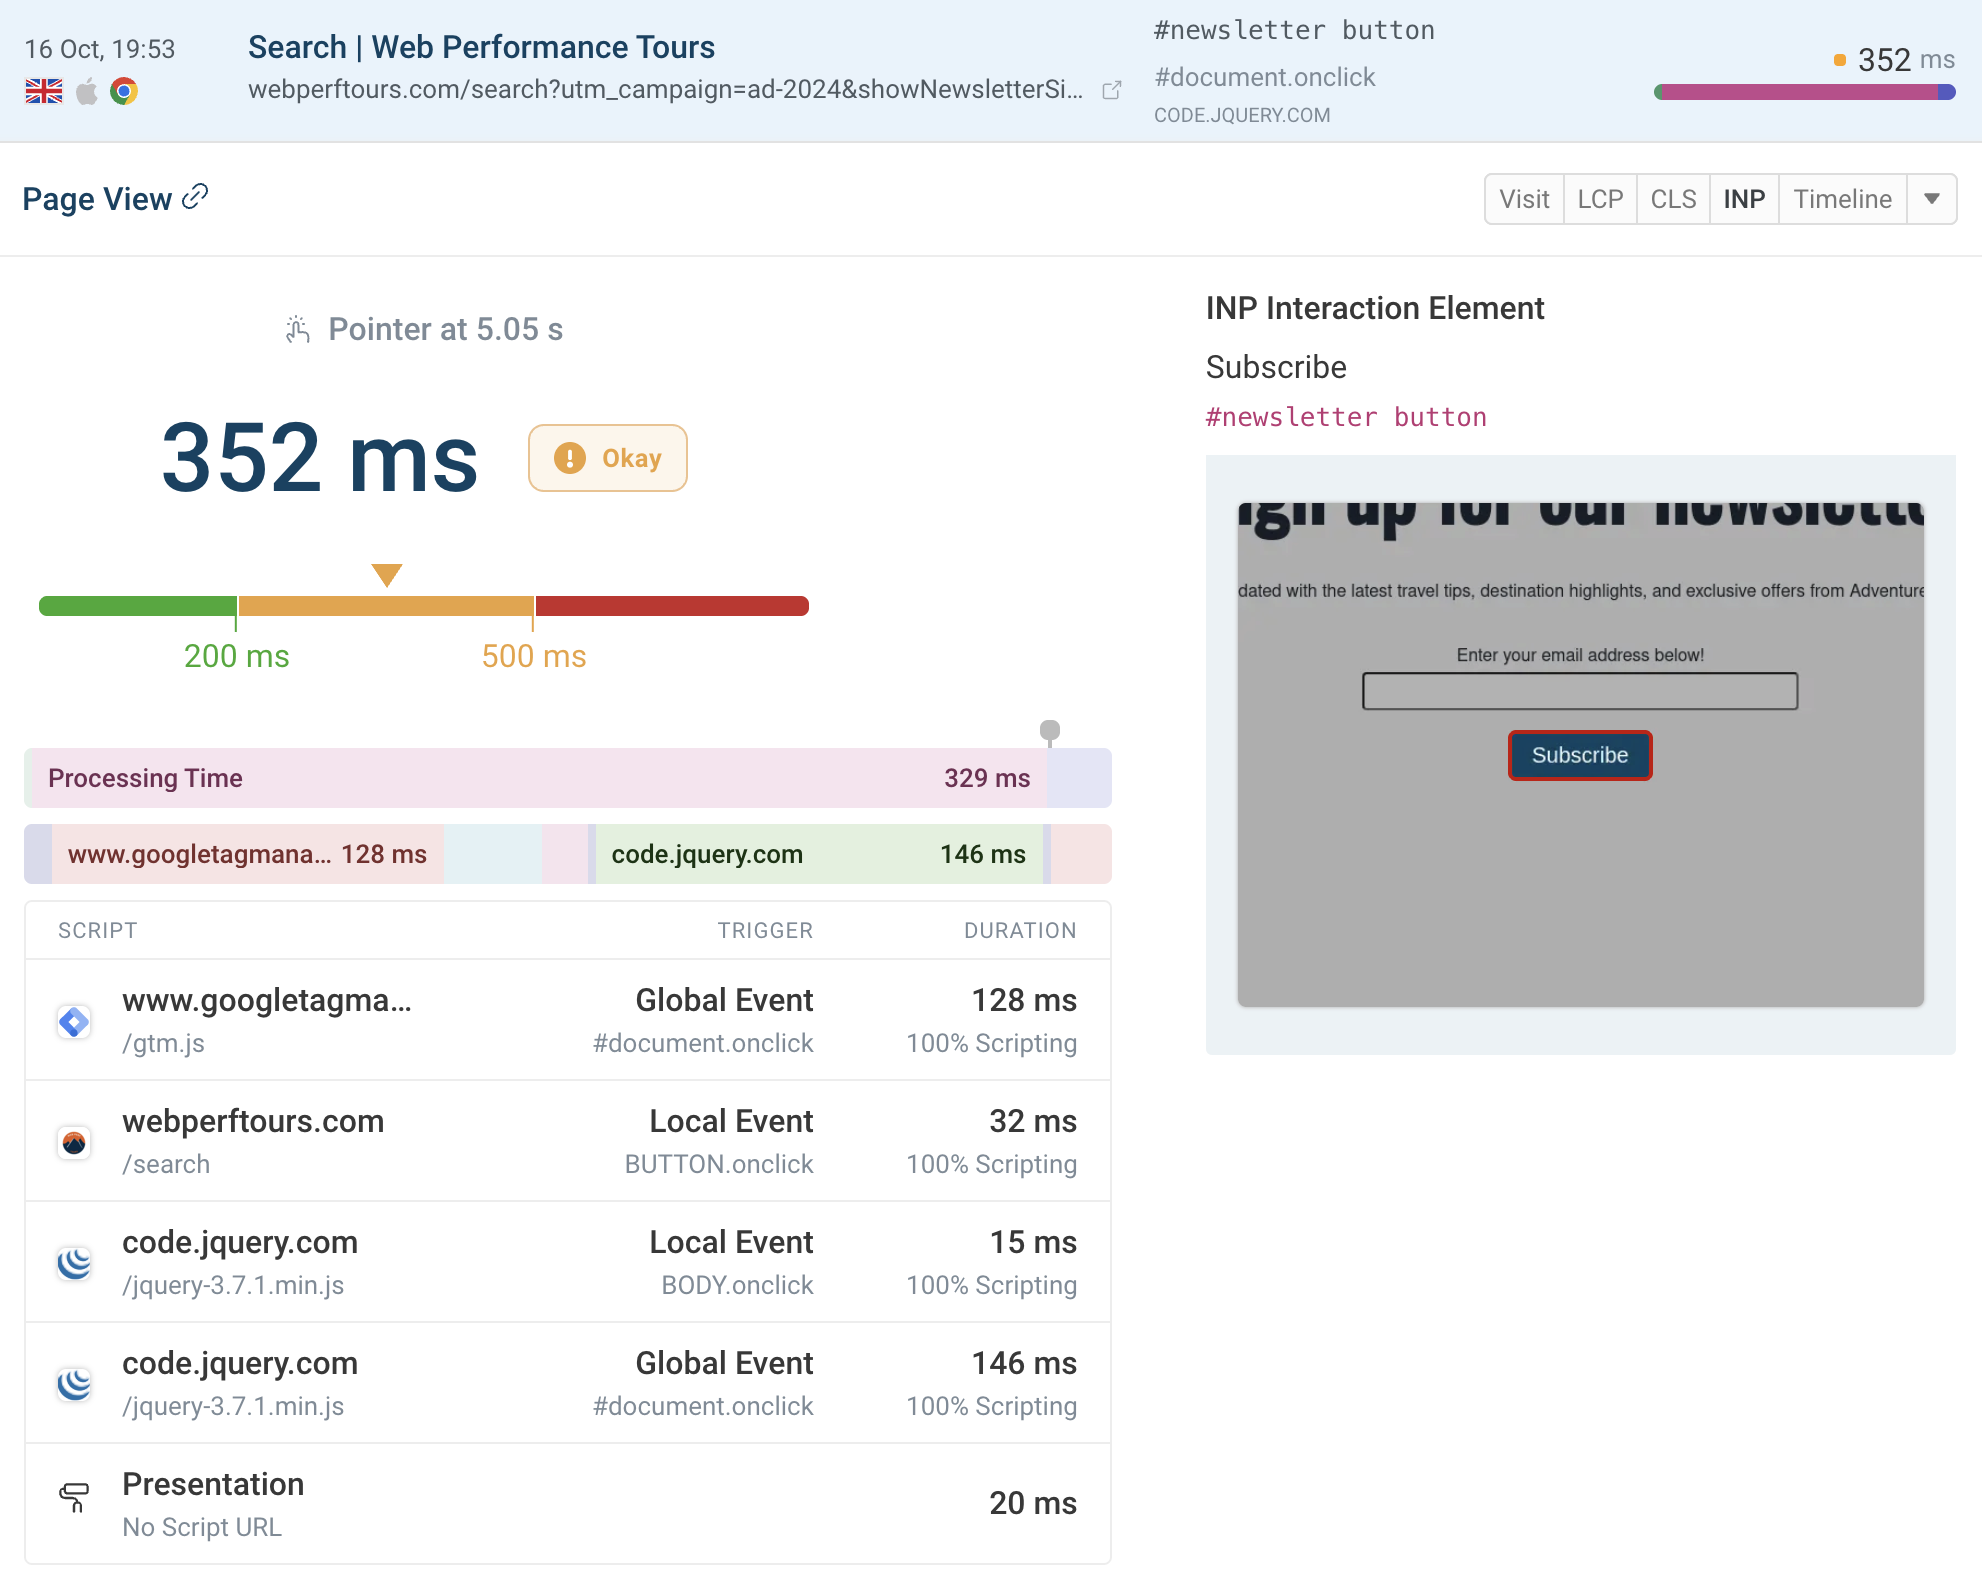
RUM data is also generally needed to properly diagnose issues related to the Interaction to Next Paint (INP) metric. Specifically, real user data can provide insight into what causes slow interactions, which helps you answer questions like:
- What page elements are responsible?
- Is time spent processing already-active background tasks or handling the interaction itself?
- What scripts contribute the most to overall CPU processing time?
You can view this data at a high level to identify trends, as well as review specific page views to see what impacted a specific visitor experience.
Step 3: Monitor Performance & Respond To Regressions
Continuous monitoring of your website performance lets you track whether the performance is improving after making a change, and alerts you when scores decline.
How you respond to performance regressions depends on whether you’re looking at lab-based synthetic tests or real user analytics.
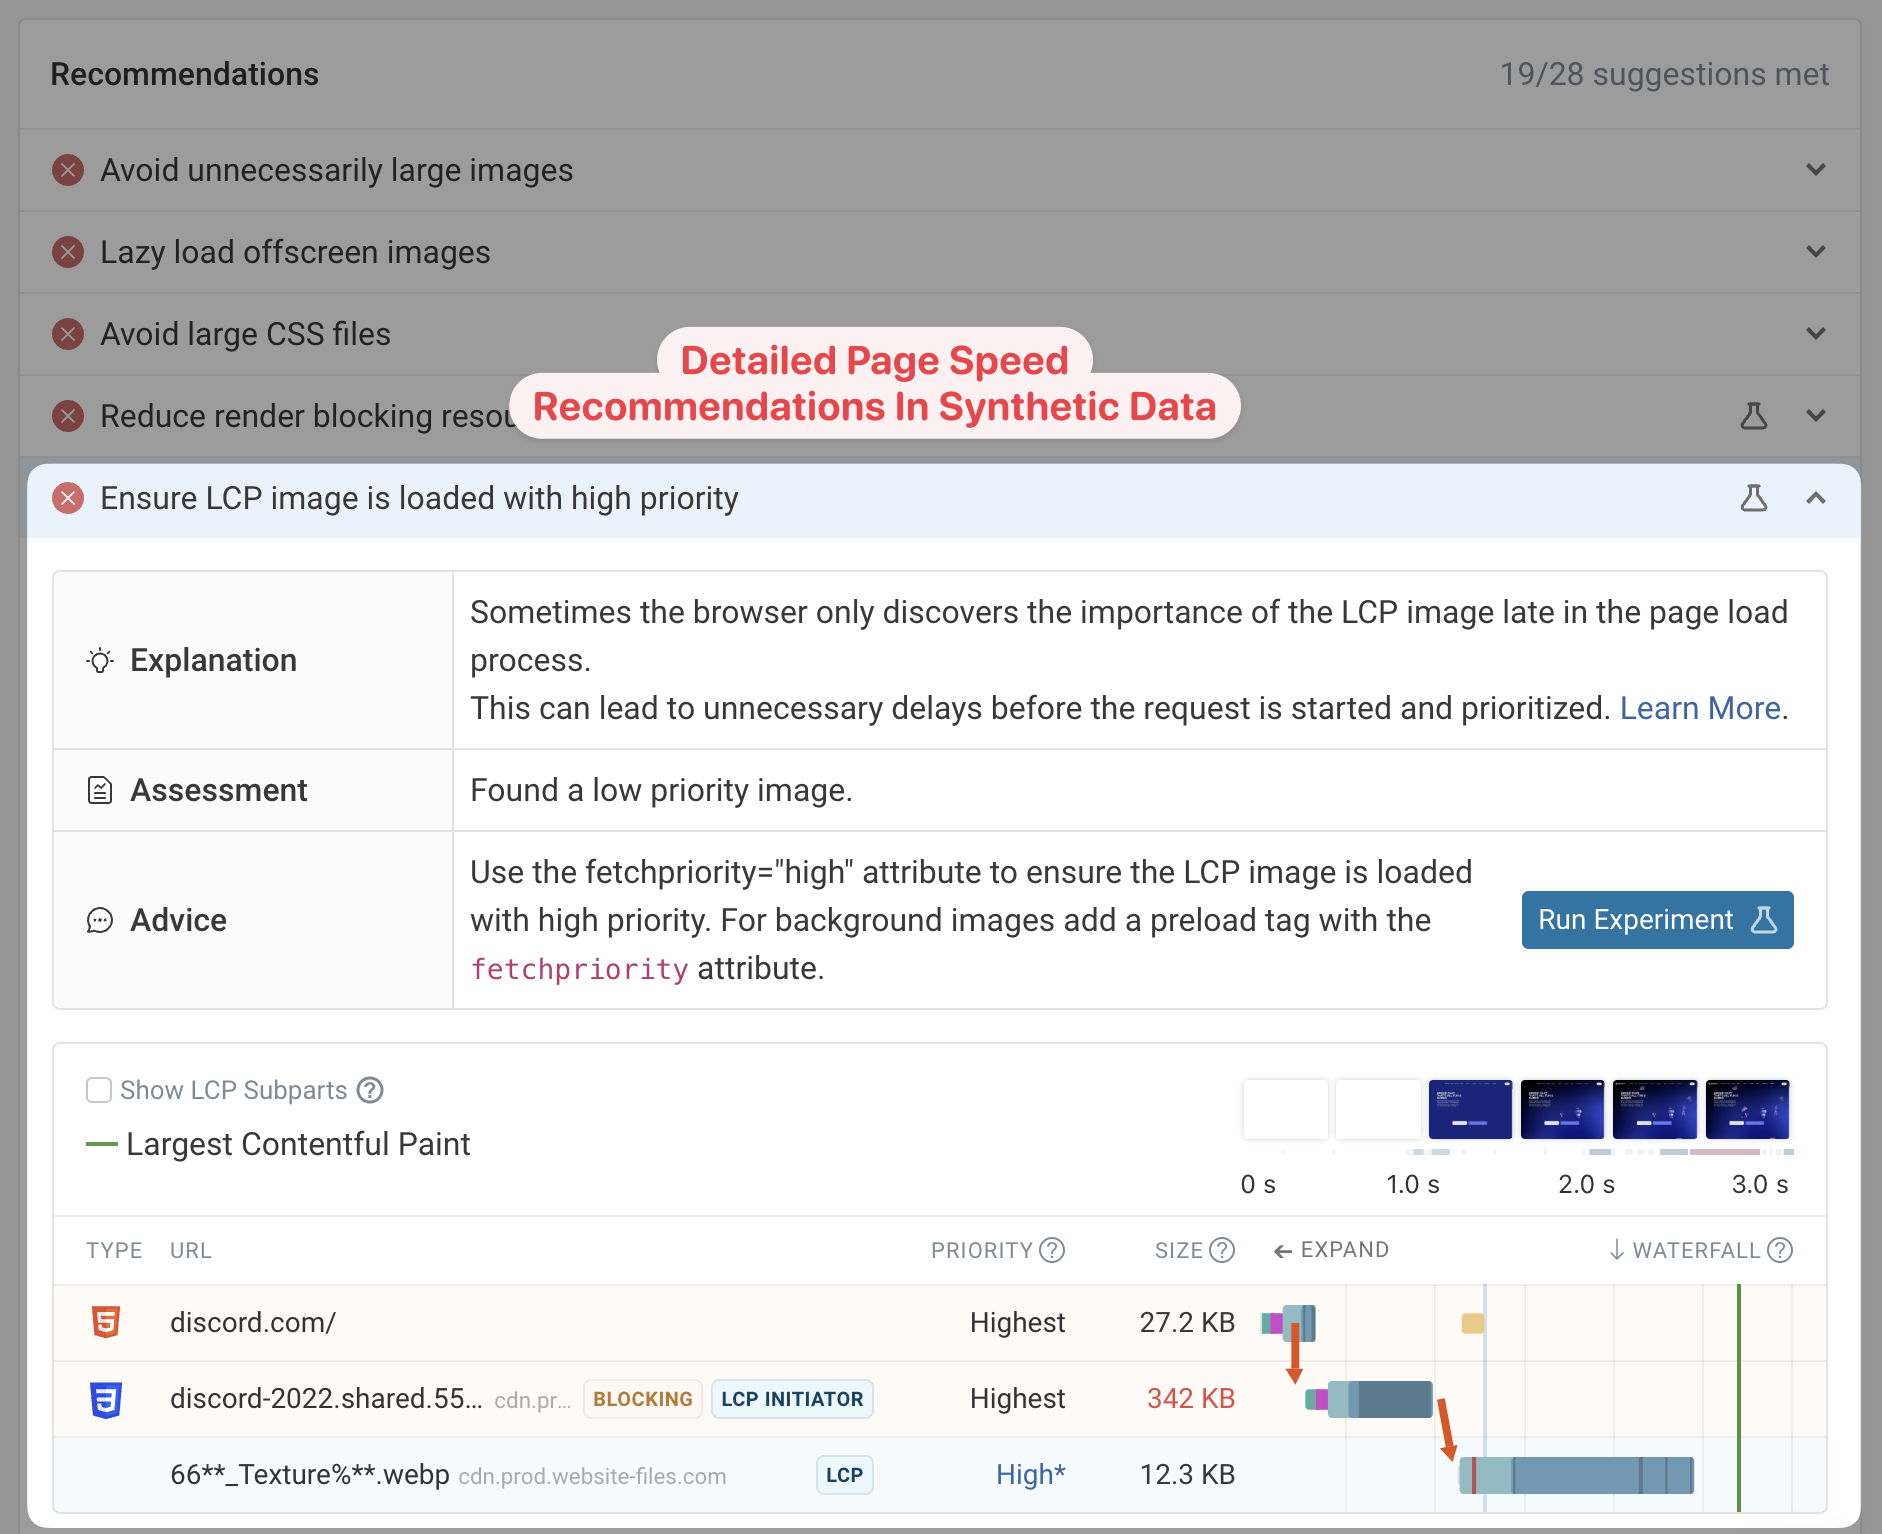
Synthetic Data
Test settings for synthetic tests are standardized between runs. While infrastructure changes, like browser upgrades, occasionally cause changes, performance is more generally determined by resources loaded by the website and the code it runs.
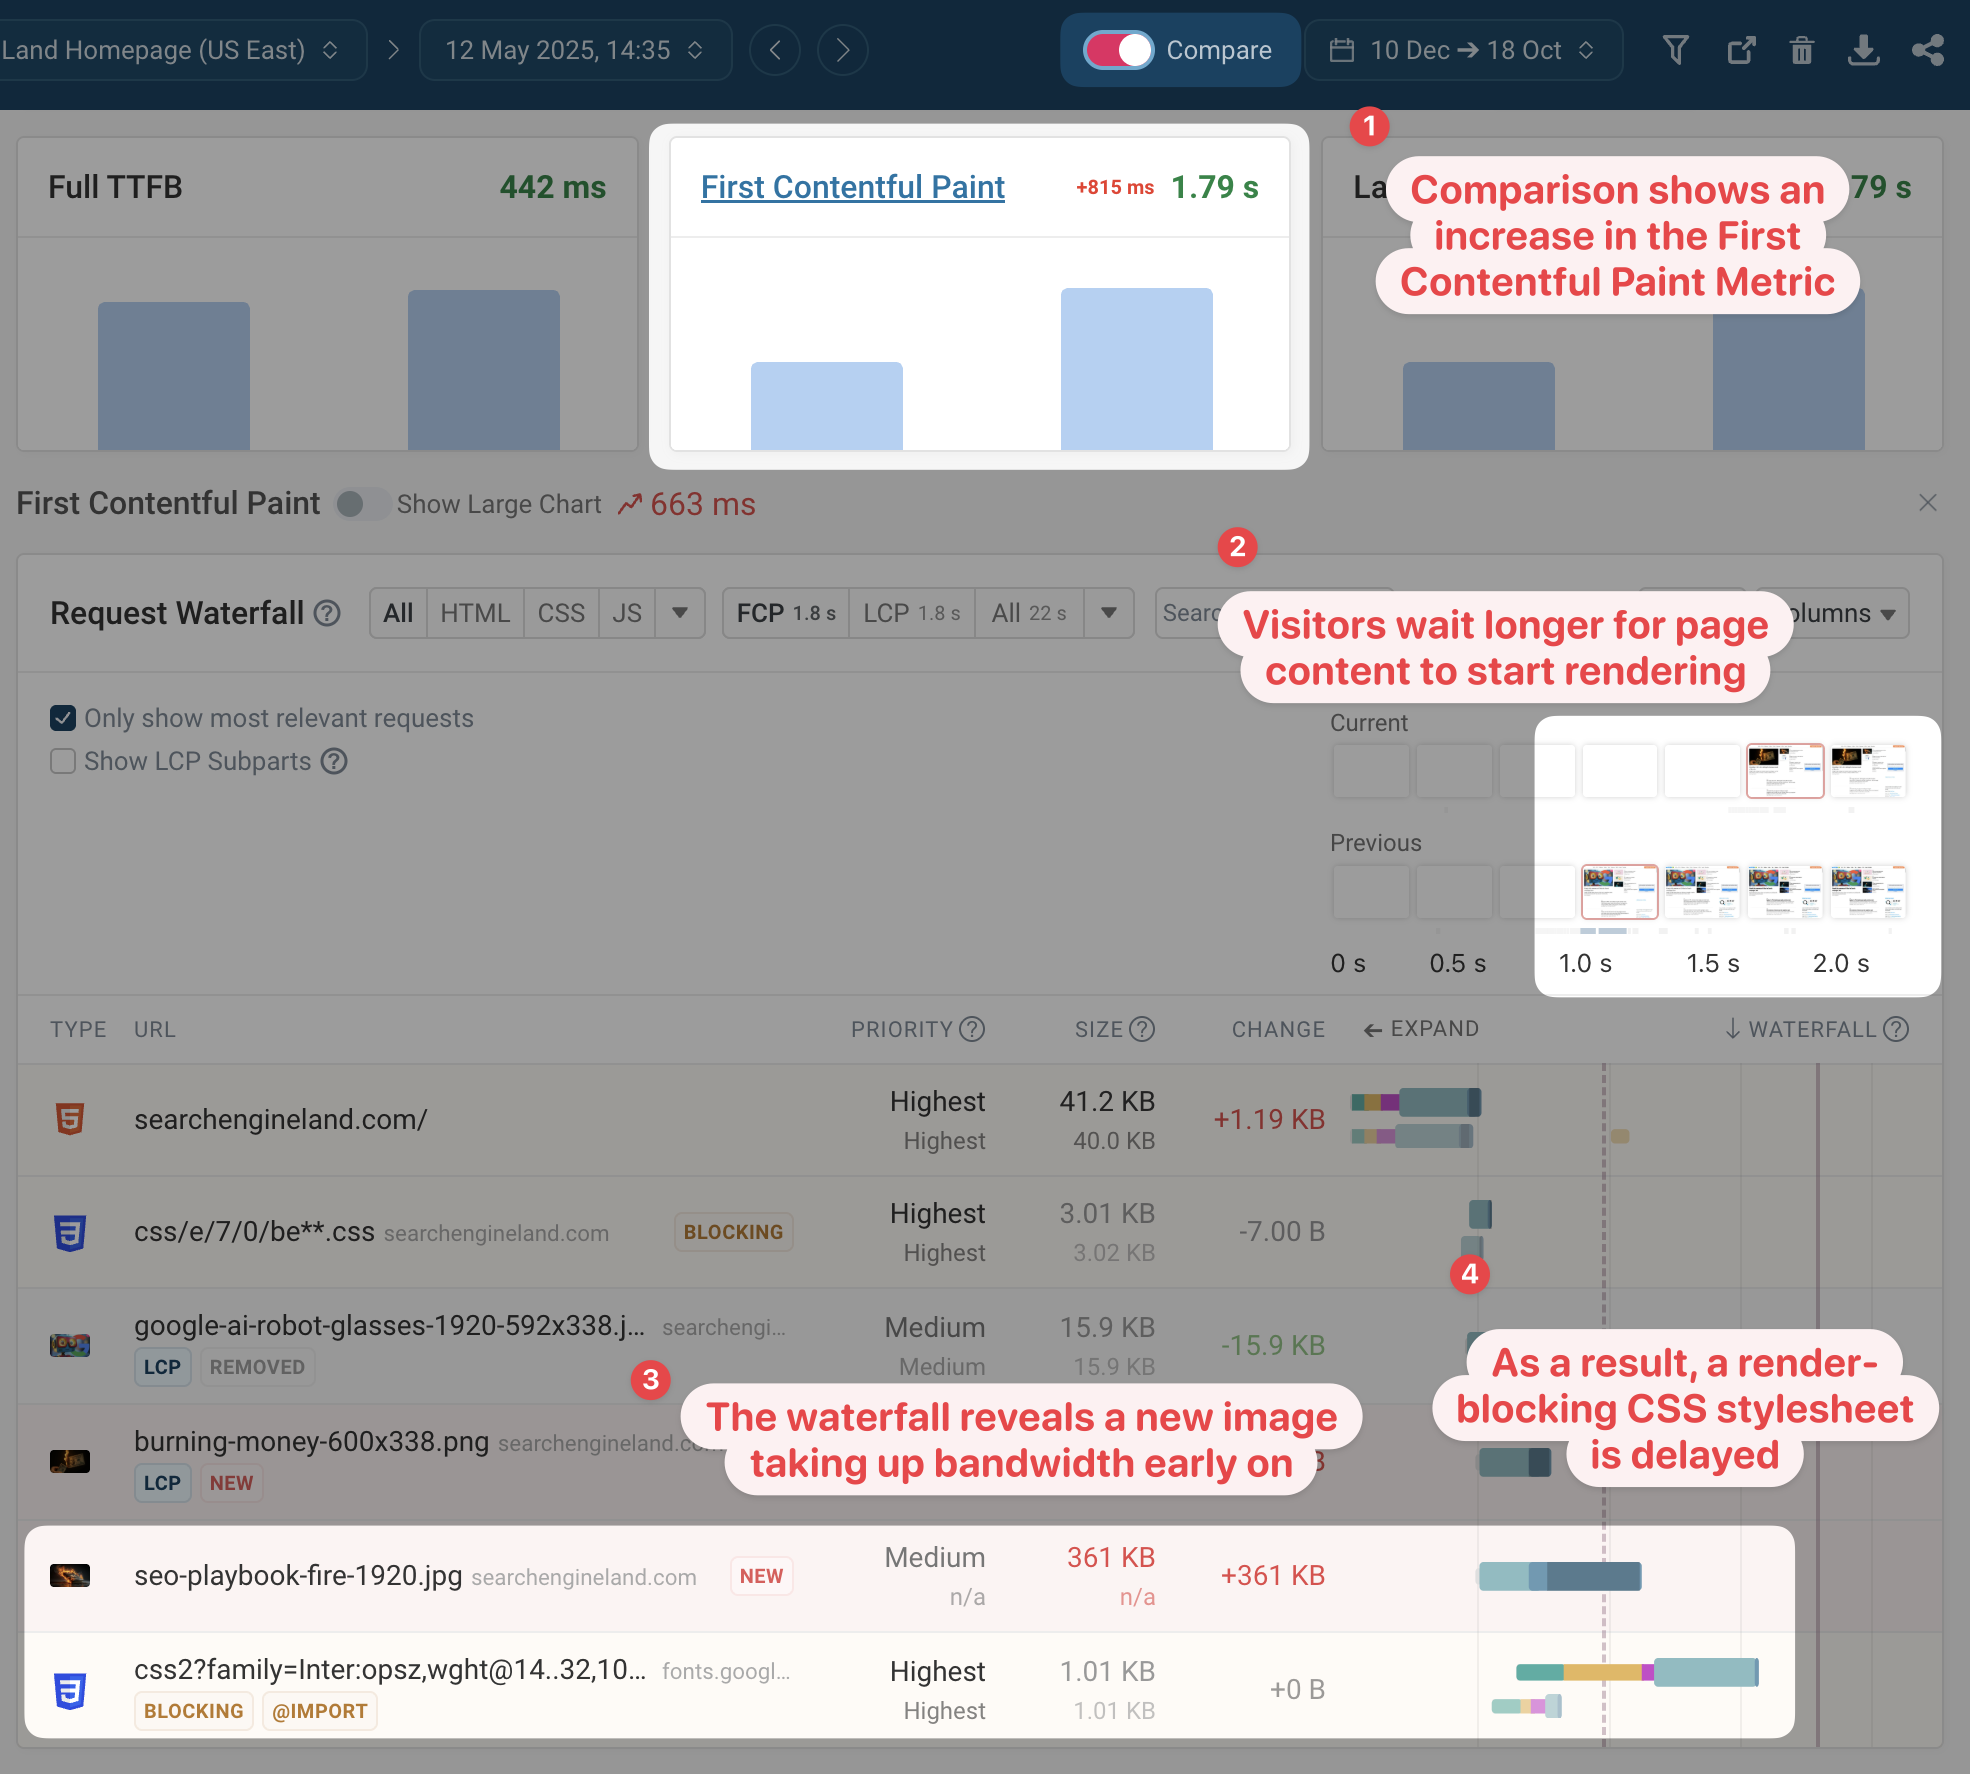
When a metric changes, DebugBear lets you view a before-and-after comparison between the two test results. For example, the next screenshot displays a regression in the First Contentful Paint (FCP) metric. The comparison reveals that new images were added to the page, competing for bandwidth with other page resources.
From the report, it’s clear that a CSS file that previously took 255 milliseconds to load now takes 915 milliseconds. Since stylesheets are required to render page content, this means the page now loads more slowly, giving you better insight into what needs optimization.
Real User Data
When you see a change in real user metrics, there can be two causes:
- A shift in visitor characteristics or behavior, or
- A technical change on your website.
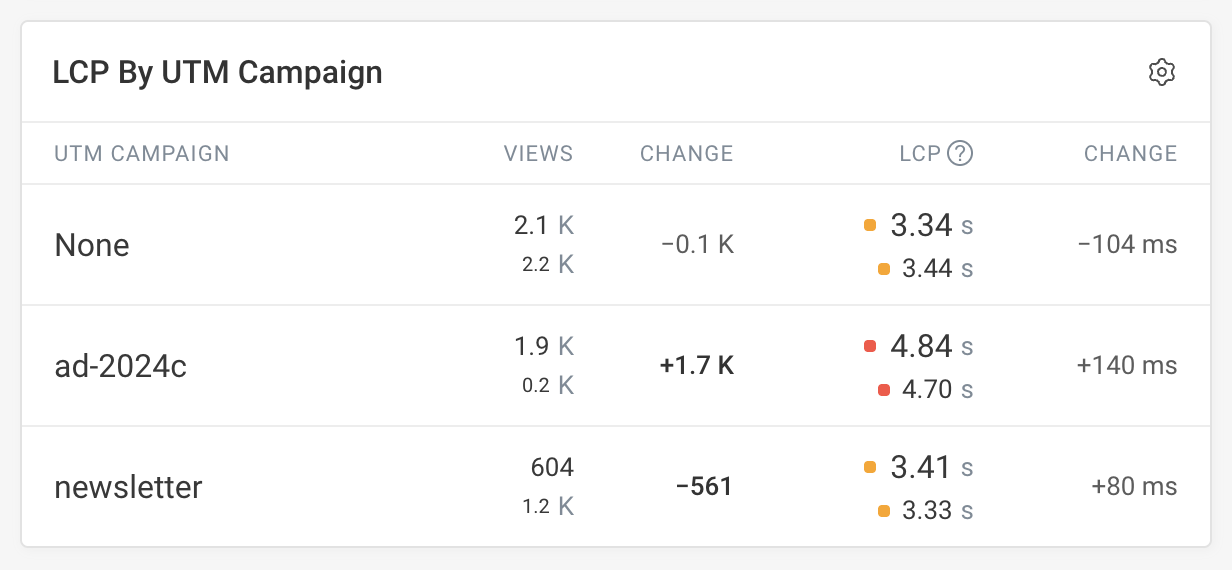
Launching an ad campaign, for example, often increases redirects, reduces cache hits, and shifts visitor demographics. When you see a regression in RUM data, the first step is to find out if the change was on your website or in your visitor’s browser. Check for view count changes in ad campaigns, referrer domains, or network speed to get a clearer picture.
If those visits have different performance compared to your typical visitors, then that suggests the repression is not due to a change on your website. However, you may still need to make changes on your website to better serve these visitor cohorts and deliver a good experience for them.
To identify the cause of a technical change, take a look at component breakdown metrics, such as LCP subparts. This helps you narrow down the cause of a regression, whether it is due to changes in server response time, new render-blocking resources, or the LCP image.
You can also check for shifts in page view properties, like different LCP element selectors or specific scripts that cause poor performance.
Conclusion
One-off page speed tests are a great starting point for optimizing performance. However, a monitoring tool like DebugBear can form the basis for a more comprehensive web performance strategy that helps you stay fast for the long term.
Get a free DebugBear trial on our website!
![]() (gg, yk)
(gg, yk)