See more visualizations like this on the Voronoi app.
BRICS vs G7: Comparing 2026 GDP Growth Forecasts
See visuals like this from many other data creators on our Voronoi app. Download it for free on iOS or Android and discover incredible data-driven charts from a variety of trusted sources.
Key Takeaways
- The eleven BRICS nations are forecast to see average growth of 3.8% in 2025 and 3.7% in 2026.
- Average growth across G7 countries is expected to …
See more visualizations like this on the Voronoi app.
BRICS vs G7: Comparing 2026 GDP Growth Forecasts
See visuals like this from many other data creators on our Voronoi app. Download it for free on iOS or Android and discover incredible data-driven charts from a variety of trusted sources.
Key Takeaways
- The eleven BRICS nations are forecast to see average growth of 3.8% in 2025 and 3.7% in 2026.
- Average growth across G7 countries is expected to be 1% this year, rising moderately to 1.1% next year, particularly due to slower growth in Europe.
Today, BRICS countries represent half of the global population, a coalition with growing economic heft.
Unlike many Western powers, many BRICS countries are seeing rapid GDP growth driven by significant investment, trade, and demographic change. In an increasingly multipolar world, this group is exerting more influence as it expands.
This graphic compares real GDP growth projections of BRICS vs G7 countries, based on data from the IMF’s World Economic Outlook October Update.
BRICS vs G7 Real GDP Growth
Below, we show GDP growth forecasts for BRICS nations in 2025 and 2026:
BRICS Real GDP Growth 2025P (%)Real GDP Growth 2026P (%) 🇧🇷 Brazil2.41.9 🇷🇺 Russia0.61.0 🇮🇳 India6.66.2 🇨🇳 China4.84.2 🇿🇦 South Africa1.11.2 🇸🇦 Saudi Arabia4.04.0 🇪🇬 Egypt4.34.5 🇦🇪 UAE4.85.0 🇪🇹 Ethiopia7.27.1 🇮🇩 Indonesia4.94.9 🇮🇷 Iran0.61.1 Average3.83.7
As we can see, India is projected to see one of the fastest growth rates across the bloc, at 6.6% in 2025 and 6.2% in 2026.
In China, 4.8% growth is forecast for 2025 as the country strengthens trade across Asia, Europe, and Africa. Like India, growth is forecast to decline in 2026.
On average, BRICS growth will exceed G7 rates by more than threefold in both 2025 and 2026—a stark contrast visible in the table below.
G7Real GDP Growth 2025P (%)Real GDP Growth 2026P (%) 🇨🇦 Canada1.21.5 🇫🇷 France0.70.9 🇩🇪 Germany0.20.9 🇮🇹 Italy0.50.8 🇯🇵 Japan1.10.6 🇬🇧 UK1.31.3 🇺🇸 U.S.2.02.1 Average1.01.2
With just 1% average growth for G7 countries, many countries are facing headwinds of aging populations and trade uncertainty.
Notably, Germany is forecast to see one of the world’s slowest GDP growth rates in 2025, rising just 0.2%. However, it is set to pick up to 0.9% in 2026—a trend mirrored in several other G7 nations.
Learn More on the Voronoi App 
To learn more about this topic, check out this graphic on BRICS share of GDP compared with G7 countries.
War
The World’s Most Militarized Economies by Three Metrics
In this graphic, we show the top countries by military spending in 2024, comparing total expenditures, per capita spending, and share of GDP.

Published
3 hours ago
on
November 3, 2025
The Top Countries by Military Spending in Three Metrics
See visuals like this from many other data creators on our Voronoi app. Download it for free on iOS or Android and discover incredible data-driven charts from a variety of trusted sources.
Key Takeaways
- America’s military budget is the largest in the world, at $949 billion in 2024.
- North Korea has the highest military spending per capita in purchasing power parity terms, at $9,929.
In 2024, the U.S., China, and Russia were the top countries by military spending, representing more than half of the global total.
Overall, global military expenditures hit a record $2.7 trillion, a 9.4% increase over the year. Amid rising geopolitical tensions, all five regions of the world increased their military spending for the second consecutive year.
This graphic shows the most militarized countries across three metrics, based on data from the Institute of Economics and Peace.
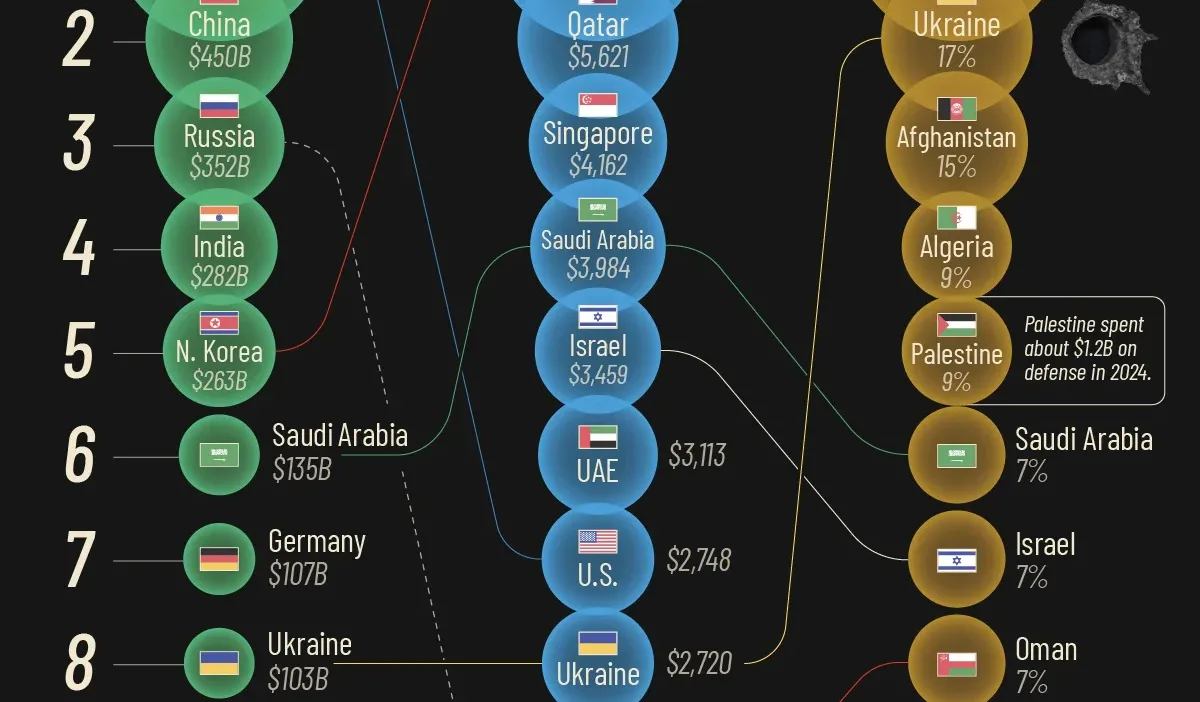
The Top 10 Countries by Military Spending in 2024
In the table below, we show the countries with the largest military budgets in 2024. Figures are represented in purchasing power parity (PPP) terms:
| Top 10 Countries | Total Military Expenditures 2024 (PPP) |
|---|---|
| 🇺🇸 United States | $949B |
| 🇨🇳 China | $450B |
| 🇷🇺 Russia | $352B |
| 🇮🇳 India | $282B |
| 🇰🇵 North Korea | $263B |
| 🇸🇦 Saudi Arabia | $135B |
| 🇩🇪 Germany | $107B |
| 🇺🇦 Ukraine | $103B |
| 🇬🇧 UK | $91B |
| 🇯🇵 Japan | $80B |
With a $949 billion budget, America has 1.5 million active duty personnel across 4,790 military sites globally.
China follows next, with $450 billion in spending. Overall, Taiwan stands as a top priority for the People’s Liberation Army (PLA), with widespread U.S. intelligence suggesting that Xi Jinping wants to be capable of seizing the country by force by 2027.
Ranking in third is Russia, which increased expenditures by an estimated 38% in 2024 amid ongoing conflict in Ukraine.
The Top 10 Countries by Military Spending Per Capita
When it comes to military spending on a per capita basis, North Korea ranks first by a wide margin.
| Top 10 Countries | Military Expenditures Per Capita 2024 (PPP) |
|---|---|
| 🇰🇵 North Korea | $9,929 |
| 🇶🇦 Qatar | $5,621 |
| 🇸🇬 Singapore | $4,162 |
| 🇸🇦 Saudi Arabia | $3,984 |
| 🇮🇱 Israel | $3,459 |
| 🇦🇪 UAE | $3,113 |
| 🇺🇸 U.S. | $2,748 |
| 🇺🇦 Ukraine | $2,720 |
| 🇴🇲 Oman | $2,572 |
| 🇰🇼 Kuwait | $2,485 |
Qatar, a small gulf state bordering Saudi Arabia, stands in second, driven by broad-based modernization of its military, navy, and air force.
Interestingly, Singapore comes in third by this measure, despite being known as a neutral state. In fact, Singapore has consistently spent around 3% of GDP on defense for decades, higher than most European countries.
The Top 10 Countries by Military Spending as a Share of GDP
Once again, North Korea leads globally in terms of military spending as a share of GDP, reaching 34% in 2024.
| Top 10 Countries | Military Expenditures % of GDP 2024 (PPP) |
|---|---|
| 🇰🇵 North Korea | 34% |
| 🇺🇦 Ukraine | 17% |
| 🇦🇫 Afghanistan | 15% |
| 🇩🇿 Algeria | 9% |
| 🇵🇸 Palestine | 9% |
| 🇸🇦 Saudi Arabia | 7% |
| 🇮🇱 Israel | 7% |
| 🇴🇲 Oman | 7% |
| 🇲🇱 Mali | 6% |
| 🇷🇺 Russia | 6% |
Standing in second place is Ukraine, at 17% of GDP, totalling $103 billion.
In comparison, Russia’s military budget was 6% of GDP, at $352 billion in 2024. Today, Russia has the largest army in Europe, with 1.3 million active duty personnel, while Ukraine follows with 900,000 active troops.
Learn More on the Voronoi App
To learn more about this topic, check out this graphic on military spending by country in 2024.
United States
Mapped: Median Rent Price by U.S. State
Explore how median rent by state varies across the U.S. in 2024, with coastal and mountain states far above the national median.

Published
5 hours ago
on
November 3, 2025
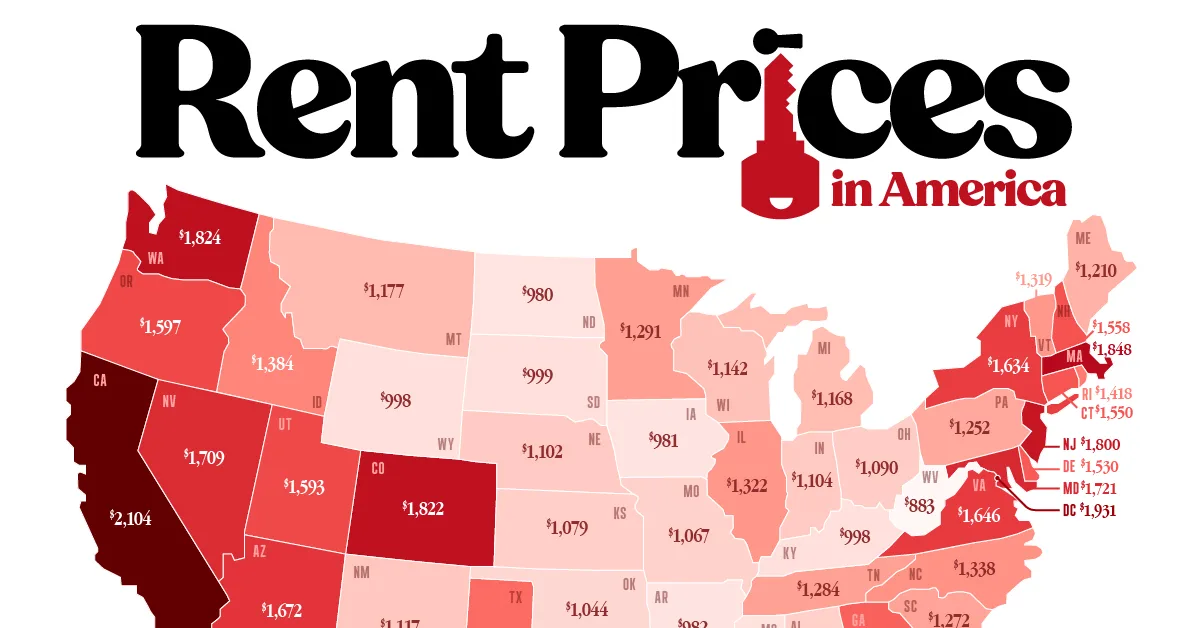
Mapped: Median Rent Price by U.S. State
See visuals like this from many other data creators on our Voronoi app. Download it for free on iOS or Android and discover incredible data-driven charts from a variety of trusted sources.
Key Takeaways
- Coastal states have the highest median rents with California leading at $2,104, followed by Hawaii ($1,942) and Massachusetts ($1,848). The District of Columbia ranks third among the states at $1,931.
- While coastal states tend to have the highest rents, Colorado ($1,822) and Nevada ($1,709) are among the few landlocked states far above the national median of $1,487.
Across the United States, median rent varies by more than $1,000 between the highest and lowest states.
This map compares the median gross rent (including utilities) in each state in 2024 using data from the Census Bureau’s American Community Survey 2024 1-Year Estimates, providing a snapshot of rental affordability nationwide.
U.S. States with the Highest Rent
The Census Bureau data shows that California has the highest median rent at $2,104, edging out Hawaii ($1,942) and Massachusetts ($1,848).
The District of Columbia—while not a state—ranks third overall at $1,931, reflecting its dense urban housing market and limited supply.
The data table below shows the median rent by state in 2024, along with the District of Columbia and the U.S. national median:
RankStateMedian gross rent in 2024 (includes utilities) 1California$2,104 2Hawaii$1,942 3District of Columbia$1,931 4Massachusetts$1,848 5Washington$1,824 6Colorado$1,822 7Florida$1,812 8New Jersey$1,800 9Maryland$1,721 10Nevada$1,709 11Arizona$1,672 12Virginia$1,646 13New York$1,634 14Oregon$1,597 15Utah$1,593 16New Hampshire$1,558 17Connecticut$1,550 18Delaware$1,530 19Georgia$1,506 20Texas$1,475 21Alaska$1,444 22Rhode Island$1,418 23Idaho$1,384 24North Carolina$1,338 25Illinois$1,322 26Vermont$1,319 27Minnesota$1,291 28Tennessee$1,284 29South Carolina$1,272 30Pennsylvania$1,252 31Maine$1,210 32Montana$1,177 33Michigan$1,168 34Wisconsin$1,142 35New Mexico$1,117 36Indiana$1,104 37Nebraska$1,102 38Ohio$1,090 39Kansas$1,079 40Alabama$1,077 41Missouri$1,067 42Louisiana$1,064 43Oklahoma$1,044 44South Dakota$999 45Kentucky$998 46Wyoming$998 47Mississippi$990 48Arkansas$982 49Iowa$981 50North Dakota$980 51West Virginia$883 –U.S. Median Rent$1,487
Other high-rent states include Washington ($1,824) and Colorado ($1,822), underscoring how tech hubs and lifestyle destinations command premium rents.
Rents remain particularly elevated across the West Coast and the Northeast Corridor as states like New Jersey ($1,794), New York ($1,771), and Oregon ($1,765) continue to face upward price pressure due to limited housing inventory and strong demand near metropolitan centers.
States With the Lowest Median Rent
The lowest median rents are found in West Virginia ($883), followed by North Dakota ($980) and Iowa ($981).
Even when including utilities, median rent in these states is $500 below the national median of $1,487, underscoring their housing cost advantage.
Many Midwestern states, including Wyoming ($998) and South Dakota ($999), also maintain some of the lowest rents in the nation, less than half of California’s.
However, lower rents often correspond with slower wage growth and fewer high-paying job opportunities, balancing the affordability equation.
Learn More on the Voronoi App
To learn more about the state of U.S. housing affordability, check out this graphic which shows the average mortgage rate by state.