Every Country’s GDP Growth Forecast for 2025
See visuals like this from many other data creators on our Voronoi app. Download it for free on iOS or Android and discover incredible data-driven charts from a variety of trusted sources.
Key Takeaways
- Real global GDP growth is projected to be 3.2% in 2025, according to the International Monetary Fund’s (IMF) October update.
- In America, GDP growth is forecast to slow to 2% this year, but rise slightly to 2.1% in 2026.
In its latest global economic growth forecast, the IMF sees world real GDP rising 3.2% in 2025. This represents a modest but meaning…
Every Country’s GDP Growth Forecast for 2025
See visuals like this from many other data creators on our Voronoi app. Download it for free on iOS or Android and discover incredible data-driven charts from a variety of trusted sources.
Key Takeaways
- Real global GDP growth is projected to be 3.2% in 2025, according to the International Monetary Fund’s (IMF) October update.
- In America, GDP growth is forecast to slow to 2% this year, but rise slightly to 2.1% in 2026.
In its latest global economic growth forecast, the IMF sees world real GDP rising 3.2% in 2025. This represents a modest but meaningful upgrade from its April projection of 2.8%.
In many ways, tariffs have not impacted the global economy as much as anticipated. At the same time, asset markets are being fueled by the AI rally, further supporting growth.
This graphic shows GDP growth projections in 2025, based on data from the IMF’s October 2025 World Economic Outlook.
The Global Economic Growth Forecast by Country
Here are real GDP growth forecasts across 191 economies in 2025:
| Country | Real GDP Growth Projection 2025 (%) |
|---|---|
| 🇸🇸 South Sudan | 24.3 |
| 🇱🇾 Libya | 15.6 |
| 🇬🇾 Guyana | 10.3 |
| 🇮🇪 Ireland | 9.1 |
| 🇰🇬 Kyrgyz Republic | 8.0 |
| 🇹🇯 Tajikistan | 7.5 |
| 🇪🇹 Ethiopia | 7.2 |
| 🇬🇪 Georgia | 7.2 |
| 🇬🇳 Guinea | 7.2 |
| 🇷🇼 Rwanda | 7.1 |
| 🇧🇯 Benin | 7.0 |
| 🇧🇹 Bhutan | 6.8 |
| 🇺🇿 Uzbekistan | 6.8 |
| 🇮🇳 India | 6.6 |
| 🇳🇪 Niger | 6.6 |
| 🇻🇳 Vietnam | 6.5 |
| 🇨🇮 Côte d’Ivoire | 6.4 |
| 🇺🇬 Uganda | 6.4 |
| 🇩🇯 Djibouti | 6.0 |
| 🇸🇳 Senegal | 6.0 |
| 🇹🇿 Tanzania | 6.0 |
| 🇬🇲 The Gambia | 6.0 |
| 🇿🇼 Zimbabwe | 6.0 |
| 🇰🇿 Kazakhstan | 5.9 |
| 🇿🇲 Zambia | 5.8 |
| 🇲🇳 Mongolia | 5.5 |
| 🇵🇭 Philippines | 5.4 |
| 🇨🇩 Democratic Republic of the Congo | 5.3 |
| 🇨🇻 Cabo Verde | 5.2 |
| 🇹🇬 Togo | 5.2 |
| 🇬🇼 Guinea-Bissau | 5.1 |
| 🇲🇱 Mali | 5.0 |
| 🇮🇩 Indonesia | 4.9 |
| 🇦🇲 Armenia | 4.8 |
| 🇰🇭 Cambodia | 4.8 |
| 🇨🇳 China | 4.8 |
| 🇰🇪 Kenya | 4.8 |
| 🇲🇻 Maldives | 4.8 |
| 🇦🇪 United Arab Emirates | 4.8 |
| 🇵🇬 Papua New Guinea | 4.7 |
| 🇱🇷 Liberia | 4.6 |
| 🇦🇷 Argentina | 4.5 |
| 🇲🇾 Malaysia | 4.5 |
| 🇵🇼 Palau | 4.5 |
| 🇧🇮 Burundi | 4.4 |
| 🇲🇦 Morocco | 4.4 |
| 🇵🇾 Paraguay | 4.4 |
| 🇸🇱 Sierra Leone | 4.4 |
| 🇻🇨 St. Vincent and the Grenadines | 4.4 |
| 🇪🇬 Egypt | 4.3 |
| 🇸🇿 Eswatini | 4.3 |
| 🇳🇵 Nepal | 4.3 |
| 🇩🇲 Dominica | 4.2 |
| 🇧🇫 Burkina Faso | 4.0 |
| 🇬🇭 Ghana | 4.0 |
| 🇲🇷 Mauritania | 4.0 |
| 🇵🇦 Panama | 4.0 |
| 🇸🇦 Saudi Arabia | 4.0 |
| 🇰🇮 Kiribati | 3.9 |
| 🇽🇰 Kosovo | 3.9 |
| 🇲🇹 Malta | 3.9 |
| 🇳🇬 Nigeria | 3.9 |
| 🇸🇨 Seychelles | 3.9 |
| 🇹🇱 Timor-Leste | 3.9 |
| 🇧🇩 Bangladesh | 3.8 |
| 🇨🇲 Cameroon | 3.8 |
| 🇰🇲 Comoros | 3.8 |
| 🇬🇹 Guatemala | 3.8 |
| 🇭🇳 Honduras | 3.8 |
| 🇲🇬 Madagascar | 3.8 |
| 🇹🇼 Taiwan | 3.7 |
| 🇨🇷 Costa Rica | 3.6 |
| 🇳🇦 Namibia | 3.6 |
| 🇱🇦 Lao P.D.R. | 3.5 |
| 🇹🇷 Türkiye | 3.5 |
| 🇦🇱 Albania | 3.4 |
| 🇩🇿 Algeria | 3.4 |
| 🇲🇰 North Macedonia | 3.4 |
| 🇹🇩 Chad | 3.3 |
| 🇬🇩 Grenada | 3.3 |
| 🇪🇨 Ecuador | 3.2 |
| 🇫🇯 Fiji | 3.2 |
| 🇲🇺 Mauritius | 3.2 |
| 🇲🇪 Montenegro | 3.2 |
| 🇵🇱 Poland | 3.2 |
| 🇸🇩 Sudan | 3.2 |
| 🇭🇷 Croatia | 3.1 |
| 🇦🇿 Azerbaijan | 3.0 |
| 🇧🇬 Bulgaria | 3.0 |
| 🇨🇫 Central African Republic | 3.0 |
| 🇩🇴 Dominican Republic | 3.0 |
| 🇳🇮 Nicaragua | 3.0 |
| 🇸🇴 Somalia | 3.0 |
| 🇹🇻 Tuvalu | 3.0 |
| 🇧🇭 Bahrain | 2.9 |
| 🇨🇾 Cyprus | 2.9 |
| 🇴🇲 Oman | 2.9 |
| 🇵🇪 Peru | 2.9 |
| 🇶🇦 Qatar | 2.9 |
| 🇸🇹 São Tomé and Príncipe | 2.9 |
| 🇪🇸 Spain | 2.9 |
| 🇧🇧 Barbados | 2.7 |
| 🇯🇴 Jordan | 2.7 |
| 🇱🇹 Lithuania | 2.7 |
| 🇵🇰 Pakistan | 2.7 |
| 🇨🇬 Republic of Congo | 2.7 |
| 🇼🇸 Samoa | 2.7 |
| 🇸🇧 Solomon Islands | 2.7 |
| 🇸🇷 Suriname | 2.7 |
| 🇹🇴 Tonga | 2.7 |
| 🇰🇼 Kuwait | 2.6 |
| 🇲🇴 Macao SAR | 2.6 |
| 🇦🇬 Antigua and Barbuda | 2.5 |
| 🇨🇱 Chile | 2.5 |
| 🇨🇴 Colombia | 2.5 |
| 🇸🇻 El Salvador | 2.5 |
| 🇮🇱 Israel | 2.5 |
| 🇲🇭 Marshall Islands | 2.5 |
| 🇲🇿 Mozambique | 2.5 |
| 🇹🇳 Tunisia | 2.5 |
| 🇺🇾 Uruguay | 2.5 |
| 🇦🇩 Andorra | 2.4 |
| 🇧🇦 Bosnia and Herzegovina | 2.4 |
| 🇧🇷 Brazil | 2.4 |
| 🇭🇰 Hong Kong SAR | 2.4 |
| 🇲🇼 Malawi | 2.4 |
| 🇷🇸 Serbia | 2.4 |
| 🇱🇨 St. Lucia | 2.4 |
| 🇳🇴 Norway | 2.3 |
| 🇹🇲 Turkmenistan | 2.3 |
| 🇸🇬 Singapore | 2.2 |
| 🇧🇸 The Bahamas | 2.2 |
| 🇦🇴 Angola | 2.1 |
| 🇧🇾 Belarus | 2.1 |
| 🇯🇲 Jamaica | 2.1 |
| 🇳🇷 Nauru | 2.1 |
| 🇦🇼 Aruba | 2.0 |
| 🇬🇷 Greece | 2.0 |
| 🇹🇭 Thailand | 2.0 |
| 🇺🇦 Ukraine | 2.0 |
| 🇺🇸 United States | 2.0 |
| 🇬🇦 Gabon | 1.9 |
| 🇵🇹 Portugal | 1.9 |
| 🇦🇺 Australia | 1.8 |
| 🇧🇳 Brunei Darussalam | 1.8 |
| 🇩🇰 Denmark | 1.8 |
| 🇲🇩 Moldova | 1.7 |
| 🇰🇳 St. Kitts and Nevis | 1.7 |
| 🇻🇺 Vanuatu | 1.7 |
| 🇧🇿 Belize | 1.5 |
| 🇮🇸 Iceland | 1.4 |
| 🇱🇸 Lesotho | 1.4 |
| 🇳🇱 The Netherlands | 1.4 |
| 🇬🇧 United Kingdom | 1.3 |
| 🇨🇦 Canada | 1.2 |
| 🇨🇿 Czech Republic | 1.2 |
| 🇱🇺 Luxembourg | 1.2 |
| 🇧🇪 Belgium | 1.1 |
| 🇯🇵 Japan | 1.1 |
| 🇸🇮 Slovenia | 1.1 |
| 🇿🇦 South Africa | 1.1 |
| 🇱🇻 Latvia | 1.0 |
| 🇱🇮 Liechtenstein | 1.0 |
| 🇲🇽 Mexico | 1.0 |
| 🇫🇲 Micronesia | 1.0 |
| 🇷🇴 Romania | 1.0 |
| 🇸🇲 San Marino | 1.0 |
| 🇹🇹 Trinidad and Tobago | 1.0 |
| 🇰🇷 Korea | 0.9 |
| 🇸🇰 Slovak Republic | 0.9 |
| 🇨🇭 Switzerland | 0.9 |
| 🇳🇿 New Zealand | 0.8 |
| 🇫🇷 France | 0.7 |
| 🇸🇪 Sweden | 0.7 |
| 🇧🇴 Bolivia | 0.6 |
| 🇭🇺 Hungary | 0.6 |
| 🇮🇷 Iran | 0.6 |
| 🇷🇺 Russia | 0.6 |
| 🇪🇪 Estonia | 0.5 |
| 🇫🇮 Finland | 0.5 |
| 🇮🇶 Iraq | 0.5 |
| 🇮🇹 Italy | 0.5 |
| 🇻🇪 Venezuela | 0.5 |
| 🇦🇹 Austria | 0.3 |
| 🇩🇪 Germany | 0.2 |
| 🇵🇷 Puerto Rico | -0.8 |
| 🇧🇼 Botswana | -0.9 |
| 🇾🇪 Yemen | -1.5 |
| 🇬🇶 Equatorial Guinea | -1.6 |
| 🇲🇲 Myanmar | -2.7 |
| 🇭🇹 Haiti | -3.1 |
As the above table shows, five of the top 10 fastest growth rates are projected to be in Africa.
Notably, the resumption of oil exports is set to boost South Sudan’s economy by 24.3%. Beyond Africa, Guyana’s ongoing oil boom continues to drive its double-digit growth in 2025, while front-loaded pharmaceutical exports are fueling Ireland’s projected 9.1% rise.
America’s economy is expected to grow 2% in 2025, as the full-effects of tariffs have yet to hit consumers and businesses. In 2026, GDP growth is set to rise moderately to 2.1%, however several risks—from rising inflation to an asset bubble correction—could shift the outcome.
In China, growth is set to be 4.8%, down from 5% in 2024. Despite U.S. tariffs and weak domestic consumption, its economy has been resilient as it expands exports to other global regions and strategically focuses on advanced manufacturing.
Learn More on the Voronoi App 
To learn more about this topic, check out this graphic on the $124 trillion world economy in 2026.
United States
Mapped: GDP Growth by U.S. State (1998-2024)
Since 1998, where has GDP growth by U.S. state been highest? See how energy and tech hubs outpaced the rest in this map.

Published
1 day ago
on
November 4, 2025
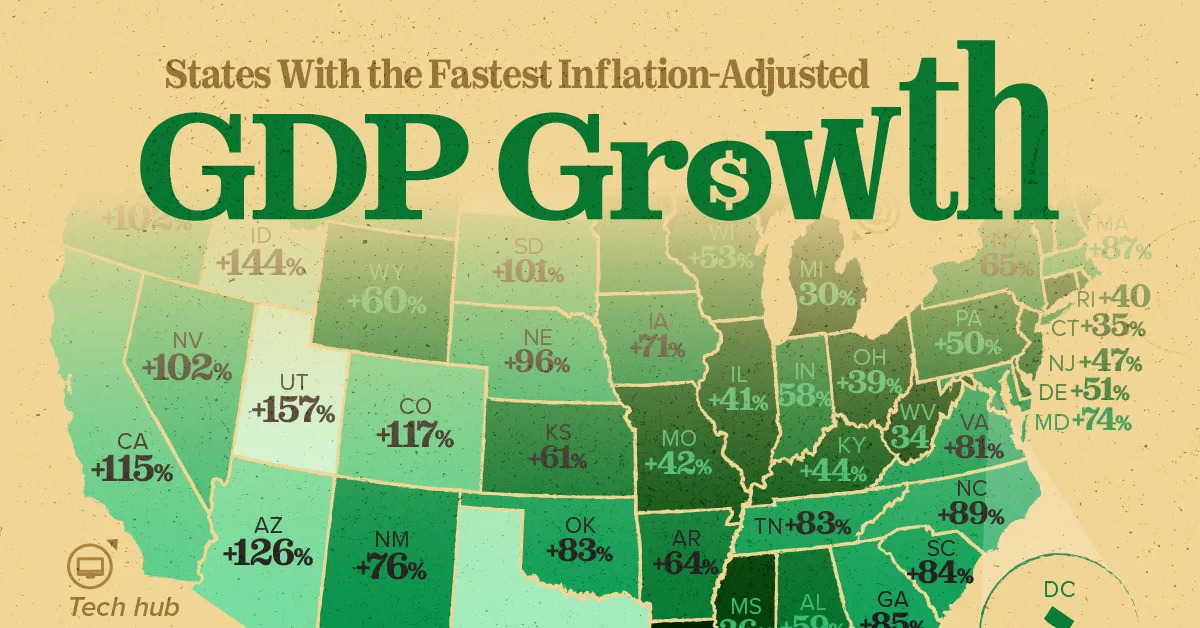
Real GDP Growth by U.S. State (1998-2024)
See visuals like this from many other data creators on our Voronoi app. Download it for free on iOS or Android and discover incredible data-driven charts from a variety of trusted sources.
Key Takeaways
- North Dakota (+164%) and Texas (+141%) posted the most real GDP growth since 1998, powered largely by the shale boom.
- Several Rust Belt and industrial states—including Louisiana, Michigan, and West Virginia—lagged with growth under 35% over the same period.
The 1990s were a different time. Dial-up internet, gas costing a dollar, and many states still leaning on manufacturing.
Even then, new tech clusters and improved drilling methods were starting to reshape the map, setting up today’s energy-rich and tech-focused states for the strongest economies.
The visualization ranks all 50 states and the District of Columbia by inflation-adjusted GDP growth between 1998–2024. Data for real GDP growth by U.S. state is sourced from Bureau of Economic Analysis.
ℹ️ Real GDP growth measured from chained 2017 dollars.
America’s Shale Boom in One Map
North Dakota’s economy more than doubled thanks to the Bakken shale boom, which lifted its real output by 164%—twice the U.S. average.
Texas, already the nation’s largest oil-producing state, followed closely with 141% growth.
RankStateState CodeGDP Growth (1998–2024)CAGR2024 GDP (Billions) 1North DakotaND164%3.8%$80,058 2UtahUT157%3.7%$299,471 3IdahoID144%3.5%$129,018 4TexasTX141%3.4%$2,769,766 5WashingtonWA134%3.3%$856,014 6ArizonaAZ126%3.2%$570,089 7ColoradoCO117%3.0%$557,633 8CaliforniaCA115%3.0%$4,048,108 9FloridaFL113%3.0%$1,726,710 10OregonOR102%2.7%$330,250 11NevadaNV102%2.7%$269,011 12South DakotaSD101%2.7%$76,796 13NebraskaNE96%2.6%$189,243 14MontanaMT93%2.6%$78,441 15North CarolinaNC89%2.5%$844,209 16MassachusettsMA87%2.4%$778,523 17GeorgiaGA85%2.4%$881,508 18South CarolinaSC84%2.4%$357,074 19OklahomaOK83%2.4%$263,695 20TennesseeTN83%2.3%$561,201 21VirginiaVA81%2.3%$761,734 22New MexicoNM76%2.2%$147,085 23MarylandMD74%2.2%$546,028 24New HampshireNH73%2.1%$119,337 25IowaIA71%2.1%$265,795 26MinnesotaMN68%2.0%$507,688 27New YorkNY65%2.0%$2,322,139 28District of ColumbiaDC65%1.9%$184,298 29ArkansasAR64%1.9%$188,340 30VermontVT63%1.9%$46,276 31MaineME62%1.9%$99,174 32KansasKS61%1.9%$230,522 33WyomingWY60%1.8%$51,498 34AlabamaAL59%1.8%$325,345 35IndianaIN58%1.8%$519,517 36HawaiiHI56%1.7%$117,627 37WisconsinWI53%1.6%$453,299 38DelawareDE51%1.6%$110,972 39PennsylvaniaPA50%1.6%$1,007,874 40New JerseyNJ47%1.5%$846,000 41KentuckyKY44%1.4%$295,375 42MissouriMO42%1.4%$448,714 43IllinoisIL41%1.3%$1,148,106 44Rhode IslandRI40%1.3%$80,381 45OhioOH39%1.3%$923,141 46AlaskaAK39%1.3%$71,567 47MississippiMS36%1.2%$158,192 48ConnecticutCT35%1.2%$356,835 49West VirginiaWV34%1.1%$106,475 50MichiganMI30%1.0%$702,467 51LouisianaLA23%0.8%$329,173 N/AU.S.USA81%2.3%$29,298,013
New Mexico and Oklahoma also landed in the top 20. Cheap feedstock, rising exports of liquefied natural gas (LNG), and associated midstream build-out helped these states capture much of the value created by soaring U.S. energy production.
Tech & Tourism Hubs Sustain Rapid Expansion
Utah (+157%), Idaho (+144%), and Washington (+134%) show how a diversified tech sector can supercharge state-level GDP.
Microsoft’s cloud push, Idaho’s semiconductor fabs, and Utah’s “Silicon Slopes” collectively fostered high-wage job growth and attracted inbound migration.
Even the giant economies of California (+115%) and Florida (+113%) managed to outpace the national average rate of GDP growth by U.S. states. This shows how tech and professional-services clusters spill over into broader economic activity.
Rust Belt and Coastal Laggards
Manufacturing-heavy states in the Midwest and Appalachia largely underperformed. Michigan (+30%) and West Virginia (+34%) never fully recovered the industrial output lost after the early-2000s recession and the Great Financial Crisis.
Connecticut (+35%) and New Jersey (+47%) illustrate how high costs and slow demographic growth weighed on East Coast economies.
Louisiana, hit by multiple hurricanes and refinery shutdowns, posted the slowest gain at just 23%, one-quarter of the national pace.
Learn More on the Voronoi App
If you enjoyed today’s post, check out The World’s Largest Economies, Including U.S. States on Voronoi, the new app from Visual Capitalist.
United States
Mapped: Median Rent Price by U.S. State
Explore how median rent by state varies across the U.S. in 2024, with coastal and mountain states far above the national median.

Published
2 days ago
on
November 3, 2025
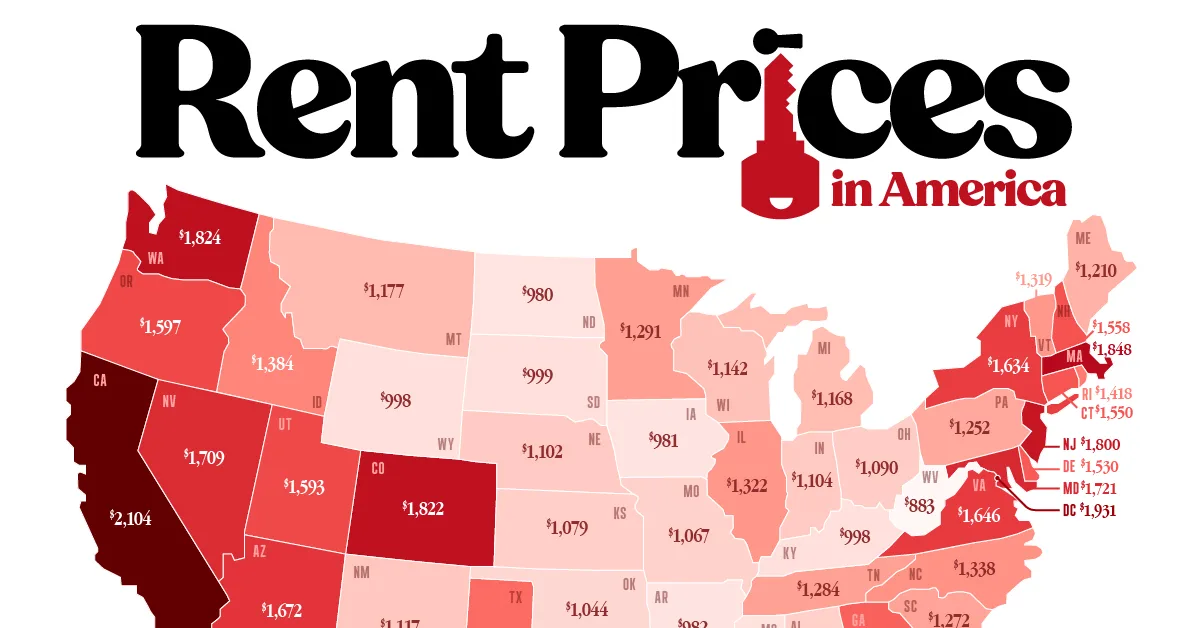
Mapped: Median Rent Price by U.S. State
See visuals like this from many other data creators on our Voronoi app. Download it for free on iOS or Android and discover incredible data-driven charts from a variety of trusted sources.
Key Takeaways
- Coastal states have the highest median rents with California leading at $2,104, followed by Hawaii ($1,942) and Massachusetts ($1,848). The District of Columbia ranks third among the states at $1,931.
- While coastal states tend to have the highest rents, Colorado ($1,822) and Nevada ($1,709) are among the few landlocked states far above the national median of $1,487.
Across the United States, median rent varies by more than $1,000 between the highest and lowest states.
This map compares the median gross rent (including utilities) in each state in 2024 using data from the Census Bureau’s American Community Survey 2024 1-Year Estimates, providing a snapshot of rental affordability nationwide.
U.S. States with the Highest Rent
The Census Bureau data shows that California has the highest median rent at $2,104, edging out Hawaii ($1,942) and Massachusetts ($1,848).
The District of Columbia—while not a state—ranks third overall at $1,931, reflecting its dense urban housing market and limited supply.
The data table below shows the median rent by state in 2024, along with the District of Columbia and the U.S. national median:
RankStateMedian gross rent in 2024 (includes utilities) 1California$2,104 2Hawaii$1,942 3District of Columbia$1,931 4Massachusetts$1,848 5Washington$1,824 6Colorado$1,822 7Florida$1,812 8New Jersey$1,800 9Maryland$1,721 10Nevada$1,709 11Arizona$1,672 12Virginia$1,646 13New York$1,634 14Oregon$1,597 15Utah$1,593 16New Hampshire$1,558 17Connecticut$1,550 18Delaware$1,530 19Georgia$1,506 20Texas$1,475 21Alaska$1,444 22Rhode Island$1,418 23Idaho$1,384 24North Carolina$1,338 25Illinois$1,322 26Vermont$1,319 27Minnesota$1,291 28Tennessee$1,284 29South Carolina$1,272 30Pennsylvania$1,252 31Maine$1,210 32Montana$1,177 33Michigan$1,168 34Wisconsin$1,142 35New Mexico$1,117 36Indiana$1,104 37Nebraska$1,102 38Ohio$1,090 39Kansas$1,079 40Alabama$1,077 41Missouri$1,067 42Louisiana$1,064 43Oklahoma$1,044 44South Dakota$999 45Kentucky$998 46Wyoming$998 47Mississippi$990 48Arkansas$982 49Iowa$981 50North Dakota$980 51West Virginia$883 –U.S. Median Rent$1,487
Other high-rent states include Washington ($1,824) and Colorado ($1,822), underscoring how tech hubs and lifestyle destinations command premium rents.
Rents remain particularly elevated across the West Coast and the Northeast Corridor as states like New Jersey ($1,794), New York ($1,771), and Oregon ($1,765) continue to face upward price pressure due to limited housing inventory and strong demand near metropolitan centers.
States With the Lowest Median Rent
The lowest median rents are found in West Virginia ($883), followed by North Dakota ($980) and Iowa ($981).
Even when including utilities, median rent in these states is $500 below the national median of $1,487, underscoring their housing cost advantage.
Many Midwestern states, including Wyoming ($998) and South Dakota ($999), also maintain some of the lowest rents in the nation, less than half of California’s.
However, lower rents often correspond with slower wage growth and fewer high-paying job opportunities, balancing the affordability equation.
Learn More on the Voronoi App
To learn more about the state of U.S. housing affordability, check out this graphic which shows the average mortgage rate by state.