See more visuals like this on the Voronoi app.
Visualized: U.S. Inflation by Category in 2025
See visuals like this from many other data creators on our Voronoi app. Download it for free on iOS or Android and discover incredible data-driven charts from a variety of trusted sources.
Key Takeaways
- Inflation remains uneven across categories, with food items like beef and essentials such as car maintenance showing the strongest upward pressure.
- …
See more visuals like this on the Voronoi app.
Visualized: U.S. Inflation by Category in 2025
See visuals like this from many other data creators on our Voronoi app. Download it for free on iOS or Android and discover incredible data-driven charts from a variety of trusted sources.
Key Takeaways
- Inflation remains uneven across categories, with food items like beef and essentials such as car maintenance showing the strongest upward pressure.
- Service-related costs, including home insurance, healthcare, and utilities, continue to rise faster than most goods.
Even as headline inflation stabilizes, the cost of everyday items and services in the U.S. continues to shift unevenly across categories. For example, while beef has gotten more expensive, eggs have gotten cheaper.
In this graphic, we break down inflation by product type, revealing where Americans are seeing the biggest price changes.
Data & Discussion
The data for this visualization comes from the Bureau of Labor Statistics (BLS), accessed via USAFacts. It details year-over-year inflation rates from Sept. 2024 to Sept. 2025, based on CPI-U (a measure of the average change over time in prices paid by urban consumers).
| Product | Inflation (%) |
|---|---|
| 🥩 Beef & veal | 14.7 |
| 🚗 Car maintenance & repair | 7.7 |
| 🏠 Home insurance | 7.5 |
| 🚬 Tobacco products | 6.9 |
| 🍭 Sugar & sweets | 6.7 |
| ⚡ Electricity | 6.4 |
| 🏥 Hospital services | 5.8 |
| 🚰 Water & trash collection services | 4.8 |
| 📦 Postage & delivery services | 4.7 |
| 🛠️ Tools and home hardware | 4.3 |
| 🩺 Health insurance | 4.2 |
| 🛋️ Furniture & bedding | 3.8 |
| 🐶 Pets (incl. products & services) | 3.5 |
| 🏢 Rent | 3.4 |
| 🚘 Car insurance | 3.1 |
| 🎓 School tuition | 2.9 |
| 🥕 Fresh vegetables | 2.8 |
| 🐟 Seafood | 2.1 |
| 💍 Jewelry & watches | 2.0 |
| 🚌 Public transportation | 1.8 |
| 🚙 New & used cars | 1.7 |
| 🥓 Pork | 1.6 |
| 🐔 Poultry | 1.4 |
| 👟 Footwear | 1.3 |
| 🔌 Appliances | 1.3 |
| 🩻 Medical equipment & supplies | 0.8 |
| 🧀 Dairy products | 0.7 |
| 💊 Medicinal drugs | 0.6 |
| 🍷 Alcoholic beverages | 0.3 |
| 🏀 Sporting goods | 0 |
| 🍎 Fresh fruits | -0.2 |
| ⛽ Gas | -0.4 |
| 🥚 Eggs | -1.3 |
| 📞 Telephone services | -1.8 |
| 👗 Women’s apparel | -2.0 |
| 💻 IT hardware & services | -2.0 |
Food and Household Staples Lead Price Increases
Among the categories shown, beef and veal prices jumped 14.7%, leading the pack.
Food inflation has been a major pain point in recent years, with a recent survey finding that 90% of American adults are stressed about the cost of groceries.
Sugar, sweets, and other processed food items also became more expensive, reinforcing the trend that grocery store essentials are rising in cost.
Deflation Hits Tech, Apparel, and Energy
While some prices continue to climb, other categories are seeing declines. IT hardware and services (-2%), women’s apparel (-2%), and gasoline (-0.4%) have all recorded price decreases over the past year ending Sept. 2025.
Note that within the IT hardware category (e.g. computers, peripherals, smart-home devices), the BLS makes price adjustments based on quality. As devices become more capable, the “effective price” paid by consumers may fall even if nominal sticker prices have not.
Learn More on the Voronoi App 
If you enjoyed today’s post, check out The Biggest Challenges Americans Face in 2025 on Voronoi, the new app from Visual Capitalist.
Maps
Mapped: The World’s Hardest Working Countries in 2025
Bhutan leads with 54.5 hours weekly, while the Netherlands averages 26.8.

Published
2 hours ago
on
November 7, 2025
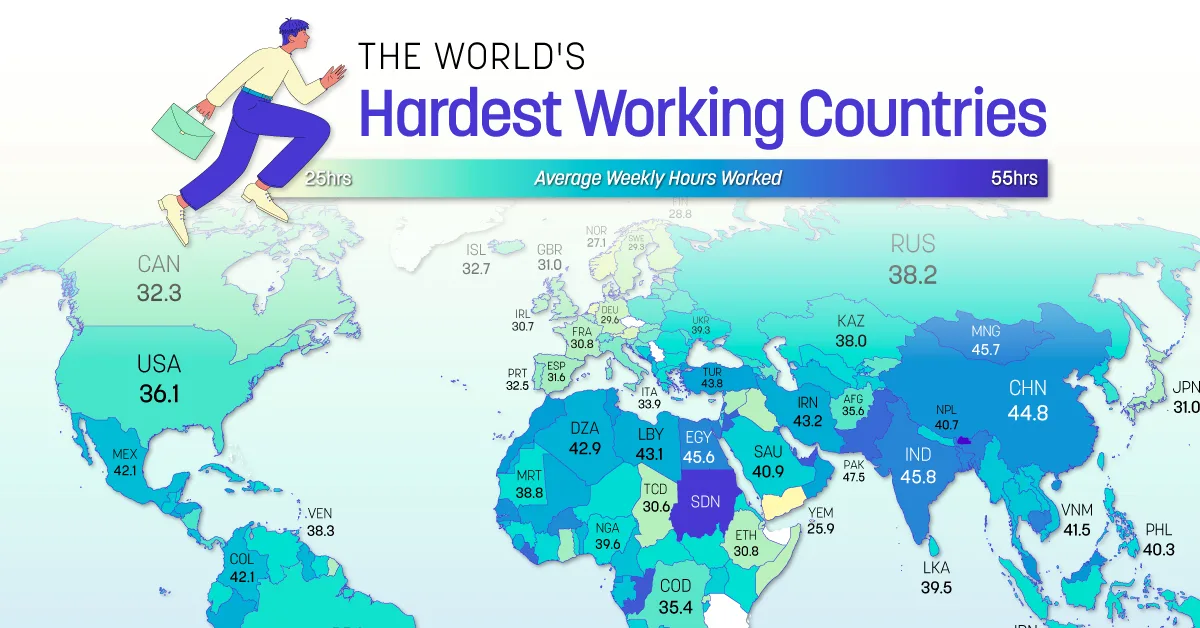
Mapped: The World’s Hardest Working Countries in 2025
See visuals like this from many other data creators on our Voronoi app. Download it for free on iOS or Android and discover incredible data-driven charts from a variety of trusted sources.
Key Takeaways
- Bhutan tops the global list with over 54 hours worked weekly, while the Netherlands averages 26.8 hours.
- Developed European countries tend to work fewer hours, while many Asian, Gulf, and African countries record longer workweeks.
This visualization ranks over 150 countries by the typical number of hours worked per week in 2025.
While global labor averages hover around 38.7 hours per week, the gap between the hardest- and lightest-working nations stretches nearly 30 hours.
The data for this visualization comes from the World Population Review. It compiles national estimates of average weekly working hours across formal and informal labor sectors.
Bhutan Leads the World in Working Hours
In 2025, Bhutan stands out as the world’s hardest-working nation, with employees clocking an average of 54.5 hours per week. Many South and Southeast Asian economies also appear near the top, including the UAE (48.4 hours), Pakistan (47.5 hours), and India (45.8 hours).
Extended workweeks in these regions often reflect labor-intensive industries, fewer part-time roles, and smaller social safety nets—factors that drive longer hours for both employees and self-employed workers.
| Country | Region | Weekly Hours Worked |
|---|---|---|
| 🇧🇹 Bhutan | Asia | 54.5 |
| 🇸🇩 Sudan | Africa | 50.8 |
| 🇱🇸 Lesotho | Africa | 50.2 |
| 🇨🇬 Republic of the Congo | Africa | 48.7 |
| 🇦🇪 UAE | Asia | 48.4 |
| 🇸🇹 Sao Tome & Principe | Africa | 48.2 |
| 🇯🇴 Jordan | Asia | 47.8 |
| 🇱🇷 Liberia | Africa | 47.5 |
| 🇵🇰 Pakistan | Asia | 47.5 |
| 🇶🇦 Qatar | Asia | 46.8 |
| 🇱🇧 Lebanon | Asia | 46.4 |
| 🇰🇭 Cambodia | Asia | 45.9 |
| 🇲🇻 Maldives | Asia | 45.9 |
| 🇧🇩 Bangladesh | Asia | 45.8 |
| 🇮🇳 India | Asia | 45.8 |
| 🇲🇳 Mongolia | Asia | 45.7 |
| 🇲🇴 Macau | Asia | 45.7 |
| 🇪🇬 Egypt | Africa | 45.6 |
| 🇧🇫 Burkina Faso | Africa | 45.3 |
| 🇨🇻 Cape Verde | Africa | 45.3 |
| 🇿🇼 Zimbabwe | Africa | 45.0 |
| 🇸🇳 Senegal | Africa | 44.9 |
| 🇧🇳 Brunei | Asia | 44.8 |
| 🇨🇳 China | Asia | 44.8 |
| 🇸🇬 Singapore | Asia | 44.6 |
| 🇰🇼 Kuwait | Asia | 44.6 |
| 🇲🇾 Malaysia | Asia | 44.6 |
| 🇼🇸 Samoa | Oceania | 44.5 |
| 🇲🇪 Montenegro | Europe | 44.2 |
| 🇲🇦 Morocco | Africa | 44.1 |
| 🇹🇳 Tunisia | Africa | 44.0 |
| 🇬🇶 Equatorial Guinea | Africa | 43.9 |
| 🇹🇷 Turkey | Asia | 43.8 |
| 🇴🇲 Oman | Asia | 43.6 |
| 🇯🇲 Jamaica | North America | 43.5 |
| 🇧🇼 Botswana | Africa | 43.4 |
| 🇵🇪 Peru | South America | 43.2 |
| 🇮🇷 Iran | Asia | 43.2 |
| 🇲🇱 Mali | Africa | 43.1 |
| 🇱🇾 Libya | Africa | 43.1 |
| 🇭🇰 Hong Kong | Asia | 43.1 |
| 🇸🇻 El Salvador | North America | 43.0 |
| 🇩🇿 Algeria | Africa | 42.9 |
| 🇭🇳 Honduras | North America | 42.8 |
| 🇸🇱 Sierra Leone | Africa | 42.7 |
| 🇬🇾 Guyana | South America | 42.6 |
| 🇧🇯 Benin | Africa | 42.5 |
| 🇪🇭 Western Sahara | Africa | 42.4 |
| 🇬🇼 Guinea-Bissau | Africa | 42.3 |
| 🇿🇲 Zambia | Africa | 42.3 |
| 🇿🇦 South Africa | Africa | 42.2 |
| 🇲🇽 Mexico | North America | 42.1 |
| 🇨🇴 Colombia | South America | 42.1 |
| 🇳🇦 Namibia | Africa | 42.0 |
| 🇨🇲 Cameroon | Africa | 41.9 |
| 🇹🇲 Turkmenistan | Asia | 41.9 |
| 🇬🇦 Gabon | Africa | 41.8 |
| 🇨🇷 Costa Rica | North America | 41.8 |
| 🇹🇭 Thailand | Asia | 41.6 |
| 🇻🇳 Vietnam | Asia | 41.5 |
| 🇲🇲 Myanmar | Asia | 41.5 |
| 🇭🇹 Haiti | North America | 41.4 |
| 🇦🇱 Albania | Europe | 41.4 |
| 🇬🇹 Guatemala | North America | 41.4 |
| 🇱🇦 Laos | Asia | 41.3 |
| 🇸🇿 Eswatini | Africa | 41.2 |
| 🇹🇯 Tajikistan | Asia | 41.0 |
| 🇧🇮 Burundi | Africa | 41.0 |
| 🇹🇿 Tanzania | Africa | 40.9 |
| 🇺🇬 Uganda | Africa | 40.9 |
| 🇸🇦 Saudi Arabia | Asia | 40.9 |
| 🇧🇦 Bosnia & Herzegovina | Europe | 40.8 |
| 🇨🇺 Cuba | North America | 40.8 |
| 🇰🇵 North Korea | Asia | 40.8 |
| 🇵🇾 Paraguay | South America | 40.7 |
| 🇳🇵 Nepal | Asia | 40.7 |
| 🇦🇴 Angola | Africa | 40.7 |
| 🇨🇮 Ivory Coast | Africa | 40.4 |
| 🇵🇬 Papua New Guinea | Oceania | 40.4 |
| 🇧🇿 Belize | North America | 40.4 |
| 🇺🇿 Uzbekistan | Asia | 40.4 |
| 🇵🇭 Philippines | Asia | 40.3 |
| 🇻🇨 Saint Vincent & the Grenadines | North America | 39.8 |
| 🇳🇪 Niger | Africa | 39.8 |
| 🇸🇷 Suriname | South America | 39.7 |
| 🇳🇬 Nigeria | Africa | 39.6 |
| 🇱🇨 Saint Lucia | North America | 39.6 |
| 🇵🇸 Palestine | Asia | 39.5 |
| 🇱🇰 Sri Lanka | Asia | 39.5 |
| 🇧🇭 Bahrain | Asia | 39.5 |
| 🇹🇹 Trinidad & Tobago | North America | 39.4 |
| 🇺🇦 Ukraine | Europe | 39.3 |
| 🇰🇪 Kenya | Africa | 39.1 |
| 🇬🇳 Guinea | Africa | 39.1 |
| 🇹🇼 Taiwan | Asia | 39.1 |
| 🇲🇷 Mauritania | Africa | 38.8 |
| 🇩🇴 Dominican Republic | North America | 38.7 |
| 🇷🇴 Romania | Europe | 38.6 |
| 🇪🇷 Eritrea | Africa | 38.4 |
| 🇷🇸 Serbia | Europe | 38.4 |
| 🇻🇪 Venezuela | South America | 38.3 |
| 🇲🇺 Mauritius | Africa | 38.3 |
| 🇧🇬 Bulgaria | Europe | 38.2 |
| 🇷🇺 Russia | Europe | 38.2 |
| 🇸🇸 South Sudan | Africa | 38.2 |
| 🇨🇫 Central African Republic | Africa | 38.1 |
| 🇦🇲 Armenia | Asia | 38.0 |
| 🇵🇷 Puerto Rico | North America | 38.0 |
| 🇰🇿 Kazakhstan | Asia | 38.0 |
| 🇪🇨 Ecuador | South America | 37.9 |
| 🇧🇴 Bolivia | South America | 37.8 |
| 🇬🇷 Greece | Europe | 37.8 |
| 🇬🇲 Gambia | Africa | 37.8 |
| 🇮🇩 Indonesia | Asia | 37.7 |
| 🇲🇰 North Macedonia | Europe | 37.5 |
| 🇰🇲 Comoros | Africa | 37.4 |
| 🇹🇬 Togo | Africa | 37.4 |
| 🇧🇷 Brazil | South America | 37.3 |
| 🇬🇪 Georgia | Asia | 37.1 |
| 🇲🇩 Moldova | Europe | 37.0 |
| 🇬🇺 Guam | Oceania | 36.9 |
| 🇧🇸 Bahamas | North America | 36.9 |
| 🇨🇱 Chile | South America | 36.9 |
| 🇰🇷 South Korea | Asia | 36.8 |
| 🇵🇱 Poland | Europe | 36.7 |
| 🇵🇦 Panama | North America | 36.2 |
| 🇧🇧 Barbados | North America | 36.1 |
| 🇳🇮 Nicaragua | North America | 36.1 |
| 🇺🇸 U.S. | North America | 36.1 |
| 🇧🇾 Belarus | Europe | 36.1 |
| 🇻🇮 U.S. Virgin Islands | North America | 35.9 |
| 🇫🇯 Fiji | Oceania | 35.7 |
| 🇳🇨 New Caledonia | Oceania | 35.6 |
| 🇦🇫 Afghanistan | Asia | 35.6 |
| 🇨🇩 DR Congo | Africa | 35.4 |
| 🇸🇧 Solomon Islands | Oceania | 35.3 |
| 🇰🇬 Kyrgyzstan | Asia | 35.2 |
| 🇭🇺 Hungary | Europe | 35.1 |
| 🇮🇱 Israel | Asia | 35.0 |
| 🇵🇫 French Polynesia | Oceania | 35.0 |
| 🇱🇻 Latvia | Europe | 35.0 |
| 🇱🇹 Lithuania | Europe | 34.9 |
| 🇨🇭 Switzerland | Europe | 34.9 |
| 🇺🇾 Uruguay | South America | 34.7 |
| 🇦🇷 Argentina | South America | 34.7 |
| 🇲🇬 Madagascar | Africa | 34.6 |
| 🇦🇿 Azerbaijan | Asia | 34.4 |
| 🇭🇷 Croatia | Europe | 34.3 |
| 🇹🇱 Timor-Leste | Asia | 34.2 |
| 🇨🇾 Cyprus | Asia | 34.2 |
| 🇮🇹 Italy | Europe | 33.9 |
| 🇸🇰 Slovakia | Europe | 33.9 |
| 🇳🇿 New Zealand | Oceania | 33.7 |
| 🇸🇮 Slovenia | Europe | 33.7 |
| 🇲🇹 Malta | Europe | 32.9 |
| 🇮🇸 Iceland | Europe | 32.7 |
| 🇵🇹 Portugal | Europe | 32.5 |
| 🇱🇺 Luxembourg | Europe | 32.4 |
| 🇨🇦 Canada | North America | 32.3 |
| 🇬🇭 Ghana | Africa | 31.8 |
| 🇧🇪 Belgium | Europe | 31.8 |
| 🇦🇺 Australia | Oceania | 31.8 |
| 🇪🇸 Spain | Europe | 31.6 |
| 🇸🇾 Syria | Asia | 31.2 |
| 🇪🇪 Estonia | Europe | 31.1 |
| 🇯🇵 Japan | Asia | 31.0 |
| 🇬🇧 UK | Europe | 31.0 |
| 🇫🇷 France | Europe | 30.8 |
| 🇪🇹 Ethiopia | Africa | 30.8 |
| 🇹🇴 Tonga | Oceania | 30.7 |
| 🇲🇼 Malawi | Africa | 30.7 |
| 🇮🇪 Ireland | Europe | 30.7 |
| 🇹🇩 Chad | Africa | 30.5 |
| 🇷🇼 Rwanda | Africa | 30.5 |
| 🇮🇶 Iraq | Asia | 30.4 |
| 🇩🇯 Djibouti | Africa | 30.2 |
| 🇸🇴 Somalia | Africa | 30.1 |
| 🇩🇪 Germany | Europe | 29.6 |
| 🇸🇪 Sweden | Europe | 29.3 |
| 🇲🇿 Mozambique | Africa | 29.0 |
| 🇻🇺 Vanuatu | Oceania | 29.0 |
| 🇫🇮 Finland | Europe | 28.8 |
| 🇩🇰 Denmark | Europe | 28.8 |
| 🇦🇹 Austria | Europe | 28.4 |
| 🇳🇴 Norway | Europe | 27.1 |
| 🇳🇱 Netherlands | Europe | 26.8 |
| 🇾🇪 Yemen | Asia | 25.9 |
Europe’s Short Workweeks Reflect Developed Economies
At the opposite end of the spectrum, Western and Northern Europe maintain some of the shortest working weeks on record. The Netherlands (26.8 hours), Norway (27.1 hours), and Denmark (28.8 hours) all fall below 30 hours weekly.
These countries benefit from strong productivity, high automation, and generous labor protections. Shorter average hours are often paired with higher living standards and better work-life balance.
The United States Sits Mid-Pack
The United States averages around 36.1 hours per week, below the global mean but above other major developed nations such as Canada (32.3 hours), the UK (31.0 hours), and France (30.8 hours).
In contrast, emerging markets—particularly in Africa—show some of the highest workweeks, such as Sudan (50.8 hours) and Lesotho (50.2 hours), where economic necessity drives longer working days.
Learn More on the Voronoi App
If you enjoyed today’s post, check out Where’s the World Heading in 2026? on Voronoi, the new app from Visual Capitalist.
Maps
Mapped: The States Most Dependent on Food Stamps
See which U.S. states rely most on SNAP.
Published
4 hours ago
on
November 7, 2025
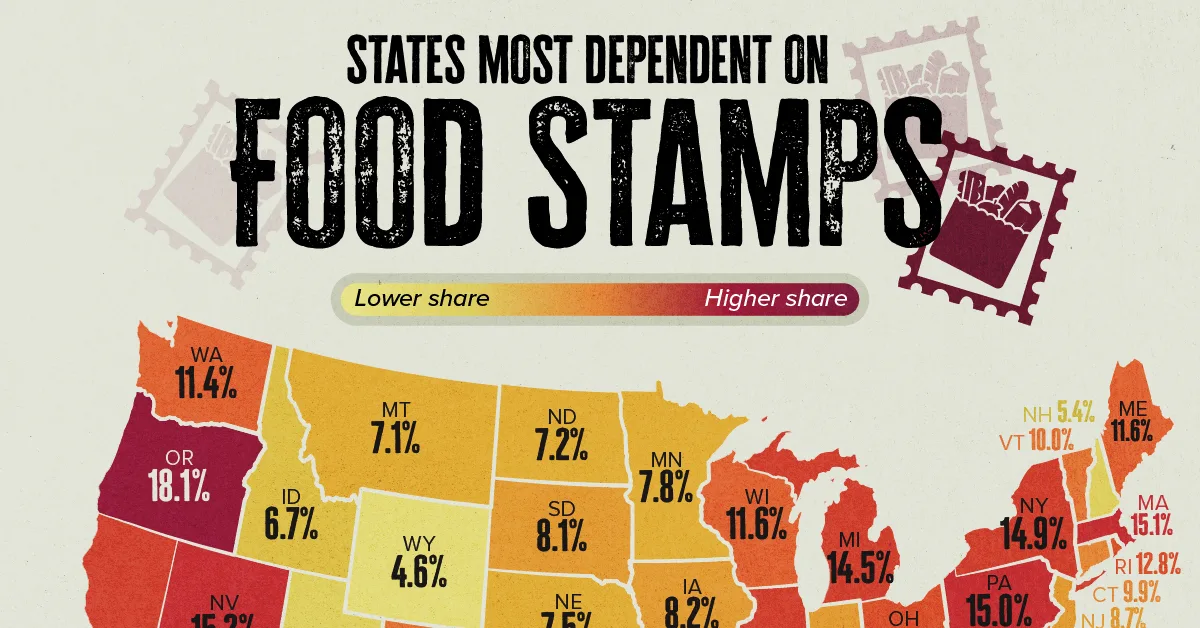
Mapped: The States Most Dependent on Food Stamps
See visuals like this from many other data creators on our Voronoi app. Download it for free on iOS or Android and discover incredible data-driven charts from a variety of trusted sources.
Key Takeaways
- New Mexico has the highest SNAP reliance in the U.S., with over 21% of residents enrolled.
- Wyoming and Utah report the lowest participation, both around 5% of their populations.
- A federal judge ordered the Trump administration to fully fund SNAP benefits for November, rejecting its plan to partially fund the food stamp program for 42 million Americans during the government shutdown.
The Supplemental Nutrition Assistance Program (SNAP) is the largest federal food assistance initiative in the U.S., supporting roughly one in eight Americans. The program helps low-income households purchase groceries, with monthly benefits averaging around $180 per person nationwide.
This visualization highlights the states most reliant on food stamps, based on 2025 data from SmartAsset. While participation rates vary widely, the figures reveal stark contrasts in economic need and cost of living across states.
New Mexico Leads in SNAP Dependence
New Mexico stands out as the most SNAP-dependent state, with 21.5% of residents receiving assistance, nearly double the national average. The average monthly benefit there is $176.51 per person, totaling over $80 million in monthly aid. Persistent poverty rates and rural isolation help explain the state’s high reliance on federal food assistance.
Oregon follows closely at 18.1% enrollment, while Louisiana ranks third at 17.5%. In each case, elevated unemployment and cost pressures have contributed to continued demand for benefits.
Coastal and Urban States See Higher Benefit Amounts
States like New York ($218.44), Massachusetts ($215.64), and Hawaii ($361.78) report some of the highest average benefits per person. These higher payments reflect steeper living costs in dense urban and island economies.
| Rank | State | Population with SNAP | Avg benefit per person | Number of beneficiaries | Total monthly benefits |
|---|---|---|---|---|---|
| 1 | New Mexico | 21.5% | $176.51 | 457,699 | $80,790,060 |
| 2 | Oregon | 18.1% | $182.17 | 772,893 | $140,797,421 |
| 3 | Louisiana | 17.5% | $186.90 | 803,988 | $150,268,544 |
| 4 | Oklahoma | 16.9% | $186.85 | 692,477 | $129,386,266 |
| 5 | W. Virginia | 15.5% | $167.74 | 273,566 | $45,886,908 |
| 6 | Nevada | 15.2% | $171.80 | 496,848 | $85,360,880 |
| 7 | Massachusetts | 15.1% | $215.64 | 1,076,187 | $232,066,810 |
| 8 | Pennsylvania | 15.0% | $181.70 | 1,958,047 | $355,777,154 |
| 9 | New York | 14.9% | $218.44 | 2,962,913 | $647,210,404 |
| 10 | Illinois | 14.8% | $195.94 | 1,879,564 | $368,278,250 |
| 11 | Michigan | 14.5% | $175.44 | 1,473,832 | $258,575,524 |
| 12 | Alabama | 14.3% | $193.08 | 736,178 | $142,142,795 |
| 13 | California | 13.9% | $190.25 | 5,494,318 | $1,045,310,679 |
| 14 | Kentucky | 13.0% | $178.94 | 595,155 | $106,498,834 |
| 15 | Rhode Island | 12.8% | $200.95 | 142,726 | $28,680,737 |
| 16 | Florida | 12.6% | $181.97 | 2,943,012 | $535,551,777 |
| 17 | North Carolina | 12.5% | $174.75 | 1,378,291 | $240,858,724 |
| 18 | Ohio | 12.2% | $186.03 | 1,450,955 | $269,917,495 |
| 19 | Georgia | 12.1% | $186.08 | 1,356,493 | $252,417,633 |
| 20 | Mississippi | 12.1% | $180.46 | 357,042 | $64,432,174 |
| 21 | Arizona | 11.7% | $182.25 | 887,253 | $161,705,602 |
| 22 | Maine | 11.6% | $176.55 | 163,520 | $28,869,975 |
| 23 | Wisconsin | 11.6% | $163.89 | 689,315 | $112,973,934 |
| 24 | Washington | 11.4% | $184.51 | 905,471 | $167,068,578 |
| 25 | Hawaii | 11.3% | $361.78 | 163,576 | $59,178,123 |
| 26 | Delaware | 11.2% | $180.54 | 118,209 | $21,340,950 |
| 27 | Texas | 11.0% | $177.82 | 3,455,085 | $614,386,464 |
| 28 | Maryland | 10.7% | $182.49 | 667,981 | $121,902,010 |
| 29 | Missouri | 10.5% | $196.10 | 655,940 | $128,629,589 |
| 30 | South Carolina | 10.4% | $186.42 | 567,895 | $105,867,349 |
| 31 | Colorado | 10.3% | $195.97 | 614,843 | $120,493,408 |
| 32 | Vermont | 10.0% | $188.75 | 64,633 | $12,199,424 |
| 33 | Connecticut | 9.9% | $192.89 | 363,524 | $70,118,853 |
| 34 | Tennessee | 9.6% | $203.20 | 690,545 | $140,318,213 |
| 35 | Virginia | 9.4% | $173.84 | 824,866 | $143,392,688 |
| 36 | Alaska | 9.0% | $364.31 | 66,377 | $24,181,479 |
| 37 | New Jersey | 8.7% | $194.63 | 826,094 | $160,778,766 |
| 38 | Indiana | 8.5% | $195.71 | 586,403 | $114,763,019 |
| 39 | Iowa | 8.2% | $169.04 | 267,158 | $45,159,537 |
| 40 | South Dakota | 8.1% | $198.24 | 75,282 | $14,923,544 |
| 41 | Minnesota | 7.8% | $158.45 | 451,966 | $71,616,027 |
| 42 | Arkansas | 7.8% | $172.82 | 239,748 | $41,434,391 |
| 43 | Nebraska | 7.5% | $181.00 | 150,600 | $27,258,920 |
| 44 | North Dakota | 7.2% | $174.33 | 57,129 | $9,959,141 |
| 45 | Montana | 7.1% | $170.68 | 80,523 | $13,743,731 |
| 46 | Idaho | 6.7% | $179.01 | 133,545 | $23,906,189 |
| 47 | Kansas | 6.3% | $177.23 | 186,036 | $32,971,957 |
| 48 | New Hampshire | 5.4% | $169.56 | 75,717 | $12,838,748 |
| 49 | Utah | 5.1% | $192.17 | 177,087 | $34,030,139 |
| 50 | Wyoming | 4.6% | $183.81 | 27,122 | $4,985,385 |
In contrast, benefits tend to be smaller in lower-cost Midwestern states such as Wisconsin ($163.89) and Minnesota ($158.45), where overall food prices and housing costs are lower.
Low Participation in Western States
Wyoming has the lowest SNAP participation rate at just 4.6%, followed by Utah (5.1%) and New Hampshire (5.4%). Still, even in these states, food stamps remains a crucial safety net for tens of thousands of residents. Utah alone distributes more than $34 million in benefits each month to about 177,000 people.
Learn More on the Voronoi App
If you enjoyed today’s post, check out The Longest Government Shutdown in U.S. History on Voronoi, the new app from Visual Capitalist.